Key points
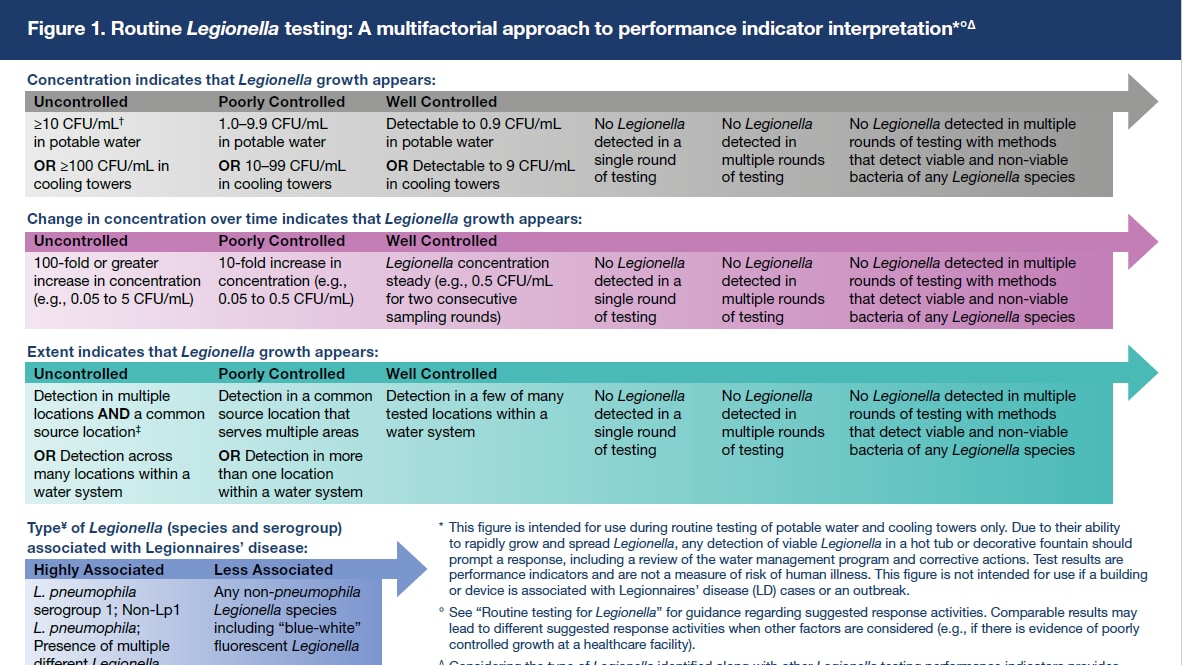
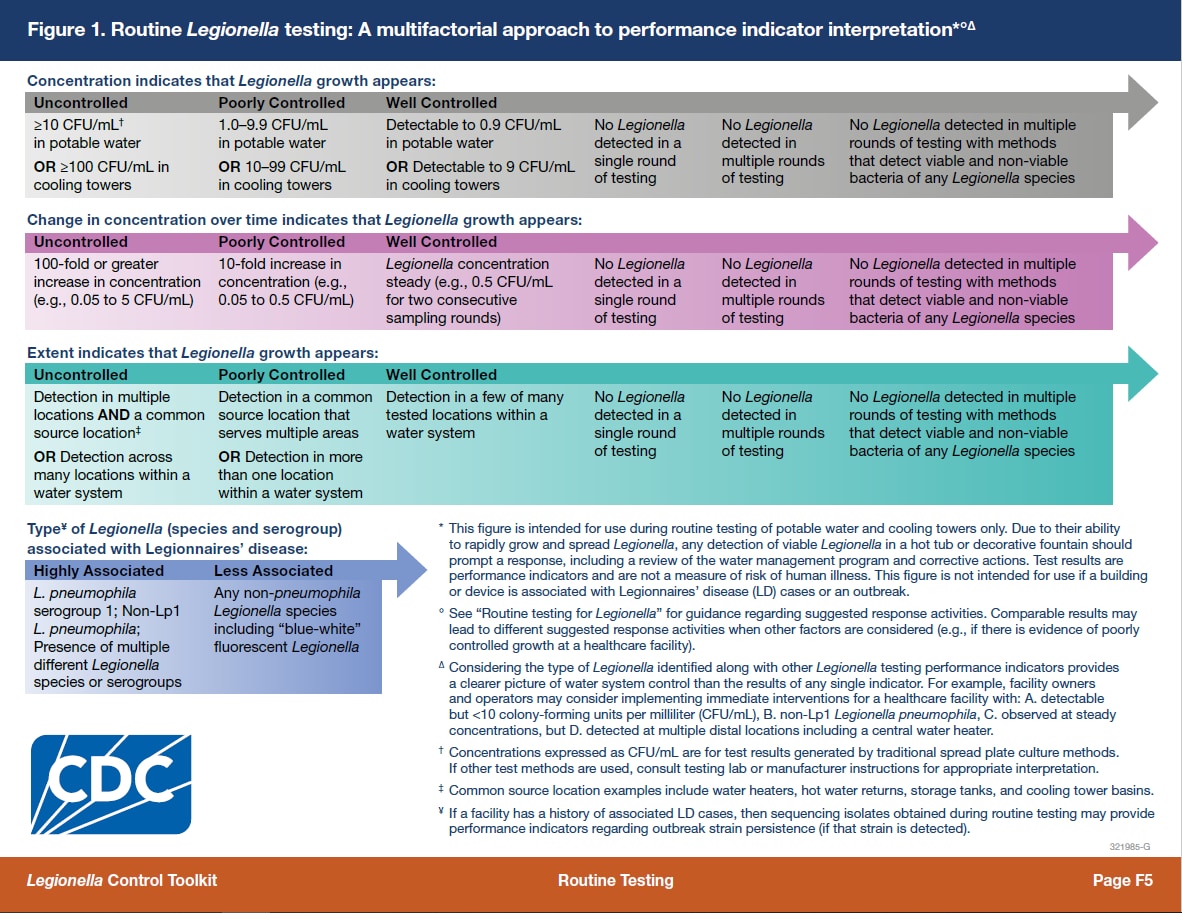
- This detailed chart visualizes a multifactorial approach to interpreting Legionella test results as performance indicators.
- It supplements the routine testing module of CDC's Legionella Control Toolkit.

Figure 1
Read Text Equivalent (for Section 508 access).
Download a PDF version of the figure.

Read text equivalent
Figure 1A: Routine Legionella testingB: A multifactorial approach to performance indicator interpretationC
This figure has four separate sections that represent different factors of consideration for routine Legionella test results:
- Concentration
- Concentration change over time
- Colonization
- Species and serogroup
Section 1: Concentration
The first section relates to the way in which concentration indicates that Legionella growth appears
- Uncontrolled
- Poorly controlled
- Well controlled
Of note, examples are provided along a continuum with a gradient.
Uncontrolled
Detection of the following indicates that Legionella growth appears uncontrolled
- Greater than or equal to 10 CFU/mLD in potable water
- Greater than or equal to 100 CFU/mL in cooling towers
Poorly controlled
Detection of the following indicates that Legionella growth appears poorly controlled:
- 1.0-9.9 CFU/mL in potable water
- 10-99 CFU/mL in cooling towers
Well controlled
Detection of the following indicates that Legionella growth appears well controlled:
- Any to 0.9 CFU/mL in potable water
- Any to 9 CFU/mL in cooling towers
Additional indicators that Legionella growth appears well controlled are listed below. Each subsequent bullet is a stronger indicator of control that the ones prior.
- No Legionella detected
- No Legionella detected in multiple rounds of testing
- No Legionella (viable or not; all species) detected in multiple rounds
Section 2: Concentration change over time
The second section relates to the way in which concentration change over time indicates that Legionella growth appears
- Uncontrolled
- Poorly controlled
- Well controlled
Of note, examples are provided along a continuum with a gradient.
Uncontrolled
A 100-fold or greater increase in concentration indicates that Legionella growth appears uncontrolled.
Example: An increase from 0.05 CFU/mL to 5 CFU/mL
Poorly controlled
A 10-fold increase in concentration indicates that Legionella growth appears poorly controlled.
Example: An increase from 0.05 CFU/mL to 0.5 CFU/mL
Well controlled
Steady Legionella concentration indicates that Legionella growth appears well controlled.
Example: 0.5 CFU/mL for two consecutive sampling rounds
Additional indicators that Legionella growth appears well controlled are listed below. Each subsequent bullet is a stronger indicator of control that the ones prior.
- No Legionella detected
- No Legionella detected in multiple rounds of testing
- No Legionella (viable or not; all species) detected in multiple rounds
Section 3: Colonization
The third section relates to the way in which extent of colonization indicates that Legionella growth appears
- Uncontrolled
- Poorly controlled
- Well controlled
Of note, examples are provided along a continuum with a gradient.
Uncontrolled
Detection in the both of the following indicates that Legionella growth appears uncontrolled
- Multiple locations
- A common source locationE that serves multiple areas
Similarly, detection across many locations within a water system indicates that Legionella growth appears uncontrolled.
Poorly controlled
Detection in one of the following indicates that Legionella growth appears poorly controlled
- A common source location
- More than one location within a water system
Well controlled
Detection in a few of many tested locations within a water system indicates that Legionella growth appears well controlled.
Additional indicators that Legionella growth appears well controlled are listed below. Each subsequent bullet is a stronger indicator of control that the ones prior.
- No Legionella detected
- No Legionella detected in multiple rounds of testing
- No Legionella (viable or not; all species) detected in multiple rounds
Section 4: Species and serogroup
The fourth section explains how the type of LegionellaF, such as species and serogroup, is associated with Legionnaires' disease.
Highly associated with disease
The following are highly associated with Legionnaires' disease
- Legionella pneumophila serogroup 1 (Lp1)
- Non-Lp1 Legionella pneumophila
- Presence of multiple different Legionella species or serogroups
Less associated with disease
Any non-pneumophila Legionella species, including "blue-white" fluorescent Legionella species are less associated with Legionnaires' disease.
- See Routine testing for Legionella for guidance regarding suggested response activities. Comparable results may lead to different suggested response activities when other factors are considered (e.g., if there's evidence of poorly controlled growth at a healthcare facility).
- This figure is intended for use during routine testing of potable water and cooling towers only. Due to their ability to rapidly grow and spread Legionella, any detection of viable Legionella in a hot tub or decorative fountain should prompt a response, including a review of the water management program and corrective actions. Test results are performance indicators and are not a measure of risk of human illness. This figure is not intended for use if a building or device is associated with Legionnaires’ disease (LD) cases or an outbreak.
- Considering the type of Legionella identified along with other performance indicators provides a clearer picture of water system control than the results of any single indicator. For example, facility owners and operators may consider implementing immediate interventions for a healthcare facility with: A. detectable but less than 10 colony-forming units per milliliter (CFU/mL†), B. non-Lp1 Legionella pneumophila, C. observed at steady concentrations, but D. detected at multiple locations including a central water heater.
- Concentrations expressed as CFU/mL are for test results generated by traditional spread plate culture methods. If other test methods are used, consult testing lab or manufacturer's instructions for appropriate interpretation.
- Common source locations include water heaters, hot water returns, storage tanks, and cooling tower basins.
- If a facility has a history of associated Legionnaires' disease cases, then sequencing isolates obtained during routine testing may provide performance indicators regarding outbreak strain persistence (if that strain is detected).
