Key points
CDI provides valuable surveillance data that public health professionals, researchers, and policymakers can use to track chronic diseases and their risk factors at the national and state level. It compiles estimates from various data sources [add link to new data sources page], including surveys, vital records, and administrative data. It uses standardized definitions to allow comparisons at national and state levels.

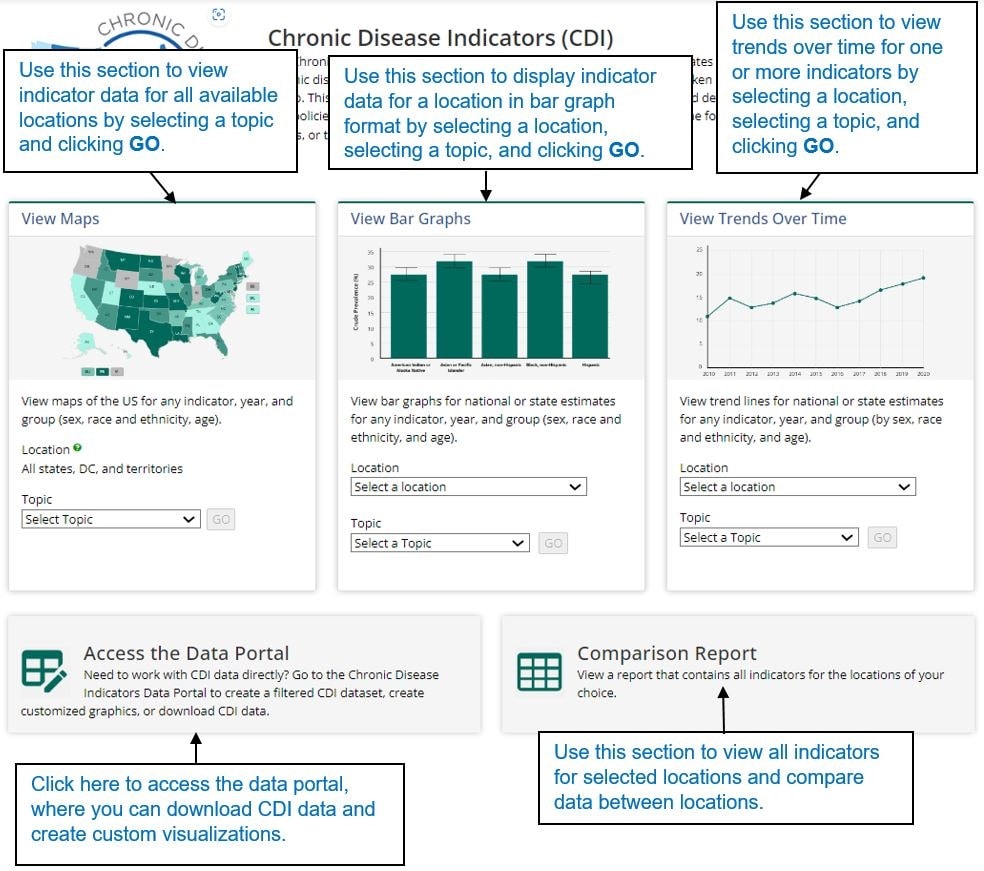
The Chronic Disease Indicators (CDI) home page
The CDI home page is the entry point into the system. Use this page to select information to view and also to select the format to use for visualizing the data.

View data on a map
The map allows you to view one indicator across all available locations.
To view data on a map: on the home page under view maps, select a topic and click go. The system displays a page for selecting an indicator to view in the map.
Note: When viewing data on a map, the system allows you to select only one indicator.
Select one indicator and click view results. The system displays the results in map format.
View data in graph format
The map allows you to view one indicator across all available locations.
To view data in bar graph format: on the home page under view bar graphs, select a topic, select a location, and click go. The system displays a page for selecting indicators to view in the graph.
Select at least one indicator and click view results. The system displays the results in graph format.
Stratifying data
To stratify the data being viewed, select the options for stratifying the data, i.e., year, view by, or data type, and click update. After the data is displayed, you can select the specific option to view the data by. For example, if you select to view data by Race/Ethnicity, you can further stratify the data by selecting Black non-Hispanic, Hispanic, White non-Hispanic, etc.
You can also stratify data when viewing all locations.
View data in table format
To view data in table format, click the table icon next to the graph icon.
If only one location is selected, the table displays information for one location.
View trends over time
You can view trends over time for one or more indicators.
Note: All locations except "All States, DC, and Territories" are available for trend lines.
To view trends over time: on the home page under view trends over time, select a location, select a topic, and click go.
Select one or more indicators to view in the trend line and click view results.
The system displays the results for the most recent year of data in graph format.
Under year, select all available years (trendline) option and click update.
Note: If you selected more than one indicator, select all available years (trendline) for each indicator and panel in order to display the trend line for the specific indicator.
The comparison report
The comparison report allows you to select locations and compare data between the locations for the most current year’s data.
Running a search
You can search for a term or string within all categories and indicators.
To run a search: enter the search criteria, e.g., cancer in the search report field and click search. The system searches within all indicators and categories and returns the results. The system expands the category in which a search term is found. The data displayed in the result defaults to the US. To view data for additional locations, click the add/remove locations link to add or remove a location from your search.
Adding and removing a location
You can select the locations that you want to add or remove from the list to be compared.
To add and remove locations to be compared, click the add/remove locations link. The system displays the compare locations pop-up window. You can select up to four locations to compare.
Select a check box to add a location or clear a check box to remove a location and click submit. The system saves the selections and displays the comparison report based on the selected locations. Click the + sign next to a topic to view the data for the selected locations and compare them.
Definitions and sources
Indicator definitions
The indicator definitions section provides a description for the indicators that are used on the page.
Data sources
The footnotes and data sources section at the bottom of the page display area provides more information for the content displayed in the panel. This section explains the symbols displayed on the page and lists the data source. To hide this section, click the hide footnotes link. To display it again, click the show footnotes link.
