BRFSS Prevalence & Trends Data Help
Viewing BRFSS Data by Topic
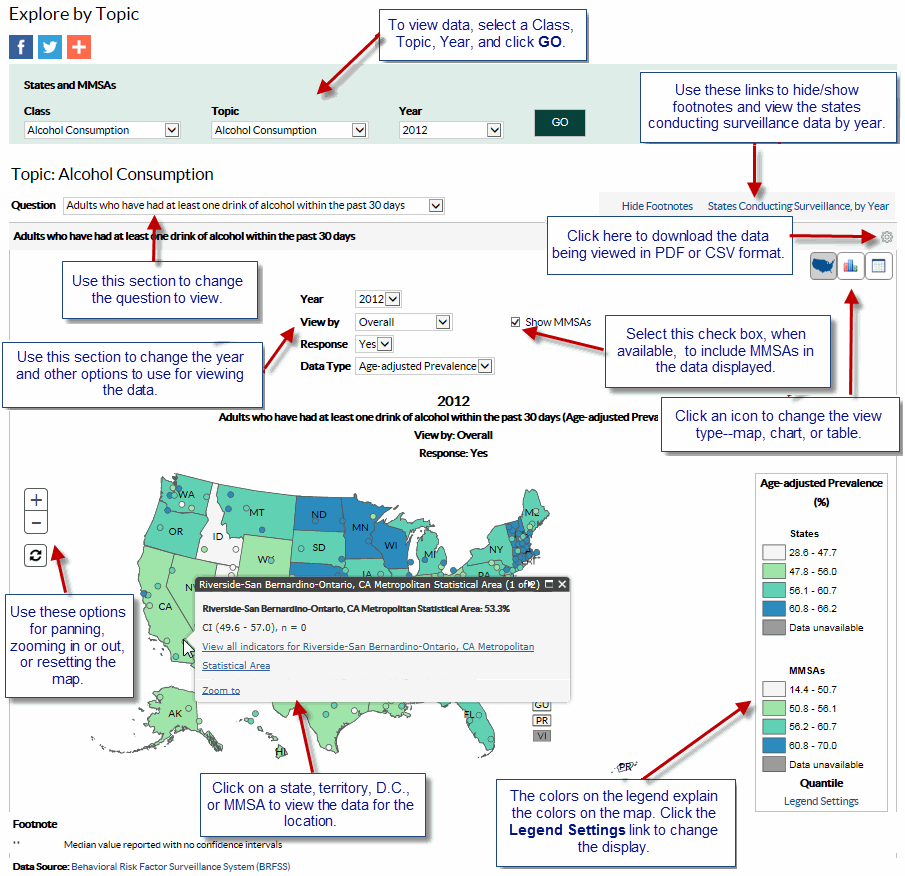
The Explore by Topic page allows you to view one topic across all available locations. Whenever available, you can use View By field to further stratify data. To begin, select a Class, Topic, and Year from the respective drop down lists and click GO. By default, the system displays the data in map format. You can then choose to view the data in chart or table format.
Viewing a map
After selecting a year, a color-coded map displays the data for the measure. A legend explaining the colors is displayed to the right of the map.

Viewing a chart
You can view data in a bar chart format by clicking the Chart icon next to the Map icon.

Viewing data in table format
You can view data in table format by clicking the Table icon next to the Chart icon.

Footnotes/Notes/Data Source
The Footnotes, Notes, and Data Source section at the bottom of a panel provides more information for the content displayed in the panel. This section explains the symbols displayed in a panel, displays important notes about the data, and also lists the data source. To hide this section, click the Hide Footnotes link, to display it again, click the Show Footnotes link.
Legend Settings
When viewing a map, you can change classification type to use for displaying the data ranges, and also change the number of classes displayed on the map.

Note
The Note section displays more information for the data displayed on the page.
Measure Definitions
The Measure Definitions section provides a description for the measures that are used on the page.
Suggested Citation
The Suggested Citation section provides reference information for the information displayed on the page.
Related Links
The Related Links section contains links to other sites on the Web. When you click these links, the system takes you to the related sites. These sites are not contained within the BRFSS Prevalence & Trends system.