Reported Tuberculosis in the United States, 2022
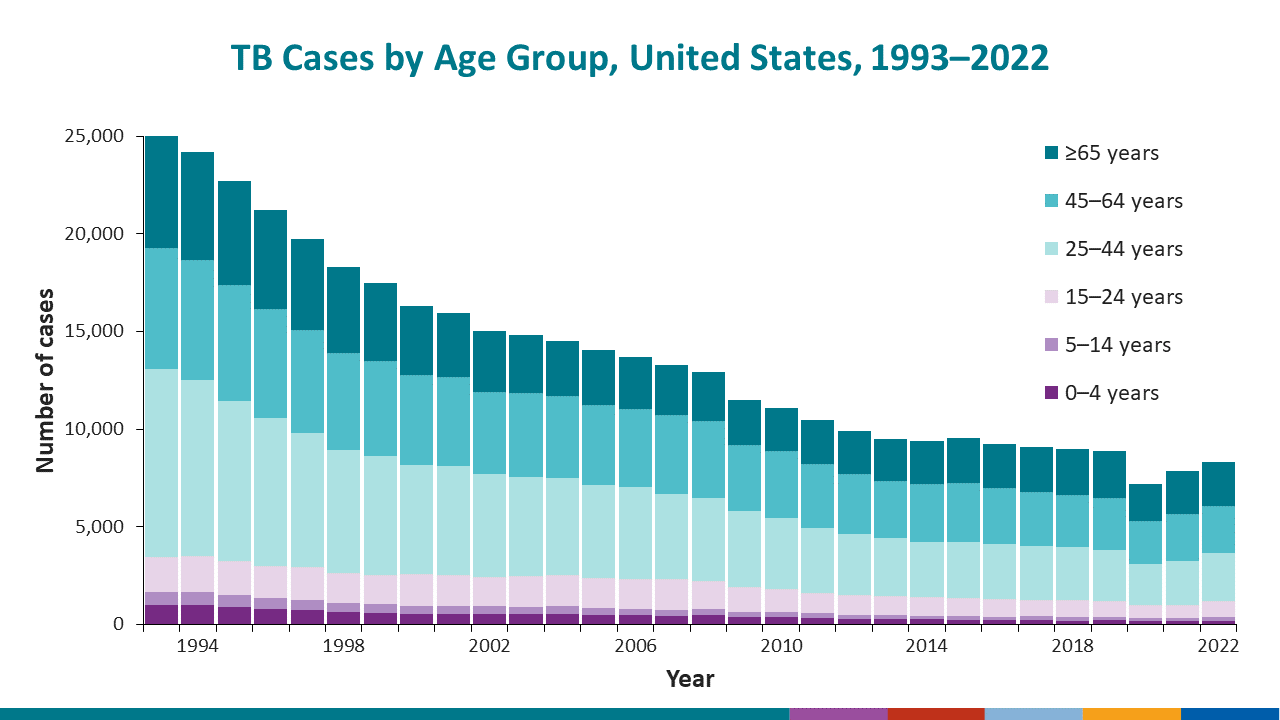
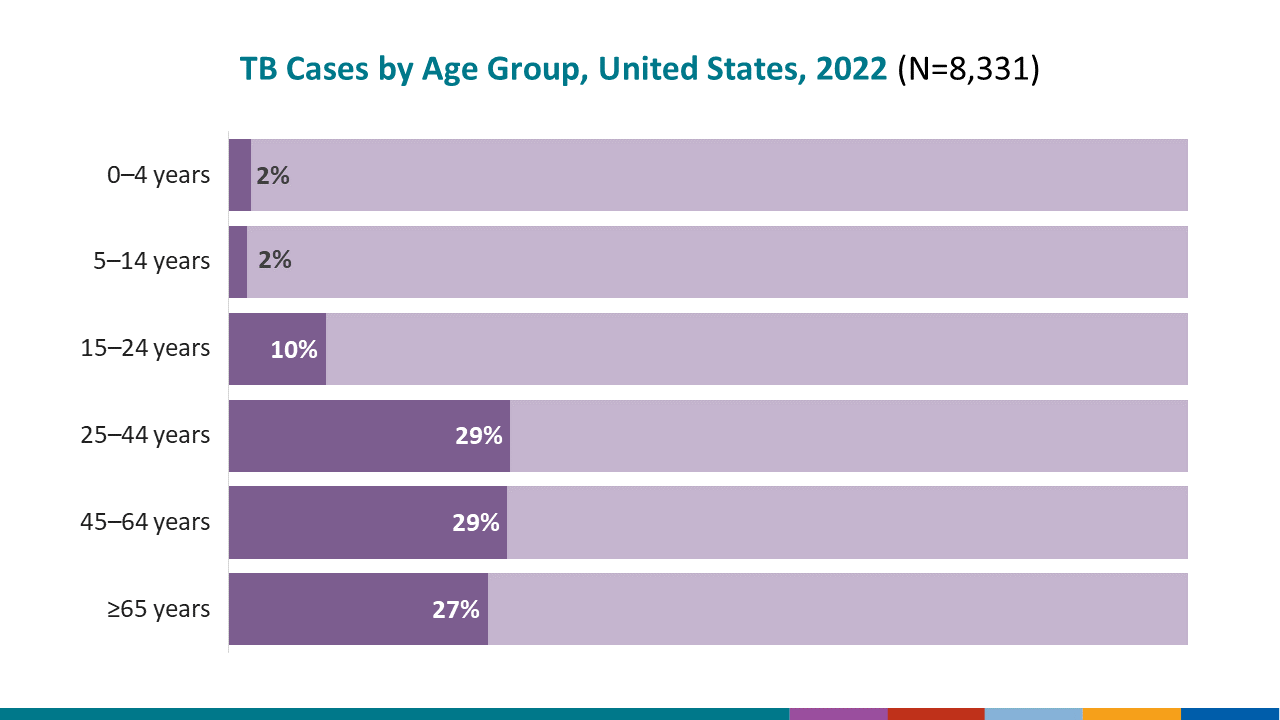
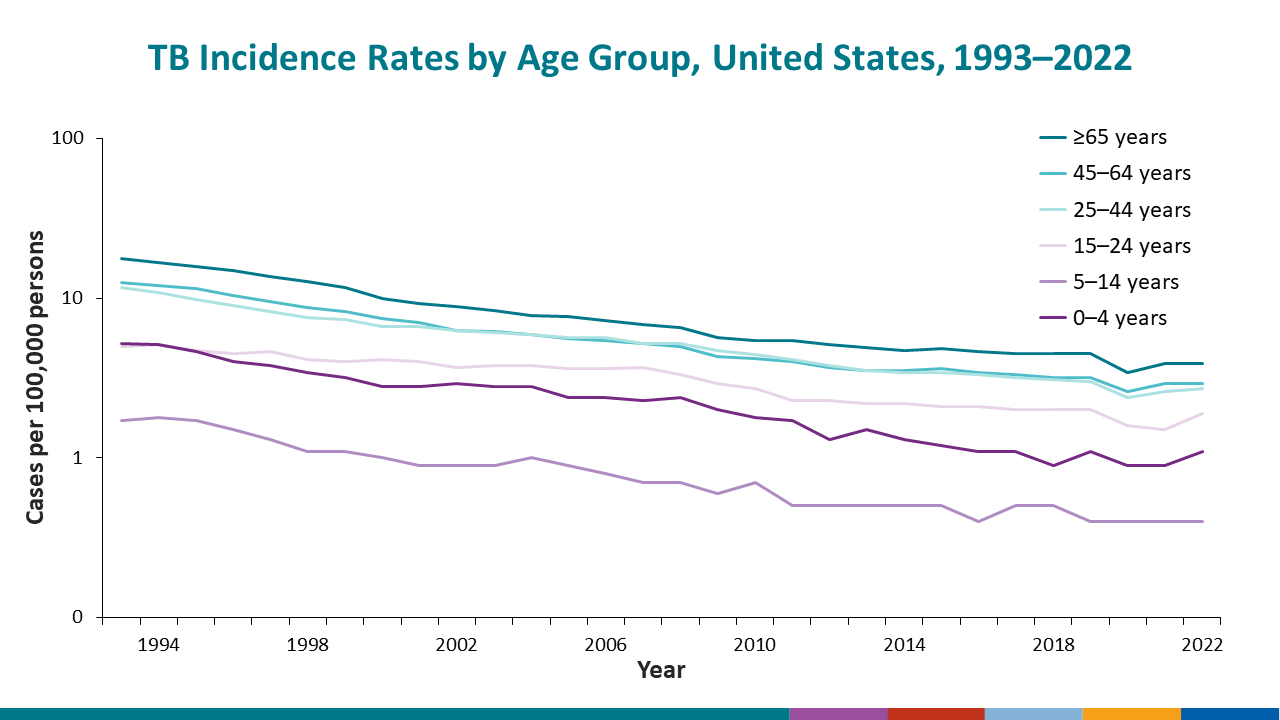
Table 5. Tuberculosis Cases, Percentages, and Incidence Rates per 100,000 Population by Age Group: United States, 1993–2022
See surveillance slides #26, #27, and #28.
| Year | Total cases | 0─4 | 5─14 | 15─24 | 25─44 | 45─64 | ≥65 | Unknown or missing | |||||||||||||
|---|---|---|---|---|---|---|---|---|---|---|---|---|---|---|---|---|---|---|---|---|---|
| No. | (%) | Rate | No. | (%) | Rate | No. | (%) | Rate | No. | (%) | Rate | No. | (%) | Rate | No. | (%) | Rate | No. | (%) | ||
| 2022 | 8,331 | 201 | (2.4) | 1.1 | 163 | (2.0) | 0.4 | 845 | (10.1) | 1.9 | 2,449 | (29.4) | 2.7 | 2,421 | (29.1) | 2.9 | 2,252 | (27.0) | 3.9 | 0 | (0.0) |
| 2021 | 7,870 | 159 | (2.0) | 0.9 | 156 | (2.0) | 0.4 | 676 | (8.6) | 1.5 | 2,265 | (28.8) | 2.6 | 2,409 | (30.6) | 2.9 | 2,205 | (28.0) | 3.9 | 0 | (0.0) |
| 2020 | 7,171 | 166 | (2.3) | 0.9 | 152 | (2.1) | 0.4 | 688 | (9.6) | 1.6 | 2,113 | (29.5) | 2.4 | 2,175 | (30.3) | 2.6 | 1,877 | (26.2) | 3.4 | 0 | (0.0) |
| 2019 | 8,895 | 215 | (2.4) | 1.1 | 150 | (1.7) | 0.4 | 850 | (9.6) | 2.0 | 2,611 | (29.4) | 3.0 | 2,658 | (29.9) | 3.2 | 2,411 | (27.1) | 4.5 | 0 | (0.0) |
| 2018 | 8,997 | 184 | (2.0) | 0.9 | 189 | (2.1) | 0.5 | 869 | (9.7) | 2.0 | 2,723 | (30.3) | 3.1 | 2,687 | (29.9) | 3.2 | 2,345 | (26.1) | 4.5 | 0 | (0.0) |
| 2017 | 9,069 | 228 | (2.5) | 1.1 | 202 | (2.2) | 0.5 | 842 | (9.3) | 2.0 | 2,752 | (30.3) | 3.2 | 2,751 | (30.3) | 3.3 | 2,292 | (25.3) | 4.5 | 2 | (0.0) |
| 2016 | 9,239 | 223 | (2.4) | 1.1 | 163 | (1.8) | 0.4 | 934 | (10.1) | 2.1 | 2,827 | (30.6) | 3.3 | 2,841 | (30.8) | 3.4 | 2,250 | (24.4) | 4.6 | 1 | (0.0) |
| 2015 | 9,538 | 244 | (2.6) | 1.2 | 196 | (2.1) | 0.5 | 936 | (9.8) | 2.1 | 2,859 | (30.0) | 3.4 | 3,020 | (31.7) | 3.6 | 2,283 | (23.9) | 4.8 | 0 | (0.0) |
| 2014 | 9,381 | 263 | (2.8) | 1.3 | 195 | (2.1) | 0.5 | 959 | (10.2) | 2.2 | 2,821 | (30.1) | 3.4 | 2,955 | (31.5) | 3.5 | 2,188 | (23.3) | 4.7 | 0 | (0.0) |
| 2013 | 9,513 | 294 | (3.1) | 1.5 | 188 | (2.0) | 0.5 | 973 | (10.2) | 2.2 | 2,954 | (31.1) | 3.5 | 2,938 | (30.9) | 3.5 | 2,166 | (22.8) | 4.9 | 0 | (0.0) |
| 2012 | 9,906 | 261 | (2.6) | 1.3 | 226 | (2.3) | 0.5 | 1,018 | (10.3) | 2.3 | 3,117 | (31.5) | 3.8 | 3,100 | (31.3) | 3.7 | 2,183 | (22.0) | 5.1 | 1 | (0.0) |
| 2011 | 10,471 | 350 | (3.3) | 1.7 | 225 | (2.1) | 0.5 | 1,027 | (9.8) | 2.3 | 3,355 | (32.0) | 4.1 | 3,280 | (31.3) | 4.0 | 2,234 | (21.3) | 5.4 | 0 | (0.0) |
| 2010 | 11,069 | 362 | (3.3) | 1.8 | 270 | (2.4) | 0.7 | 1,184 | (10.7) | 2.7 | 3,640 | (32.9) | 4.4 | 3,411 | (30.8) | 4.2 | 2,202 | (19.9) | 5.4 | 0 | (0.0) |
| 2009 | 11,491 | 403 | (3.5) | 2.0 | 244 | (2.1) | 0.6 | 1,277 | (11.1) | 2.9 | 3,879 | (33.8) | 4.7 | 3,412 | (29.7) | 4.3 | 2,276 | (19.8) | 5.7 | 0 | (0.0) |
| 2008 | 12,943 | 492 | (3.8) | 2.4 | 289 | (2.2) | 0.7 | 1,453 | (11.2) | 3.3 | 4,260 | (32.9) | 5.2 | 3,944 | (30.5) | 5.0 | 2,505 | (19.4) | 6.5 | 0 | (0.0) |
| 2007 | 13,276 | 462 | (3.5) | 2.3 | 304 | (2.3) | 0.7 | 1,580 | (11.9) | 3.7 | 4,318 | (32.5) | 5.2 | 4,040 | (30.4) | 5.2 | 2,571 | (19.4) | 6.8 | 1 | (0.0) |
| 2006 | 13,720 | 482 | (3.5) | 2.4 | 321 | (2.3) | 0.8 | 1,532 | (11.2) | 3.6 | 4,686 | (34.2) | 5.7 | 4,034 | (29.4) | 5.4 | 2,664 | (19.4) | 7.2 | 1 | (0.0) |
| 2005 | 14,053 | 474 | (3.4) | 2.4 | 376 | (2.7) | 0.9 | 1,538 | (10.9) | 3.6 | 4,735 | (33.7) | 5.7 | 4,123 | (29.3) | 5.6 | 2,807 | (20.0) | 7.7 | 0 | (0.0) |
| 2004 | 14,498 | 549 | (3.8) | 2.8 | 403 | (2.8) | 1.0 | 1,604 | (11.1) | 3.8 | 4,940 | (34.1) | 5.9 | 4,191 | (28.9) | 5.9 | 2,810 | (19.4) | 7.8 | 1 | (0.0) |
| 2003 | 14,835 | 546 | (3.7) | 2.8 | 364 | (2.5) | 0.9 | 1,573 | (10.6) | 3.8 | 5,073 | (34.2) | 6.1 | 4,284 | (28.9) | 6.2 | 2,995 | (20.2) | 8.4 | 0 | (0.0) |
| 2002 | 15,054 | 556 | (3.7) | 2.9 | 386 | (2.6) | 0.9 | 1,498 | (10.0) | 3.7 | 5,289 | (35.1) | 6.3 | 4,183 | (27.8) | 6.3 | 3,141 | (20.9) | 8.8 | 1 | (0.0) |
| 2001 | 15,946 | 542 | (3.4) | 2.8 | 384 | (2.4) | 0.9 | 1,597 | (10.0) | 4.0 | 5,615 | (35.2) | 6.6 | 4,514 | (28.3) | 7.0 | 3,293 | (20.7) | 9.3 | 1 | (0.0) |
| 2000 | 16,309 | 544 | (3.3) | 2.8 | 420 | (2.6) | 1.0 | 1,618 | (9.9) | 4.1 | 5,575 | (34.2) | 6.6 | 4,636 | (28.4) | 7.4 | 3,516 | (21.6) | 10.0 | 0 | (0.0) |
| 1999 | 17,494 | 602 | (3.4) | 3.2 | 436 | (2.5) | 1.1 | 1,517 | (8.7) | 4.0 | 6,062 | (34.7) | 7.3 | 4,858 | (27.8) | 8.2 | 4,017 | (23.0) | 11.6 | 2 | (0.0) |
| 1998 | 18,288 | 638 | (3.5) | 3.4 | 439 | (2.4) | 1.1 | 1,543 | (8.4) | 4.1 | 6,336 | (34.6) | 7.6 | 4,955 | (27.1) | 8.7 | 4,377 | (23.9) | 12.7 | 0 | (0.0) |
| 1997 | 19,753 | 734 | (3.7) | 3.8 | 517 | (2.6) | 1.3 | 1,675 | (8.5) | 4.6 | 6,884 | (34.9) | 8.2 | 5,279 | (26.7) | 9.5 | 4,663 | (23.6) | 13.6 | 1 | (0.0) |
| 1996 | 21,212 | 770 | (3.6) | 4.0 | 586 | (2.8) | 1.5 | 1,638 | (7.7) | 4.5 | 7,565 | (35.7) | 9.0 | 5,572 | (26.3) | 10.4 | 5,076 | (23.9) | 14.9 | 5 | (0.0) |
| 1995 | 22,727 | 894 | (3.9) | 4.6 | 642 | (2.8) | 1.7 | 1,698 | (7.5) | 4.7 | 8,201 | (36.1) | 9.8 | 5,959 | (26.2) | 11.4 | 5,328 | (23.4) | 15.8 | 5 | (0.0) |
| 1994 | 24,207 | 995 | (4.1) | 5.1 | 664 | (2.7) | 1.8 | 1,832 | (7.6) | 5.1 | 9,043 | (37.4) | 10.9 | 6,127 | (25.3) | 12.0 | 5,540 | (22.9) | 16.7 | 6 | (0.0) |
| 1993 | 25,105 | 1,015 | (4.0) | 5.2 | 645 | (2.6) | 1.7 | 1,821 | (7.3) | 5.0 | 9,590 | (38.2) | 11.6 | 6,196 | (24.7) | 12.5 | 5,821 | (23.2) | 17.7 | 17 | (0.1) |
Note:
1) Previously published incidence rates for 1993–1999 have been updated using Resident Population: Monthly Postcensal Resident Population, by single year of age, sex, race, and Hispanic origin;
2) Denominators for computing 2000–2009 incidence rates were obtained from the Intercensal Estimates of the Resident Population by Single Year of Age and Sex for States and the United States: April 1, 2000 to July 1, 2010;
3) Denominators for computing incidence rates for 2010–2019 were obtained from the Annual Estimates of the Resident Population by Single Year of Age and Sex for the United States: April 1, 2010 to July 1, 2020; accessed June 22, 2021, and
4) Denominators for computing incidence rates for 2020–2022 were obtained from the Annual Estimates of the Resident Population by Single Year of Age and Sex for the United States: April 1, 2020 to July 1, 2022; accessed July 10, 2023.
Data for all years are updated through July 8, 2023.
Zero % (0.0) denotes <0.05%.
See Technical Notes.