HIV Surveillance Report — 2021 (Volume 34)

Diagnoses of HIV Infection in the United States and Dependent Areas, 2021

Data in the HIV Surveillance Report may be used to monitor progress toward U.S. national goals outlined in Healthy People 2030, the National HIV/AIDS Strategy, and the Ending the HIV Epidemic in the U.S. (EHE) initiative. Data are presented for diagnoses of HIV infection reported to CDC through December 2022.
HIV Diagnoses in the United States and Dependent Areas Over Time*
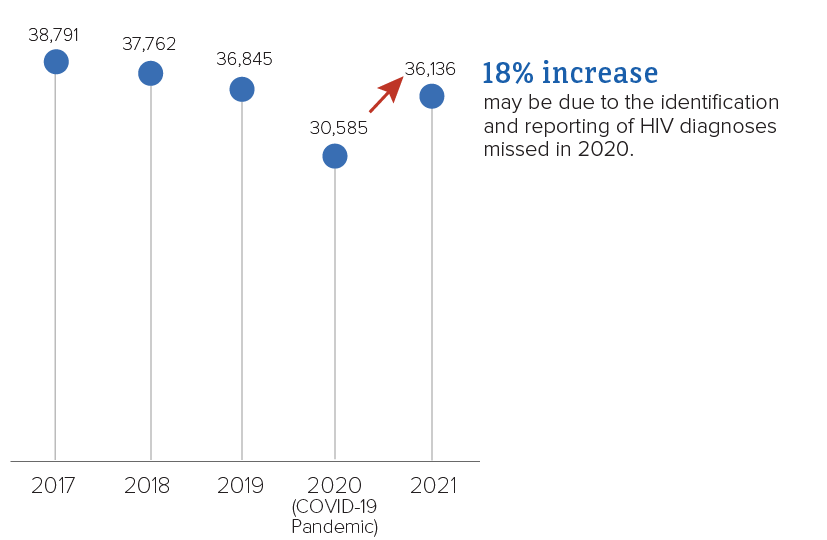
Data for 2020 should be interpreted with caution due to the impact of the COVID-19 pandemic on access to HIV testing, care-related services, and case surveillance activities in state and local jurisdictions.
*Among people aged 13 and older.
Source: CDC. Diagnoses of HIV Infection in the United States and Dependent Areas, 2021. HIV Surveillance Report 2023; 34.
Differences in New HIV Diagnoses by Gender*

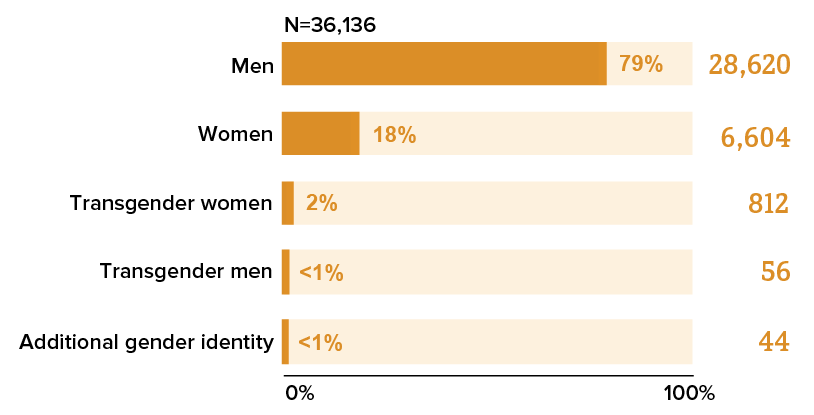
*Among people aged 13 and older.
Source: CDC. Diagnoses of HIV Infection in the United States and Dependent Areas, 2021. HIV Surveillance Report 2023; 34.
Differences in New HIV Diagnoses by Transmission Category*†

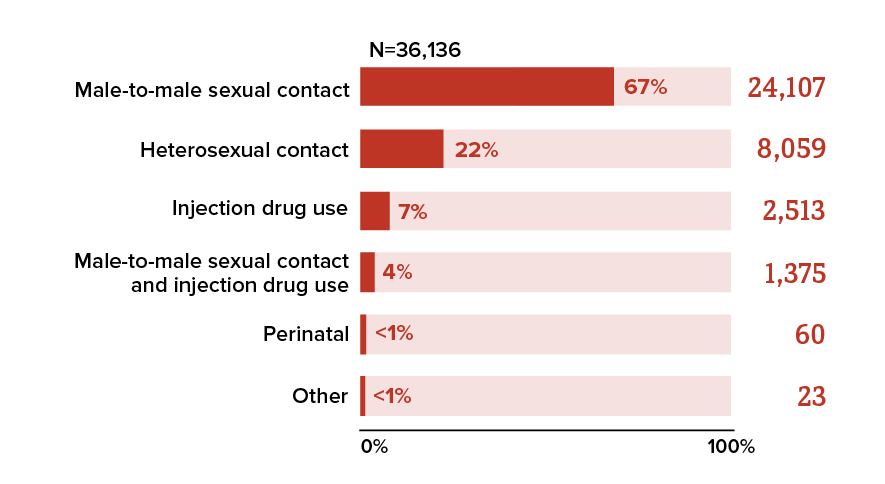
*Among people aged 13 and older.
†Transmission category is classified based on a hierarchy of risk factors most likely responsible for HIV transmission. Classification is determined based on the person’s assigned sex at birth. Data have been statistically adjusted to account for missing transmission category.
Source: CDC. Diagnoses of HIV Infection in the United States and Dependent Areas, 2021. HIV Surveillance Report 2023; 34.
Differences in New HIV Diagnoses by Race/Ethnicity*
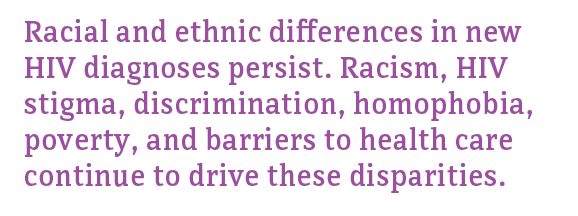
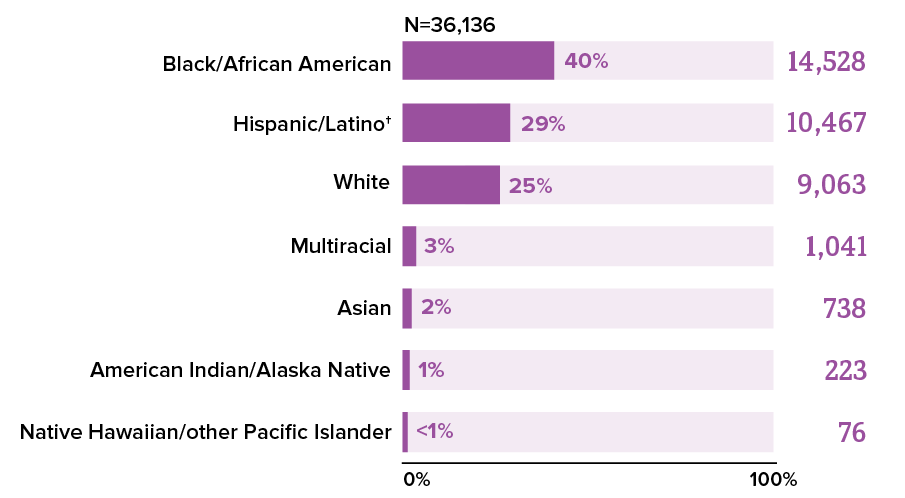
*Among people aged 13 and older.
†Hispanic/Latino people can be of any race.
Source: CDC. Diagnoses of HIV Infection in the United States and Dependent Areas, 2021. HIV Surveillance Report 2023; 34.
Differences in New HIV Diagnoses by Age

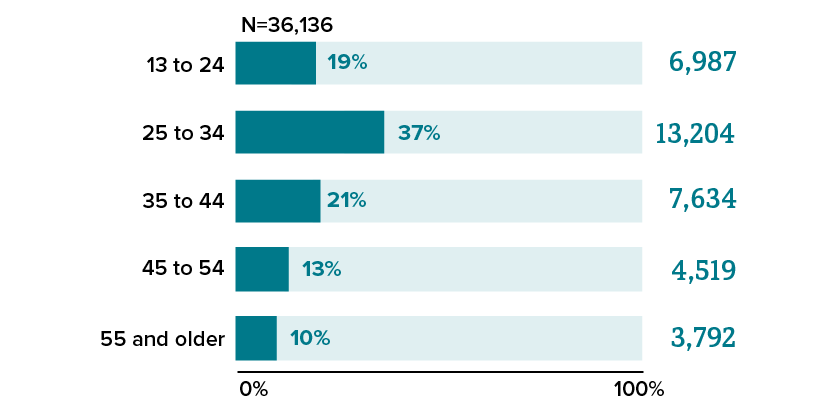
Source: CDC. Diagnoses of HIV Infection in the United States and Dependent Areas, 2021. HIV Surveillance Report 2023; 34.
Differences in New HIV Diagnoses by Region*

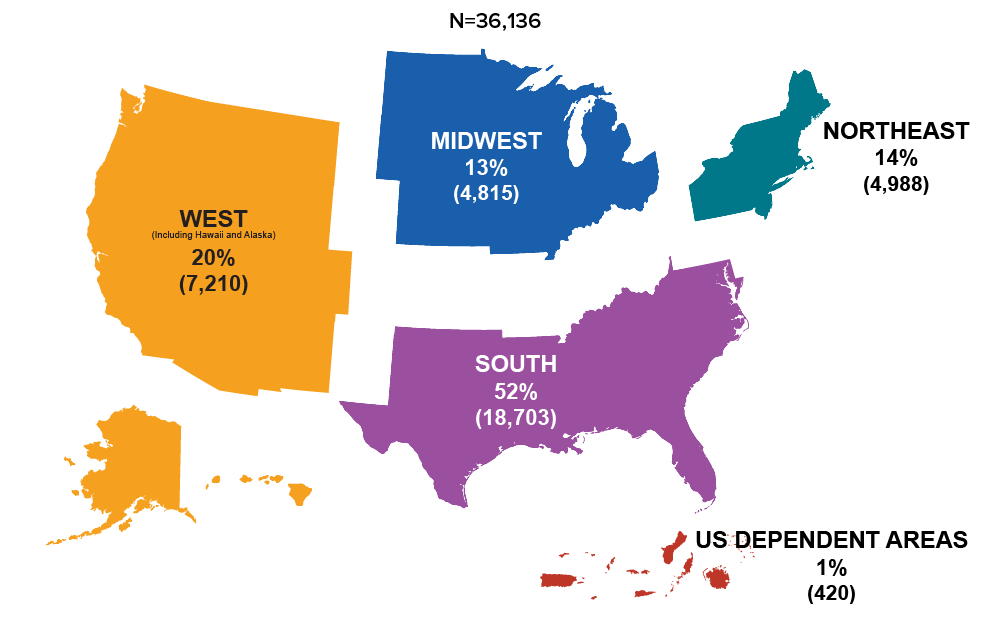
*Among people aged 13 and older.
Source: CDC. Diagnoses of HIV Infection in the United States and Dependent Areas, 2021. HIV Surveillance Report 2023; 34.
The HIV Surveillance Report is not copyrighted and may be used and reproduced without permission. Citation of the source is, however, appreciated.
Suggested Citation
Centers for Disease Control and Prevention. HIV Surveillance Report, 2021; vol. 34. http://www.cdc.gov/hiv/library/reports/hiv-surveillance.html. Published May 2023. Accessed [date].
Confidential Information, Referrals, and Educational Material on HIV
CDC-INFO
- 1-800-232-4636 (in English, en Español)
- 1-888-232-6348 (TTY)
- http://wwwn.cdc.gov/dcs/ContactUs/Form
Acknowledgments
This report was prepared by the following staff and contractors of the Division of HIV Prevention, National Center for HIV, Viral Hepatitis, STD, and TB Prevention, CDC: André Dailey, Juliet Morales, Anna D. Baker, Zanetta Gant, Jianmin Li, Emily Zhu, Anna Satcher Johnson, Shacara Johnson Lyons, Sonia Singh, Michael Friend (editing and desktop publishing), and Azfar Siddiqi (science review).
We also thank the following staff for their contributions to the report: Prevention Communication Branch (Content and Infrastructure Team) and the Division of Communication Services, Mikaelyn Benson, Deirdre Launt, Meredith Newlove, Cesar Rivera (Design Team).
Publication of this report would not have been possible without the contributions of the state and territorial health departments and the HIV surveillance programs that provided surveillance data to CDC.