Diagnoses of HIV Infection in the United States and Dependent Areas, 2018: Children Aged < 13 Years

The Special Focus Profiles highlight trends and distribution of HIV in 5 populations of particular interest to HIV prevention programs in state and local health departments: (1) Transgender Persons, (2) Gay, Bisexual, and Other Men Who Have Sex With Men, (3) Persons Who Inject Drugs, (4) Women, and (5) Children Aged <13 Years.
In order to make informed decisions about antiretroviral therapy to reduce perinatal transmission of HIV to their infants, pregnant women should know their HIV infection status. In 1995, the first recommendations for HIV counseling and voluntary testing for pregnant women were published. In 2006, CDC released revised recommendations for HIV testing which specified that opt-out HIV screening should be included in the routine panel of prenatal screening tests for all pregnant women.
Figure 25. Diagnoses of Perinatally Acquired HIV Infection among Children Born During 2017, by Area of Residence—United States and Puerto Rico
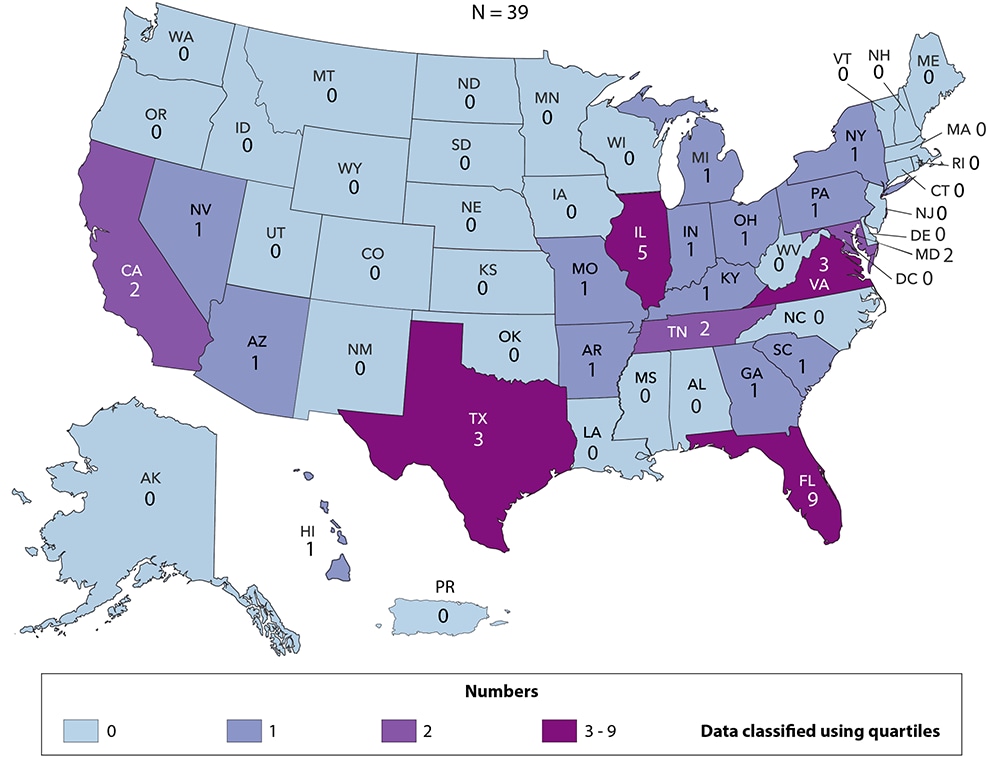
In the United States and Puerto Rico, a total of 39 children born during 2017 had HIV infection attributed to perinatal transmission (Figure 25). Florida and Illinois reported the largest numbers of HIV infections attributed to perinatal transmission in infants born in 2017. Thirty-two areas reported no perinatally acquired infections among infants born in 2017. Because of delays in the reporting of births and diagnoses of HIV infection attributed to perinatal exposure, the exclusion of data for the most recent 2 years allowed at least 24 months for data to be reported to CDC. Data reflect all infants with perinatally acquired HIV infection diagnoses who were born in the United States and 6 dependent areas during 2017, regardless of year of diagnosis.
Figure 26. Diagnoses of HIV Infection among Children Aged <13 Years, by Age at Diagnosis, 2014–2018—United States and 6 Dependent Areas
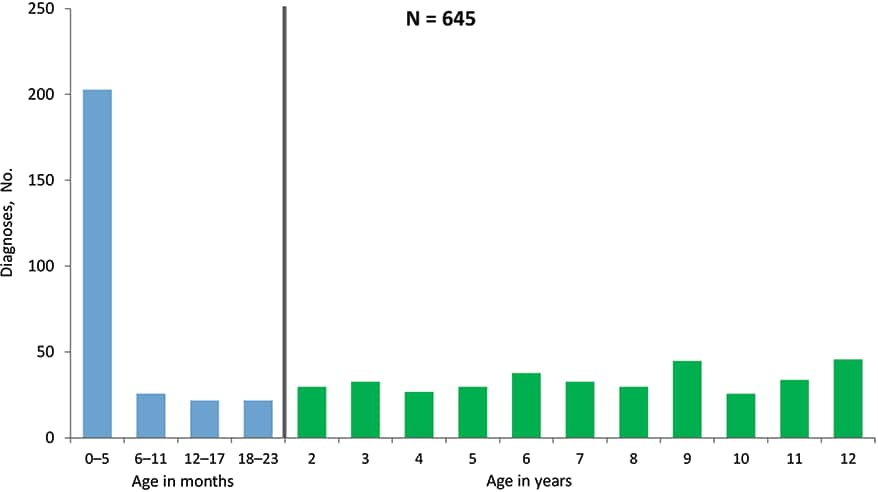
From 2014 through 2018 in the United States and 6 dependent areas, a total of 645 children (aged less than 13 years) received a diagnosis of HIV infection (Figure 26). Approximately 31% of children (aged less than 13 years) had their HIV infection diagnosed within the first 6 months of life (i.e., 0–5 months), and an additional 4% during months 6–11. Please use caution when interpreting trend data for children aged less than 13 years with diagnosed HIV infection: the numbers are small.
Figure 27. Time of Maternal HIV Testing among Children with Diagnosed Perinatally Acquired HIV Infection and Children Exposed to HIV, Birth Years 2014–2017—United States and Puerto Rico
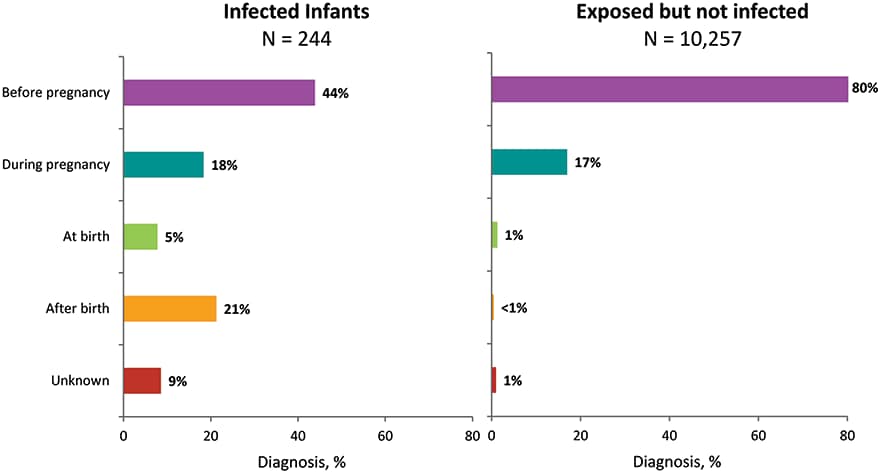
From 2014 through 2017 in the United States and Puerto Rico, among the 244 children born with diagnosed, perinatally acquired HIV infection, 44% were born to mothers who were tested before pregnancy, 18% were born to mothers who were tested during pregnancy, and 5% to mothers tested at the time of birth (Figure 27). An additional 21% of children with diagnosed, perinatally acquired HIV infection were born to mothers who were tested after the child’s birth, and 9% were born to mothers whose time of maternal HIV testing was unknown.
From 2014 through 2017 in the United States and Puerto Rico, among the 10,257 children born who were exposed but not perinatally infected with HIV, the majority (80%) of children were born to mothers who were tested before pregnancy, while 17% were born to mothers who were tested during pregnancy, 1% to mothers tested at the time of birth, less than 1% to mothers tested after birth, and 1% were born to mothers whose time of maternal HIV testing was unknown. The number of areas contributing exposure data varied by year. Because not all jurisdictions have exposure reporting in place, the number presented likely underestimates the number of exposed infants in the United States and Puerto Rico. Because of delays in the reporting of births and diagnoses of HIV infection attributed to perinatal exposure, the exclusion of data for the most recent 2 years allowed at least 24 months for data to be reported to CDC.
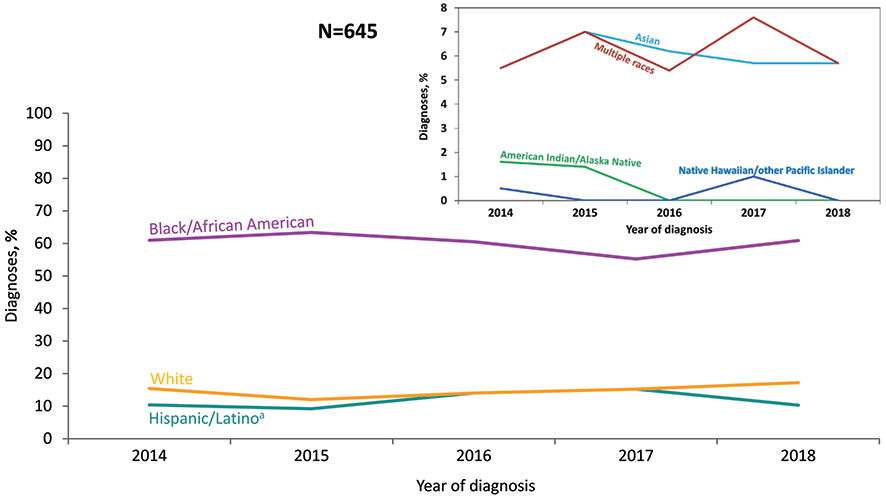
Figure 28. Percentages of Diagnoses of HIV Infection among Children Aged <13 Years, by Race/Ethnicity, 2014—2018—United States and 6 Dependent Areas
Note: See Data Tables, Definitions, and Acronyms for more information on race/ethnicity.
a Hispanics/Latinos can be of any race.
From 2014 through 2018 in the United States and 6 dependent areas, among children aged less than 13 years, the percentage of diagnosed HIV infection in black/African American children ranged from 55% to 63% (Figure 28). From 2014 through 2018, percentages of HIV diagnoses remained stable among whites. Please use caution when interpreting trend data for American Indian/Alaska Native, Asian, Hispanic/Latino, Native Hawaiian/other Pacific Islander, and children of multiple races aged less than 13 years with diagnosed HIV infection: the numbers are small.
Figure 29. Percentages of Diagnoses of HIV Infection and Population in Children Aged <13 Years, by Race/Ethnicity, 2018—United States
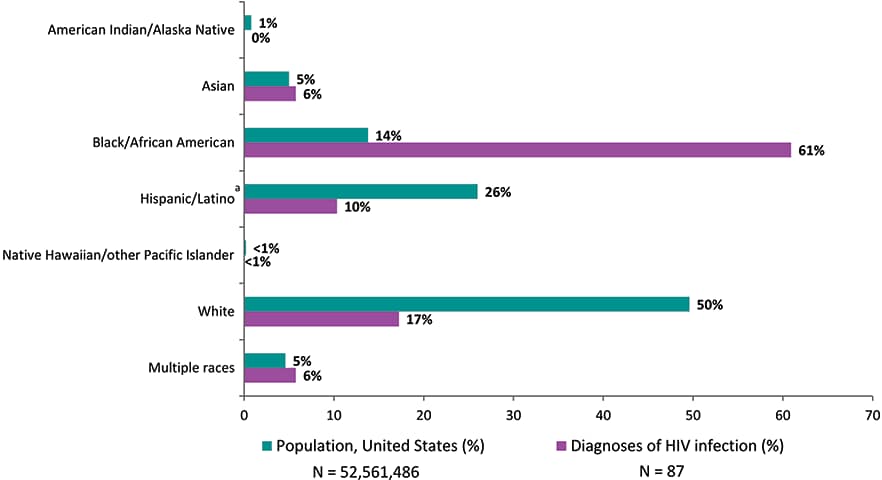
Note: See Data Tables, Definitions, and Acronyms for more information on race/ethnicity.
aHispanics/Latinos can be of any race.
In 2018 in the United States, blacks/African Americans made up approximately 14% of the population of children aged less than 13 years but accounted for 61% of diagnoses of HIV infection among children aged less than 13 years (Figure 29). Hispanics/Latinos made up 26% of the population of children aged less than 13 years in the United States but accounted for 10% of diagnoses of HIV infection. Whites made up 50% of the population of children aged less than 13 years but accounted for 17% of diagnoses of HIV infection in children aged less than 13 years.
Figure 30. Rates of Children Aged <13 Years Living with Diagnosed HIV Infection, Year-end 2018—United States and 6 Dependent Areas
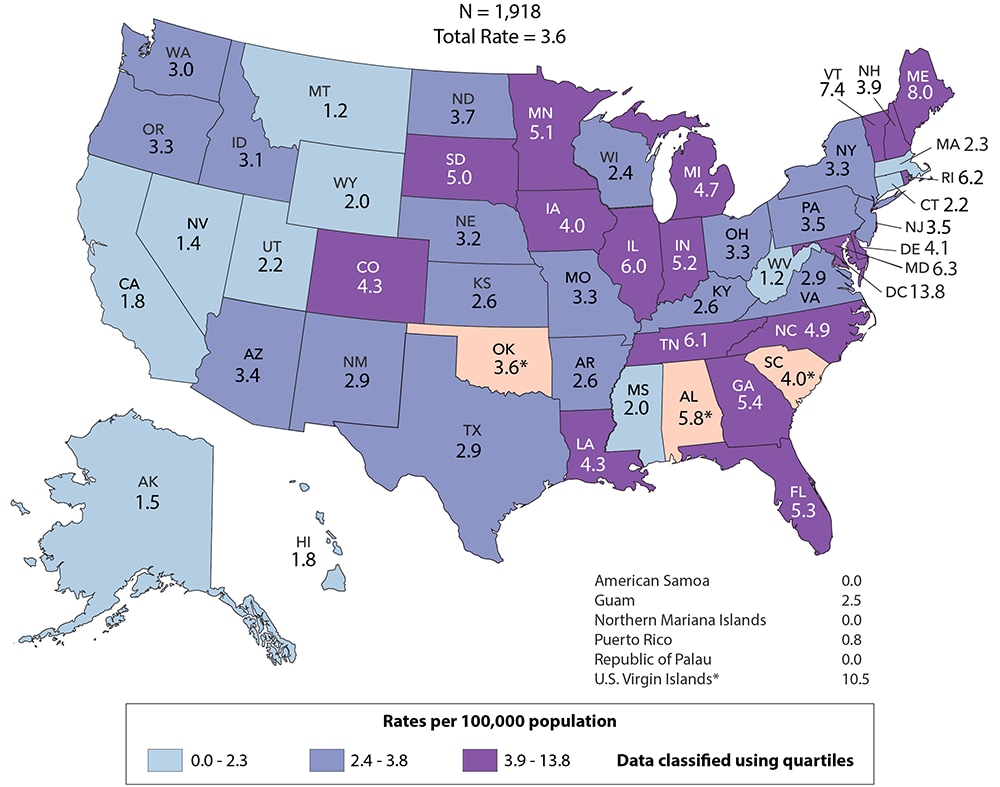
Note: Data for the year 2018 are preliminary and based on deaths reported to CDC as of December 2019. Data are based on address of residence as of December 31, 2018 (i.e., most recent known address). Asterisk (*) indicates incomplete reporting. See Data Tables, Definitions, and Acronyms for more information on prevalence.
At the end of 2018 in the United States and 6 dependent areas, approximately 1,918 children aged less than 13 years were living with diagnosed HIV infection (Figure 30). Areas with the highest rates of children aged less than 13 years living with diagnosed HIV infection at the end of 2018 were the District of Columbia (13.8), the U.S. Virgin Islands (10.5), Maine (8.0), Vermont (7.4), Maryland (6.3), Rhode Island (6.2). Data for the year 2018 are preliminary and based on deaths reported to CDC as of December 2019.
Figure 31. Persons Living with Diagnosed Perinatally Acquired HIV Infection, Year-end 2018—United States and 6 Dependent Areas
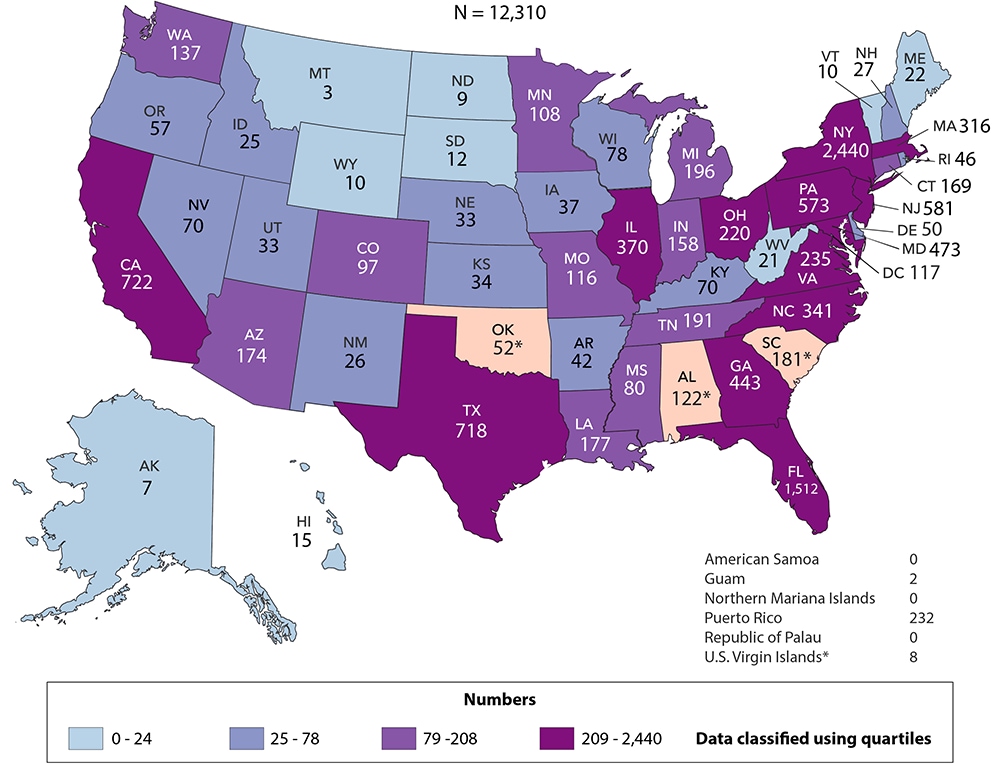
Note: Data for the year 2018 are preliminary and based on deaths reported to CDC as of December 2019. Data are based on address of residence as of December 31, 2018 (i.e., most recent known address). Asterisk (*) indicates incomplete reporting. See Data Tables, Definitions, and Acronyms for more information on prevalence.
At the end of 2018 in the United States and 6 dependent areas, there were 12,310 persons living with diagnosed perinatally acquired HIV infection (Figure 31). The number of persons living with diagnosed, perinatally acquired HIV infections ranged from 0 in American Samoa, the Northern Mariana Islands, and the Republic of Palau to 2,440 in New York. Data reflect all persons (i.e., children, adolescents, and adults) with diagnosed perinatally acquired HIV infection who were alive at year-end 2018, regardless of their age at year-end 2018. Data for the year 2018 are preliminary and based on deaths reported to CDC through December 2019.
In the Federal Register [6] for October 30, 1997, the Office of Management and Budget (OMB) announced the Revisions to the Standards for the Classification of Federal Data on Race and Ethnicity. Implementation by January 1, 2003 was mandated. At a minimum, data on the following race categories should be collected:
- American Indian or Alaska Native
- Asian
- black or African American
- Native Hawaiian or other Pacific Islander
- white
Additionally, systems must be able to retain information when multiple race categories are reported. In addition to data on race, data on 2 categories of ethnicity should be collected:
- Hispanic or Latino
- not Hispanic or Latino
The Asian or Pacific Islander category displayed in annual surveillance reports published prior to the 2007 surveillance report was split into 2 categories: (1) Asian and (2) Native Hawaiian or other Pacific Islander. The Asian category (in tables where footnoted) includes the cases in Asians/Pacific Islanders (referred to as legacy cases) that were reported before the implementation of the new race categories in 2003 (e.g., cases of HIV infection that were diagnosed and reported to CDC before 2003 but that were classified as stage 3 [AIDS] after 2003) and a small percentage of cases that were reported after 2003 but that were reported according to the old race category (Asian/ Pacific Islander). In tables of diagnoses of HIV infection during 2014–2018, the Asian category does not include Asian/Pacific Islander cases because these cases were diagnosed after 2003 and were reported to CDC in accordance with OMB’s Revisions to the Standards for the Classification of Federal Data on Race and Ethnicity [6].
This report also presents data for persons for whom multiple race categories are reported. In this report, persons categorized by race were not Hispanic or Latino. The number of persons reported in each race category may, however, include persons whose ethnicity was not reported.
Prevalence trends and data reflect persons living with diagnosed HIV infection, regardless of stage of disease, (Figures 9, 10, 30, and 31; Tables 14a/b–17a/b, 19, 20, and A2) at the end of a given year during 2014–2018. Because of delays in the reporting of deaths, prevalence data are based on a 12-month reporting delay to allow data to be reported to CDC. For tables presenting prevalence data, region or area of residence is based on most recent known address as of the end of the specified year. Data for the year 2018 are preliminary and based on death data received by CDC through December 2019. Trends through 2018 should be interpreted with caution. Due to incomplete reporting of deaths for the year 2018, prevalence data for Alabama, Oklahoma, South Carolina, and the U.S. Virgin Islands should be interpreted with caution.
AGI: additional gender identity
AIDS: acquired immunodeficiency syndrome
CDC: Centers for Disease Control and Prevention
FTM: female-to-male
HIV: human immunodeficiency virus
IDU: injection drug use
MSA: metropolitan statistical area
MSM: gay, bisexual, and other men who have sex with men
MTF: male-to-female
NHSS: National HIV Surveillance System
NIR: no identified risk factor
OI: opportunistic illness
OMB: Office of Management and Budget
PrEP: preexposure prophylaxis
PWID: persons who inject drugs