Monitoring Selected National HIV Prevention and Care Objectives By Using HIV Surveillance Data United States and 6 Dependent Areas, 2020: Special Focus Profiles

The Special Focus Profiles highlight the distribution of the diagnosis-based HIV care outcomes and identify potential gaps in these outcomes among 6 populations of interest to HIV prevention programs in state and local health departments: (1) Gay, Bisexual, and Other Men Who Have Sex With Men (MSM); (2) Persons Who Inject Drugs (PWID); (3) Transgender and Additional Gender Identity Persons; (4) Women (based on sex assigned at birth); (5) Persons with Perinatally Acquired HIV Infection; and (6) Young Persons aged 13–24 years.
Gay, Bisexual, and Other Men Who Have Sex with Men
Gay, bisexual, and other men who have sex with men (MSM) have been disproportionately affected by HIV in the United States. Longstanding inequities in access to and delivery of needed care and prevention services among MSM have persisted despite focused efforts to prevent HIV. Root causes that include systemic racism, stigma, homophobia, discrimination, poverty, housing insecurity, and unequal access to care and treatment must be addressed to reduce these inequities and other disparities that impact MSM.
Of the 30,403 reported HIV diagnoses in the United States in 2020, MSM accounted for 67.7% (20,572 males with infection attributed to MMSC, excluding MMSC/IDU) [5].
Stage of disease at time of diagnosis of HIV infection among MSM: 32.9% of infections diagnosed at an earlier stage (stage 0 or 1) and 20.0% classified as stage 3 (AIDS) at the time of diagnosis (Table 1a). All racial/ethnic MSM (except for Black/African American MSM) had ≥ 20% of infections classified as stage 3 (AIDS) at the time of diagnosis (Table 1d).
- Percentage of MSM with HIV diagnosed at an earlier stage (0 or 1) compared to the percentage with a late-stage diagnosis by race/ethnicity were as follows (Table 1d):
- American Indian/Alaska Native persons: 34.7% vs 23.4%
- Asian persons: 28.9% vs 24.6%
- Black/African American persons: 31.0% vs 17.1%
- Hispanic/Latino persons: 33.7% vs 20.9%
- Native Hawaiian/other Pacific Islander persons: 17.1% vs 21.0% exclamation circle light icon
- White persons: 35.6% vs 22.7%
- multiracial persons: 33.7% vs 20.5%
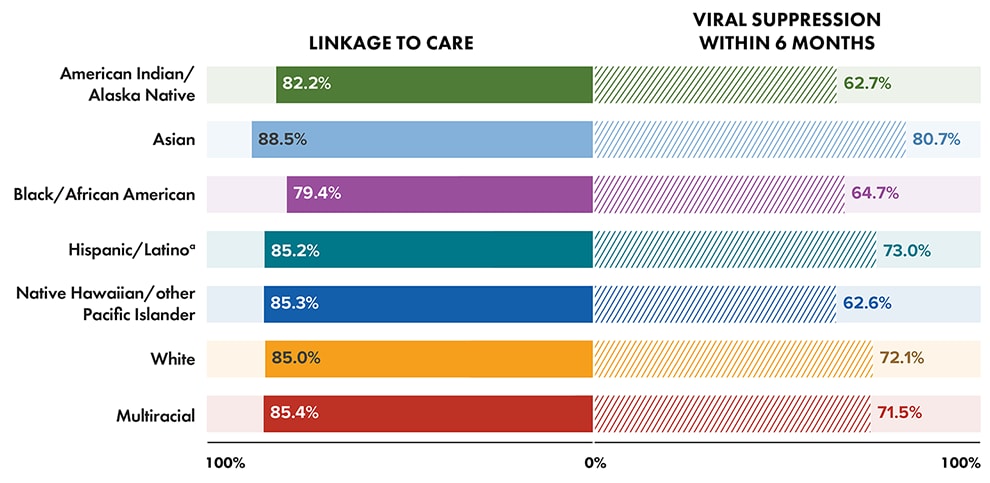
Linkage to HIV medical care within 1 month of diagnosis and viral suppression within 6 months of diagnosis among MSM: Of 19,414 males with infection attributed to MMSC, 82.9% were linked to HIV medical care within 1 month of diagnosis and 69.6% had viral suppression within 6 months of diagnosis (Table 2a):
- Highest percentages of linkage to HIV medical care and viral suppression for MSM by race/ethnicity were as follows (Figure 14, Table 2d):
- Race/ethnicity—Asian MSM: 88.5%, 80.7% respectively
- Lowest percentages of linkage to HIV medical care and viral suppression for MSM by race/ethnicity were as follows (Figure 14, Table 2d):
- Race/ethnicity—Black/African American MSM: 79.4%; Native Hawaiian/other Pacific Islander MSM: 62.6%
- Among Black/African American MSM, MSM aged 13–34 years had the lowest percentage linked to care within 1 month of diagnosis (13–24 years: 78.6%, 25–34 years: 79.6%).
- Among Native Hawaiian/other Pacific Islander MSM, MSM aged 35–44 years had the lowest percentage who had viral suppression within 6 months of diagnosis (54.2%).
- Race/ethnicity—Black/African American MSM: 79.4%; Native Hawaiian/other Pacific Islander MSM: 62.6%
Note. Data for 2020 should be interpreted with caution due to the impact of the COVID-19 pandemic on access to HIV testing, care-related services, and case surveillance activities in state/local jurisdictions. See Guide to Acronyms and Initialisms, Data Tables, and Technical Notes for more information on definitions and data specifications.
a Hispanic/Latino persons can be of any race.
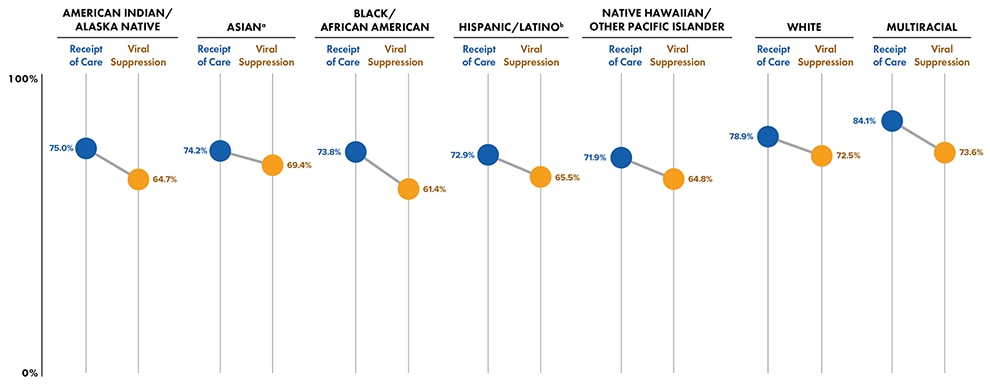
Receipt of HIV medical care and viral suppression among MSM by race/ethnicity: Of 544,758 males with infection attributed to MMSC living with diagnosed HIV at year-end 2020, 75.9% received HIV medical care and 67.2% had viral suppression at the most recent viral load test (Tables 3a and 4a):
- Highest percentages of MSM who received any HIV medical care and had viral suppression were as follows (Figure 15, Table 3d):
- Race/ethnicity—multiracial MSM: 84.1%, 73.6% respectively
- Lowest percentages of MSM who received any HIV medical care and had viral suppression at the most recent viral load test were as follows (Figure 15, Table 3d):
- Race/ethnicity—Native Hawaiian/other Pacific Islander MSM: 71.9%; Black/African American MSM: 61.4%exclamation circle light icon
- Among Native Hawaiian/other Pacific Islander MSM, MSM aged 35–44 years had the lowest percentage of receiving any HIV medical care (70.3%)
- Among Black/African American MSM, MSM aged 25–34 had the lowest percentage of viral suppression at the most recent viral load test (59.5%)exclamation circle light icon
- Race/ethnicity—Native Hawaiian/other Pacific Islander MSM: 71.9%; Black/African American MSM: 61.4%exclamation circle light icon
Note. Data for the year 2020 are preliminary and based on deaths reported to CDC as of December 2021. Data for 2020 should also be interpreted with caution due to the impact of the COVID-19 pandemic on access to HIV testing, care-related services, and case surveillance activities in state/local jurisdictions. See Guide to Acronyms and Initialisms, Data Tables, and Technical Notes for more information on definitions and data specifications.
a Includes Asian/Pacific Islander legacy cases.
b Hispanic/Latino persons can be of any race.
Persons Who Inject Drugs
Persons who inject drugs (PWID) can get HIV if they use and share needles, syringes, or other drug injection equipment (e.g., cookers) that someone with HIV has used. PWID account for about 1 in 15 HIV diagnoses in the United States. In recent years, the opioid (including prescription and synthetic opioids) and heroin crisis has led to increased numbers of PWID. Injection drug use (IDU) in rural areas has created prevention challenges and placed new populations at risk for HIV.
In 2020, PWID accounted for 6.7% of the 30,403 reported HIV diagnoses in the United States [5].
Stage of disease at time of diagnosis of HIV infection among PWID: 32.1% of infections diagnosed at an earlier stage (stage 0 or 1) and 22.2% classified as stage 3 (AIDS) at the time of diagnosis (Table 1a).
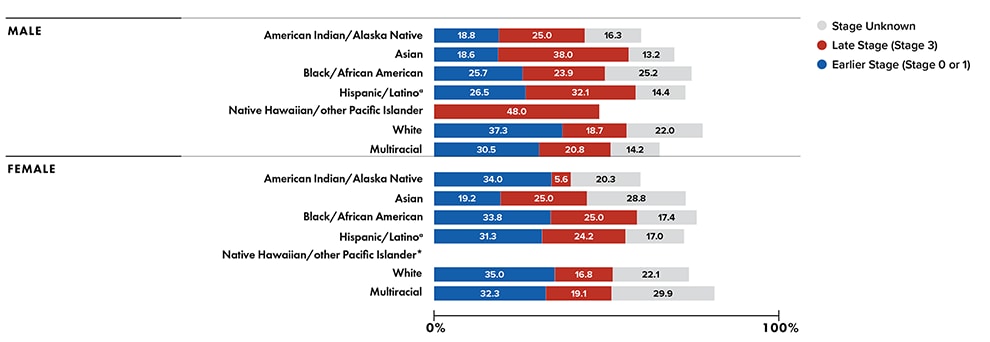
- Percentage of PWID with HIV diagnosed at an earlier stage (0 or 1) compared to the percentage with a late-stage diagnosis by sex assigned at birth and race/ethnicity, respectively, were as follows (Figure 16, Table 1c):
- Among males (based on sex at birth)
- American Indian/Alaska Native persons: 18.8% vs 25.0%exclamation circle light icon
- Asian persons: 18.6% vs 38.0%exclamation circle light icon
- Black/African American persons: 25.7% vs 23.9%
- Hispanic/Latino persons: 26.5% vs 32.1%exclamation circle light icon
- Native Hawaiian/other Pacific Islander persons: 0.0% vs 48.0%exclamation circle light icon
- White persons: 37.3% vs 18.7%
- multiracial persons: 30.5% vs 20.8%
- Among females (based on sex at birth)
- American Indian/Alaska Native persons: 34.0% vs 5.6%
- Asian persons: 19.2% vs 25.0%exclamation circle light icon
- Black/African American persons: 33.8% vs 25.0%
- Hispanic/Latino persons: 31.3% vs 24.2%
- White persons: 35.0% vs 16.8%
- multiracial persons: 32.3% vs 19.1%
Note. Data for 2020 should be interpreted with caution due to the impact of the COVID-19 pandemic on access to HIV testing, care-related services, and case surveillance activities in state/local jurisdictions. See Guide to Acronyms and Initialisms, Data Tables, and Technical Notes for more information on definitions and data specifications. Diagnosis of HIV infection may not be reported for some groups in 2020.
a Hispanic/Latino persons can be of any race.
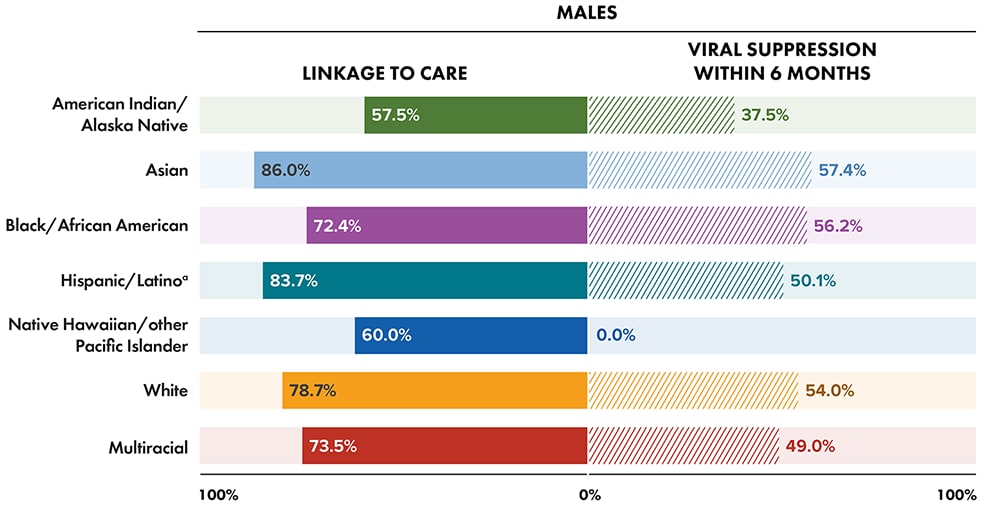
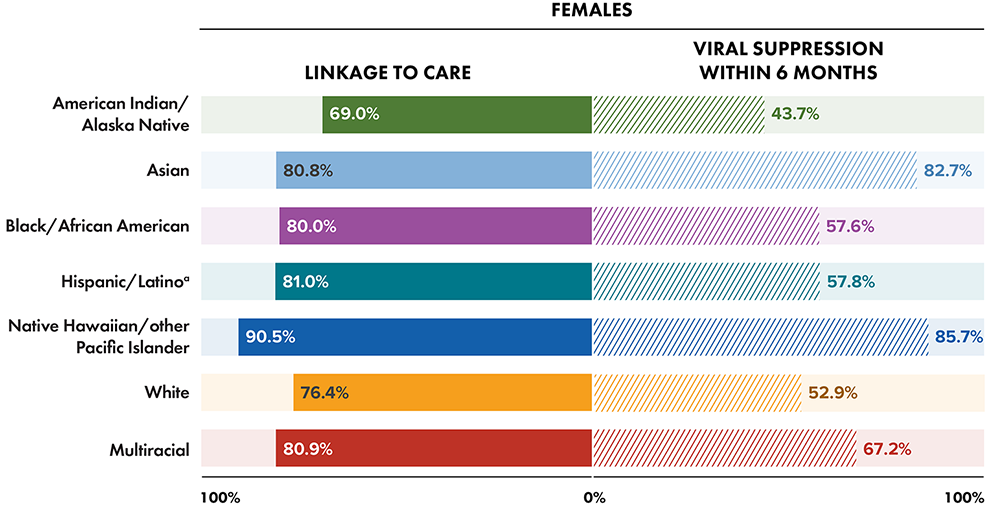
Linkage to HIV medical care within 1 month of diagnosis and viral suppression within 6 months of diagnosis among PWID: 77.9% were linked to HIV medical care within 1 month of diagnosis and 54.3% had viral suppression within 6 months of diagnosis (Table 2a):
- Highest and lowest percentages of linkage to HIV medical care for PWID by sex assigned at birth and race/ethnicity were as follows (Figures 17a/b, Table 2c):
- Asian male PWID: 86.0% and Native Hawaiian/other Pacific Islander female PWID: 90.5%
- American Indian/Alaska Native male and female PWID: 57.5%, 69.0%, respectivelyexclamation circle light icon
- Highest and lowest percentages of viral suppression for PWID by sex assigned at birth and race/ethnicity were as follows (Figures 17a/b, Table 2c):
- Asian male PWID: 57.4% exclamation circle light icon and Native Hawaiian/other Pacific Islander female PWID: 85.7%
- American Indian/Alaska Native male and female PWID: 37.5%, 43.7%, respectivelyexclamation circle light icon
Note. Data for 2020 should be interpreted with caution due to the impact of the COVID-19 pandemic on access to HIV testing, care-related services, and case surveillance activities in state/local jurisdictions. See Guide to Acronyms and Initialisms, Data Tables, and Technical Notes for more information on definitions and data specifications. Diagnosis of HIV infection may not be reported for some groups in 2020.
a Hispanic/Latino persons can be of any race.
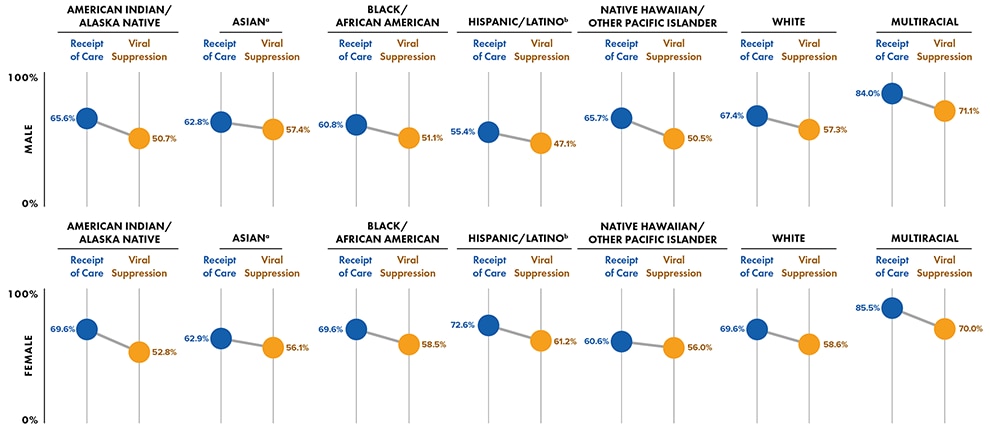
Receipt of HIV medical care and viral suppression among PWID: Of 97,081 persons with infection attributed to IDU living with diagnosed HIV at year-end 2020, 65.6% received HIV medical care and 55.3% had viral suppression at the most recent viral load test (Tables 3a and 4a):
- Highest percentages of PWID by sex assigned at birth and race/ethnicity who received any HIV medical care and had viral suppression were as follows (Figure 18, Table 3c):
- Male PWID—multiracial: 84.0%, 71.1%, respectively
- Female PWID—multiracial: 85.5%, 70.0%, respectively
- Lowest percentages of PWID by sex assigned at birth and race/ethnicity who received any HIV medical care and had viral suppression were as follows (Figure 18, Table 3c):exclamation circle light icon
- Male PWID—Hispanic/Latino: 55.4%, 47.1%, respectively
- Female PWID—Native Hawaiian/other Pacific Islander: 60.6%; American Indian/Alaska Native: 52.8%; respectively
Note. Data for the year 2020 are preliminary and based on deaths reported to CDC as of December 2021. Data for 2020 should also be interpreted with caution due to the impact of the COVID-19 pandemic on access to HIV testing, care-related services, and case surveillance activities in state/local jurisdictions. See Guide to Acronyms and Initialisms, Data Tables, and Technical Notes for more information on definitions and data specifications.
a Includes Asian/Pacific Islander legacy cases.
b Hispanic/Latino persons can be of any race.
Transgender and Additional Gender Identity Persons
Transgender is an umbrella term that is used to identify persons whose sex assigned at birth does not match their current gender identity or expression. Gender identity refers to one’s internal understanding of one’s own gender, or the gender with which a person identifies. Gender expression is a term used to describe people’s outward presentation of their gender. Gender identity and sexual orientation are different facets of identity. Everyone has a gender identity and a sexual orientation, but a person’s gender does not determine a person’s sexual orientation. Transgender persons and persons of additional gender identity (AGI) may identify as heterosexual, homosexual, bisexual, or none of the above. Transgender and AGI persons face numerous prevention challenges, including lack of public/provider knowledge about transgender issues and social rejection and exclusion, and are understudied in HIV prevention (e.g., PrEP) and treatment interventions.
In 2020, transgender and AGI persons accounted for 2.3% of 30,403 reported HIV diagnoses in the United States [5].
- Stage of disease at time of diagnosis of HIV infection among transgender and AGI persons: 41.8% of infections diagnosed at an earlier stage (stage 0 or 1) compared to 11.9% classified as stage 3 (AIDS) at the time of diagnosis, respectively, by gender and exposure category (Table 1e).
- Gender and exposure category—
- Among transgender women: 41.2% vs 12.4%
- Sexual contact: 41.5% vs 12.0%
- Sexual contact and injection drug use: 38.7% vs 9.7%
- Among transgender men: 55.3% vs 5.3%
- Sexual contact: 55.5% vs 7.4%
- Among AGI persons: 31.3% vs 12.5%
- Sexual contact: 30.8% vs 7.7%
- Among transgender women: 41.2% vs 12.4%
- Gender and exposure category—
- Linkage to HIV medical care within 1 month and viral suppression within 6 months of diagnosis among transgender and AGI persons: 81.8% were linked to HIV medical care and 65.4% had viral suppression within 6 months of diagnosis (Table 2e).
- Percentages of transgender and AGI persons who were linked to HIV medical care and had viral suppression, respectively, by gender and exposure category were as follows (Table 2e):
- Among transgender women: 80.8%, 64.3%
- Sexual contact: 81.2%, 65.2%
- Sexual contact and injection drug use: 77.4%, 61.3%exclamation circle light icon
- Among transgender men: 92.1%, 78.9%
- Sexual contact: 88.9%, 81.5%
- Among AGI persons: 93.8%, 75.0%
- Sexual contact: 92.3%, 69.2%
- Among transgender women: 80.8%, 64.3%
- Percentages of transgender and AGI persons who were linked to HIV medical care and had viral suppression, respectively, by gender and exposure category were as follows (Table 2e):
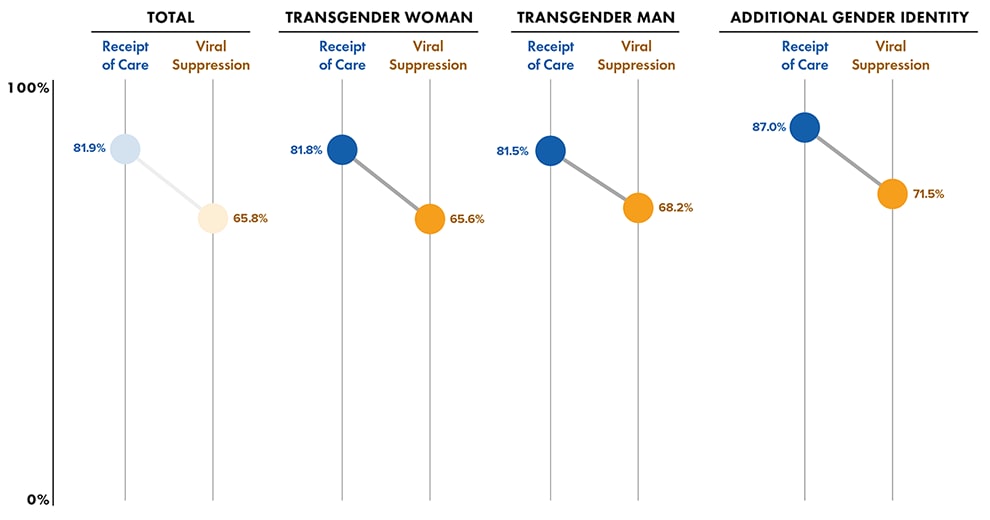
- Receipt of HIV medical care and viral suppression among transgender and AGI persons: Of 11,276 transgender and additional gender identity persons living with diagnosed HIV at year-end 2020, 81.9% received HIV medical care and 65.8% had viral suppression at their most recent viral load test (Figure 19, Tables 3e).
- Percentages of transgender and AGI persons received HIV medical care and had viral suppression, respectively, by gender and exposure category were as follows (Figure 19, Table 2e):
- Among transgender women: 81.8%, 65.6%exclamation circle light icon
- Sexual contact: 81.8%, 66.2%
- Sexual contact and injection drug use: 84.3%, 63.9%
- Among transgender men: 81.5%, 68.2%
- Sexual contact: 81.4%, 71.3%
- Among AGI persons: 87.0%, 71.5%
- Sexual contact: 87.9%, 73.1%
- Among transgender women: 81.8%, 65.6%exclamation circle light icon
- Percentages of transgender and AGI persons received HIV medical care and had viral suppression, respectively, by gender and exposure category were as follows (Figure 19, Table 2e):
Note. Data for the year 2020 are preliminary and based on deaths reported to CDC as of December 2021. Data for 2020 should also be interpreted with caution due to the impact of the COVID-19 pandemic on access to HIV testing, care-related services, and case surveillance activities in state/local jurisdictions. See Guide to Acronyms and Initialisms, Data Tables, and Technical Notes for more information on definitions and data specifications.
Women (Based on Sex Assigned at Birth)
In 2020, 5,520 women received an HIV diagnosis in the United States and 6 dependent areas [5]. Because some women may be unaware of their partner’s risk factors for HIV (such as injection drug use or having sex with men), they may not use condoms or medicines to prevent HIV. Despite prevention efforts to reduce HIV diagnoses and HIV-related disparities, longstanding health disparities in HIV infection and care outcomes persist among women, especially for women of color, due to social and structural determinants of health. These determinants include systemic racism, poverty, educational attainment, employment, housing insecurity, stigma, discrimination, disadvantaged communities, and disproportionate community levels of STIs (including HIV), and unequal access to care and treatment must be addressed to reduce racial/ethnic disparities.
In 2020, women aged ≥ 13 years accounted for 18.0% of 30,403 reported HIV diagnoses in the United States [5].
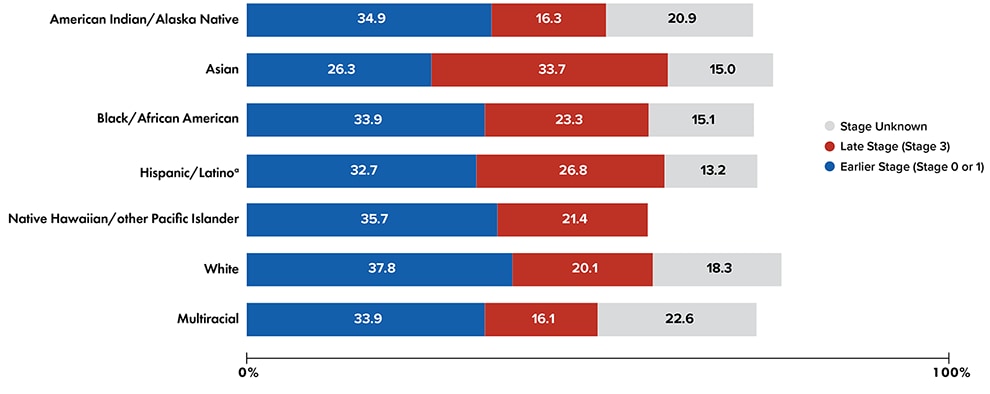
- Stage of disease at time of diagnosis of HIV infection among women: 34.7% of infections were diagnosed at an earlier stage (stage 0 or 1) and 22.9% classified as stage 3 (AIDS) at the time of diagnosis (Table 1a).
- Asian women had a higher percentage of persons that received a late-stage diagnosis compared to the percentage that received an earlier-stage diagnosisexclamation circle light icon
- Asian women: 33.7% vs 26.3%, respectively
- Women of all racial/ethnic groups (except for American Indian/Alaska Native and multiracial persons) had ≥ 20% of infections classified as late stage (stage 3, AIDS) at time of diagnosis (Figure 18, Table 1c)exclamation circle light icon
- Asian: 33.7%, Black/African American: 23.3%, Hispanic/Latino: 26.8%, Native Hawaiian/other Pacific Islander: 21.4%, and White: 20.1%
- Asian women had a higher percentage of persons that received a late-stage diagnosis compared to the percentage that received an earlier-stage diagnosisexclamation circle light icon
Note. Data for 2020 should be interpreted with caution due to the impact of the COVID-19 pandemic on access to HIV testing, care-related services, and case surveillance activities in state/local jurisdictions. See Guide to Acronyms and Initialisms, Data Tables, and Technical Notes for more information on definitions and data specifications.
a Hispanic/Latino persons can be of any race.
Linkage to HIV medical care within 1 month and viral suppression within 6 months of diagnosis among women: 82.3% were linked to HIV medical care within 1 month and 67.4% had viral suppression within 6 months of diagnosis (Table 2a).
- Highest percentages of linkage to HIV medical care and viral suppression for women by race/ethnicity were as follows (Table 2c):
- Race/ethnicity—Native Hawaiian/other Pacific Islander women: 92.9%, 85.7%, respectively
- Lowest percentages of linkage to HIV medical care and viral suppression for women by race/ethnicity were as follows (Table 2c):
- Race/ethnicity—American Indian/Alaska Native women: 74.4%, 55.8%, respectivelyexclamation circle light icon
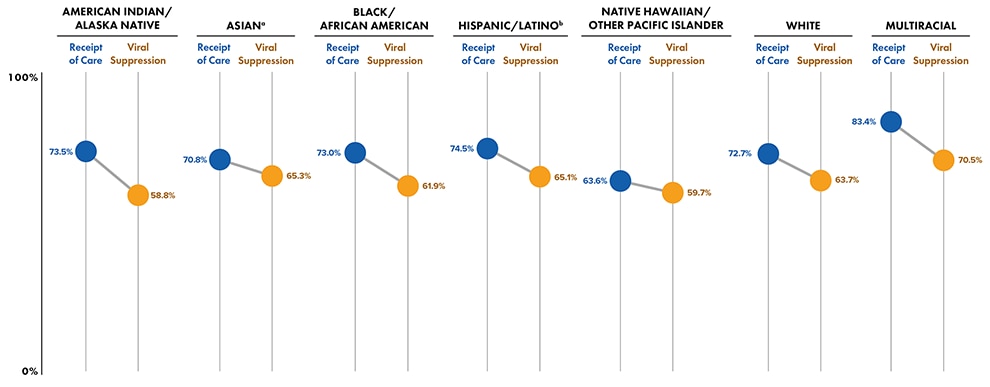
Receipt of HIV medical care and viral suppression among women: Of 215,536 women living with diagnosed HIV at year-end 2020, 73.6% received HIV medical care and 63.2% had viral suppression at the most recent viral load test (Tables 3 and 4a):
- Highest percentages of women who received any HIV medical care and had viral suppression at the most recent viral load test by race/ethnicity were as follows (Figure 21, Table 3c):
- multiracial: 83.4%, 70.5%, respectively
- Lowest percentages of women who received any HIV medical care and had viral suppression at the most recent viral load test by race/ethnicity were as follows (Figure 21, Table 3c):
- Native Hawaiian/other Pacific Islander: 63.6%; American Indian/Alaska Native: 58.6%, respectivelyexclamation circle light icon
- Among Native Hawaiian/other Pacific Islander women, women aged 45–54 years had the lowest percentage that received HIV medical care (56.7%)
- Among American Indian/Alaska Native women, women aged 25–34 years had the lowest percentage of viral suppression at the most recent viral load test (43.6%)
- Native Hawaiian/other Pacific Islander: 63.6%; American Indian/Alaska Native: 58.6%, respectivelyexclamation circle light icon
Note. Data for the year 2020 are preliminary and based on deaths reported to CDC as of December 2021. Data for 2020 should also be interpreted with caution due to the impact of the COVID-19 pandemic on access to HIV testing, care-related services, and case surveillance activities in state/local jurisdictions. See Guide to Acronyms and Initialisms, Data Tables, and Technical Notes for more information on definitions and data specifications.
a Includes Asian/Pacific Islander legacy cases.
b Hispanic/Latino persons can be of any race.
Persons with Perinatally Acquired HIV Infection
To make informed decisions about antiretroviral therapy to reduce perinatal transmission of HIV to infants, pregnant women should know their HIV infection status. In 1995, the first recommendations for HIV counseling and voluntary testing for pregnant women were published. In 2006, CDC released revised recommendations for HIV testing which specified that opt-out HIV screening should be included in the routine panel of prenatal screening tests for all pregnant women. Because of delays in the reporting to NHSS of births and diagnoses of HIV infection attributed to perinatal exposure, as well as the dynamic nature of surveillance case reporting and investigation, these numbers may be subject to change. Please use caution when interpreting perinatally acquired HIV infection numbers. Additionally, numbers less than 12, and rates based on these numbers, should be interpreted with caution.
In 2020, the overall annual rate of perinatally acquired HIV infections in the United States was 1.0 (regardless of place of birth). By race/ethnicity, the rate among Black/African American persons (4.0) was 4 and 13 times the rates among Hispanic/Latino (0.9) and White persons (0.3), respectively (Table 9a).
Among infants born in 2020, the overall annual rate of perinatally acquired HIV infections in the United States was 1.0. By race/ethnicity, the rate among Black/African American persons (3.8) was 4 and nearly 13 times the rates among Hispanic/Latino (0.9) and White persons (0.3), respectively (Figure 22, Table 9b).
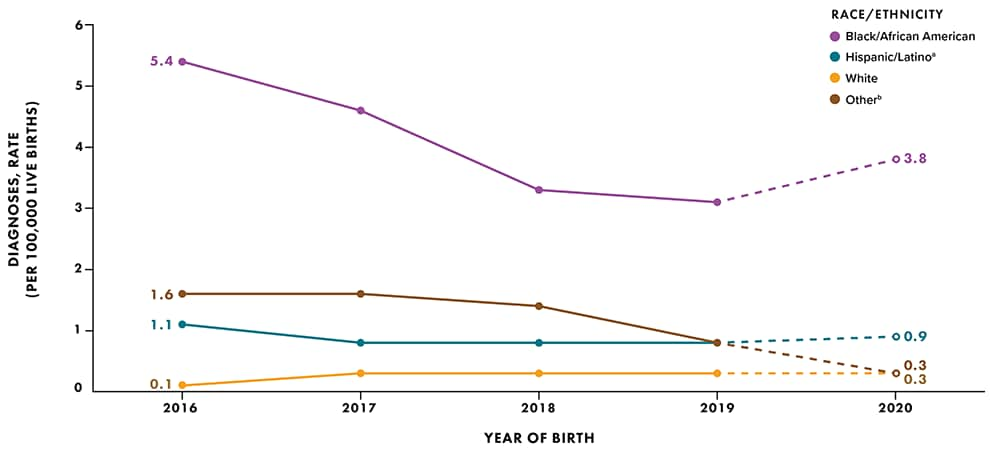
Note. Live-birth data reflect race/ethnicity of the infant’s mother. Data for 2020 should be interpreted with caution due to the impact of the COVID-19 pandemic on access to HIV testing, care-related services, and case surveillance activities in state/local jurisdictions. See Guide to Acronyms and Initialisms, Data Tables, and Technical Notes for more information on definitions and data specifications.
a Hispanic/Latino persons can be of any race.
b Includes American Indian/Alaska Native, Asian, Native Hawaiian/other Pacific Islander, and multiracial persons
Young Persons Aged 13–24 Years
Young persons (persons aged 13–24 years) accounted for 20.0% of reported 30,692 diagnoses of HIV infection in 2020 in the United States and 6 dependent areas [5]. Young persons are the least likely of any age group to be aware of their HIV infection. Lack of awareness of HIV status may be due to recent infection or low rates of HIV testing. Persons who do not know they have HIV do not get medical care or receive treatment and can unknowingly infect others. In addition, young persons have higher rates of STDs and lower rates of condom use, greatly increasing the chance of getting or transmitting HIV. Addressing HIV among this group requires that they have access to the information and tools they need to make healthy decisions, reduce their risk, get treatment, and stay in care.
Stage of disease at time of diagnosis of HIV infection among young persons aged 13–24 years: 37.8% of infections diagnosed at an earlier stage (stage 0 or 1) and 9.0% classified as stage 3 (AIDS) at the time of diagnosis (Table 1a).
Linkage to HIV medical care within 1 month and viral suppression within 6 months of diagnosis among young persons aged 13–24 years: 80.0% were linked to HIV medical care and 69.4% had viral suppression (Table 2a):
- Highest percentages of linkage to HIV medical care and viral suppression among young persons aged 13–24 years by sex assigned at birth and race/ethnicity were as follows (Table 2c):
- Asian males: 91.1%; multiracial females: 88.5%, respectively
- Asian males: 79.7%; multiracial females: 84.6%, respectively
- Lowest percentages of linkage to HIV medical care and viral suppression among young persons aged 13–24 years by sex assigned at birth and race/ethnicity were as follows (Table 2c):
- Black/African American males and females: 78.2%, 79.2%, respectively
- American Indian/Alaska Native males: 63.6%; Black/African American females: 71.8%, respectively
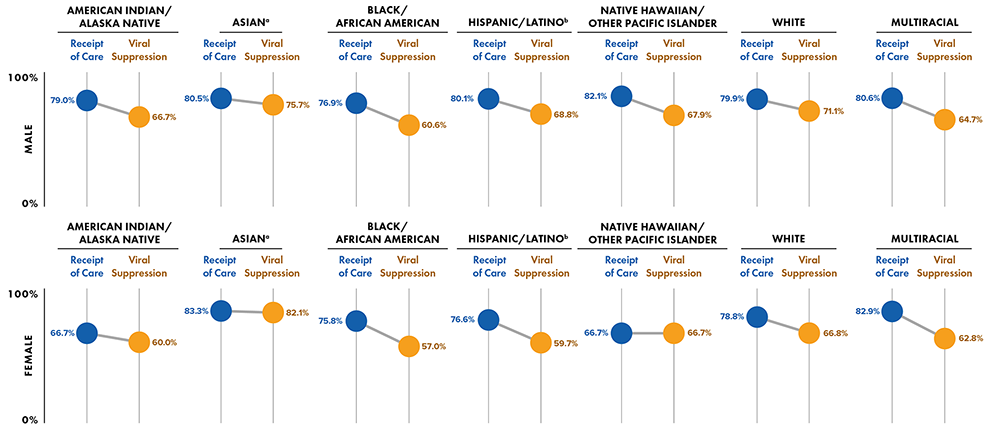
Receipt of HIV medical care and viral suppression among young persons aged 13–24 years: Of 28,697 young persons living with diagnosed HIV at year-end 2020, 78.1% received any HIV medical care and 63.5% had viral suppression at their most recent viral load test (Tables 3a and 4a):
- Highest percentages of young persons aged 13–24 years who received any HIV medical care and had viral suppression at the most recent viral load test by sex assigned at birth and race/ethnicity were as follows (Figure 23, Table 3c):
- Native Hawaiian/other Pacific Islander males: 82.1%; Asian females: 83.3%, respectively
- Asian males and females: 75.7%, 82.1%, respectively
- Lowest percentages of young persons aged 13–24 years who received any HIV medical care and had viral suppression at the most recent viral load test were as follows (Figure 23, Table 3c):exclamation circle light icon
- Black/African American males and females: 76.9%, 75.8%, respectively
- Black/African American males and females: 60.6%, 57.0%, respectively
Note. Data for the year 2020 are preliminary and based on deaths reported to CDC as of December 2021. Data for 2020 should also be interpreted with caution due to the impact of the COVID-19 pandemic on access to HIV testing, care-related services, and case surveillance activities in state/local jurisdictions. See Guide to Acronyms and Initialisms, Data Tables, and Technical Notes for more information on definitions and data specifications.
a Includes Asian/Pacific Islander legacy cases.
b Hispanic/Latino persons can be of any race.
2020 Status and Disparities in Linkage to Care, Viral Suppression, and PrEP Coverage
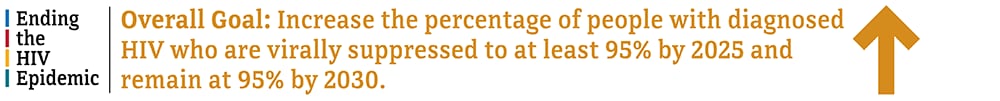
Achieving equitable health in HIV-related outcomes can reduce new HIV infections and eliminate HIV-related disparities in the United States consistent with the goals of Healthy People 2030, NHAS, and the EHE initiative. This section present the current status and HIV-related disparities for 3 favorable care outcomes: (1) the percentage of persons with newly diagnosed HIV who were linked to care within 1 month of diagnosis; (2) the percentage of persons living with diagnosed HIV who had viral suppression at the most recent test during 2020; and (3) the percentage of persons with indications for PrEP who were prescribed PrEP during 2020. See Technical Notes for additional information on disparity measures.
2020 Status and Disparities in Linkage to HIV Medical Care Within 1 Month of HIV Diagnosis
In 2020, 82.4% of persons with an HIV diagnosis were linked to HIV medical care within 1 month of diagnosis (Table 2a). For linkage to HIV medical care, the maximal percentage difference was 12.6% from the 95% target and the maximal percentage ratio was 0.867 times the 95% target. Percentages for linkage to care varied by race/ethnicity, transmission category (sex assigned at birth), region of residence, and population area of residence (Figure 24, Table 2a).
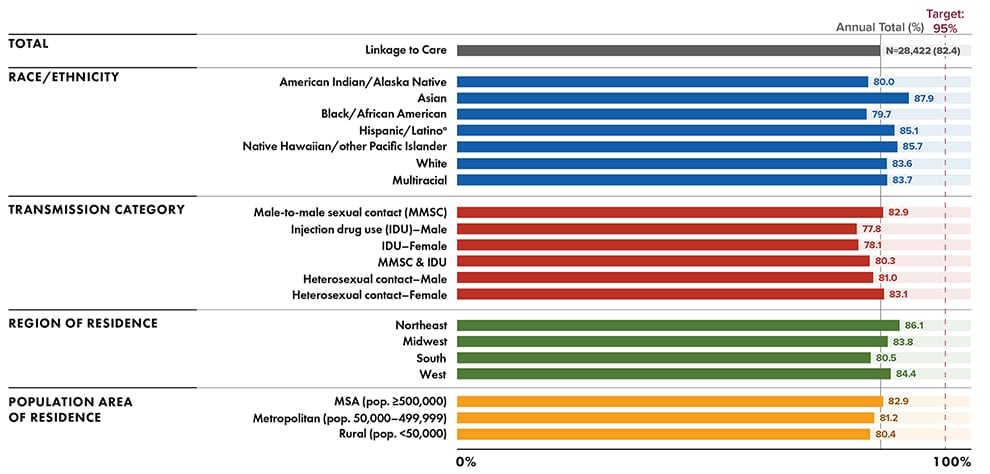
Note. Gray line indicates the overall percentage of persons linked to care within 1 month of diagnosis. Data for 2020 should be interpreted with caution due to the impact of the COVID-19 pandemic on access to HIV testing, care-related services, and case surveillance activities in state/local jurisdictions. See Guide to Acronyms and Initialisms, Data Tables, and Technical Notes for more information on definitions and data specifications.
a Hispanic/Latino persons can be of any race.
Disparities by race/ethnicity, transmission category, and geographic area were as follows:
Disparities by race/ethnicity: The highest linkage to care group percentage was for Asian persons (87.9%) and the lowest linkage to care group percentage was for Black/African American persons (79.7%) (Figure 24, Table 2a). The average percentage for all other racial/ethnic groups (excluding the percentage for Asian persons) was 83.0%.
- Absolute disparities
- Absolute (maximal) percentage difference: Asian persons were the closest to the target (7.1%) and had a group percentage higher than the overall linkage to care outcome of 82.4%.
Black/African American persons were the farthest from the target (15.3%) and had a group percentage lower than the overall linkage to care outcome.
The percentage difference between the percentage for Asian persons and Black/African American persons was 8.2%. The percentage difference between the percentage for Asian persons and the average percentage for all other racial/ethnic groups was 4.9%.
- Relative disparities
- Summary percentage ratio: The percentages for Asian and Black/African American persons were 0.925 and 0.839 times the 95% target, respectively. The average percentage for all other racial/ethnic groups was 0.874 times the percentage for Asian persons.
- Maximal percentage ratio: The percentage for Asian persons was 1.103 times the percentage for Black/African American persons.
Disparities by transmission category (sex assigned at birth): The highest linkage to care group percentage was for females with infection attributed to heterosexual contact (83.1%) and the lowest linkage to care group percentage was among males with infection attributed to IDU (77.8%) (Figure 24, Table 2a). The average percentage for all other transmission categories (excluding the percentage for females with infection attributed to heterosexual contact) was 80.0%.
- Absolute disparities
- Absolute (maximal) percentage difference: Females with infection attributed to heterosexual contact were the closest to the target (11.9%) and had a group percentage higher than the overall linkage to care outcome of 82.4%.
Males with infection attributed to IDU were the farthest from the target (17.2%) and had a group percentage lower than the overall linkage to care outcome.
The percentage difference between the percentage for females with infection attributed to heterosexual contact and for males with infection attributed to IDU was 5.3%. The percentage difference between the percentage for females with infection attributed to heterosexual contact and the average percentage for all other transmission categories was 3.1%.
- Absolute (maximal) percentage difference: Females with infection attributed to heterosexual contact were the closest to the target (11.9%) and had a group percentage higher than the overall linkage to care outcome of 82.4%.
- Relative disparities
- Summary percentage ratio: The percentages for females with infection attributed to heterosexual contact and males with infection attributed to IDU were 0.875 and 0.819 times the 95% target, respectively. The average percentage for all other transmission categories was 0.963 times the percentage for females with infection attributed to heterosexual contact.
- Maximal percentage ratio: The percentage for females with infection attributed to heterosexual contact was 1.068 times the percentage for males with infection attributed to IDU.
Disparities by region of residence: The highest linkage to care group percentage was for persons who resided in the Northeast (86.1%) and the lowest linkage to care group percentage was for persons who resided in the South (80.5%) (Figure 24, Table 2a). The average percentage for all other regions (excluding the percentage for persons who resided in the Northeast) was 82.9%.
- Absolute disparities
- Absolute (maximal) percentage difference: Persons who resided in the Northeast were the closest to the target (8.9%) and had a group percentage higher than the overall linkage to care outcome of 82.4%.
Persons who resided in the South were the farthest from the target (14.5%) and had a group percentage lower than the overall linkage to care outcome.
The percentage difference between the percentages for persons who resided in the Northeast and for persons who resided in the South was 5.6%. The percentage difference between the percentage for persons who resided in the Northeast and the average percentage for all other regions was 3.2%.
- Absolute (maximal) percentage difference: Persons who resided in the Northeast were the closest to the target (8.9%) and had a group percentage higher than the overall linkage to care outcome of 82.4%.
- Relative disparities
- Summary percentage ratio: The percentages for persons who resided in the Northeast and in the South were 0.906 and 0.847 times the 95% target, respectively. The average percentage for all other geographic areas was 0.963 times the percentage for persons who resided in the Northeast.
- Maximal percentage ratio: The percentage for persons who resided in the Northeast was 1.070 times the percentage for persons who resided in the South.
Disparities by population area of residence: Although linkage to care was similar for all geographic areas, the highest linkage to care group percentage was for persons who resided in metropolitan statistical areas (MSA, 82.9%) and the lowest linkage to care group percentage was for persons who resided in rural areas (80.4%) (Figure 24, Table 2a). The average percentage for all other geographic areas (excluding the percentage for persons who resided in MSAs) was 80.8%.
- Absolute disparities
- Absolute (maximal) percentage difference: Persons who resided in MSAs were the closest to the target (12.1%) and had a group percentage higher than the overall linkage to care outcome of 82.4%.
Persons who resided in rural areas were the farthest from the target (14.6%) and had a group percentage lower than the overall linkage to care outcome.
The percentage difference between the percentages for persons who resided in MSAs and for persons who resided in rural areas was 2.5%. The percentage difference between the percentage for persons who resided in MSAs and the average percentage for all other geographic areas was 2.1%.
- Absolute (maximal) percentage difference: Persons who resided in MSAs were the closest to the target (12.1%) and had a group percentage higher than the overall linkage to care outcome of 82.4%.
- Relative disparities
- Summary percentage ratio: The percentages for persons who resided in MSAs and in rural areas were 0.873 and 0.846 times the 95% target, respectively. The average percentage for all other geographic areas was 0.975 times the percentage for persons who resided in MSAs.
- Maximal percentage ratio: The percentage for persons who resided in MSAs was 1.031 times the percentage for persons who resided in rural areas.
2020 Status and Disparities in Viral Suppression
During 2020, 64.6% of persons living with diagnosed HIV infection at year-end had viral suppression at the most recent viral load test (Table 4a). For viral suppression, the maximal percentage difference was 30.4% from the 95% target and the maximal percentage ratio was 0.680 times the 95% target. Percentages for viral suppression varied by race/ethnicity, transmission category (sex assigned at birth), region of residence, and population area of residence (Figure 25, Table 4a).
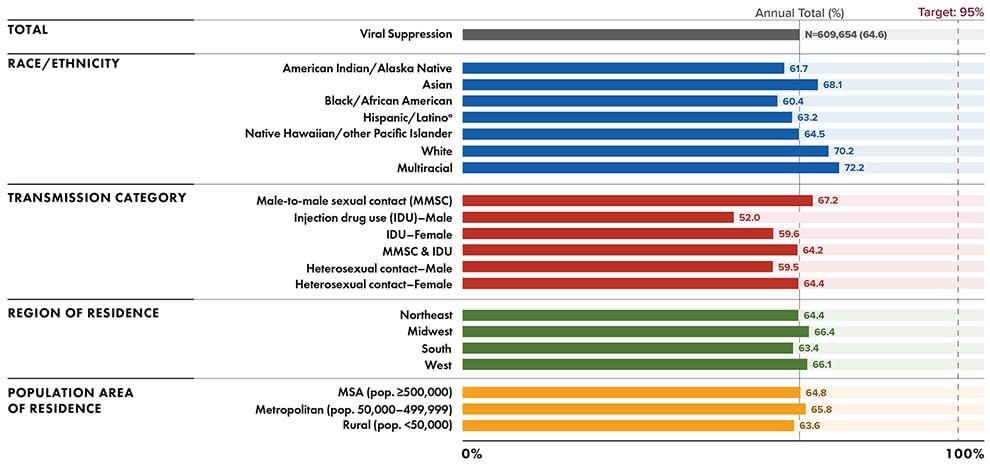
Note. Gray line indicates the overall percentage of persons had viral suppression at the most recent viral load test. Data for the year 2020 are preliminary and based on deaths reported to CDC as of December 2021. Data for 2020 should be interpreted with caution due to the impact of the COVID-19 pandemic on access to HIV testing, care-related services, and case surveillance activities in state/local jurisdictions. See Guide to Acronyms and Initialisms, Data Tables, and Technical Notes for more information on definitions and data specifications.
a Hispanic/Latino persons can be of any race.
Disparities by race/ethnicity, transmission category, and geographic area were as follows:
Disparities by race/ethnicity: The highest viral suppression group percentage was for multiracial persons (72.2%) and the lowest viral suppression group percentage was for Black/African American persons (60.4%) (Figure 25, Table 4a). The average percentage for all other racial/ethnic groups (excluding the percentage for multiracial persons) was 64.7%.
- Absolute disparities
- Absolute (maximal) percentage difference: Multiracial persons were the closest to the target (22.8%) and had a group percentage higher than the overall viral suppression outcome of 64.6%.
Black/African American persons were the farthest from the target (34.6%) and had a group percentage lower than the overall viral suppression outcome.
The percentage difference between the percentage for multiracial persons and for Black/African American persons was 11.8%. The percentage difference between the percentage for multiracial persons and the average percentage for all other racial/ethnic groups was 7.5%.
- Absolute (maximal) percentage difference: Multiracial persons were the closest to the target (22.8%) and had a group percentage higher than the overall viral suppression outcome of 64.6%.
- Relative disparities
- Summary percentage ratio: The percentages for multiracial and Black/African American persons were 0.760 and 0.636 times the 95% target, respectively. The average percentage for all other racial/ethnic groups was 0.896 times the percentage for multiracial persons.
- Maximal percentage ratio: The percentage for multiracial persons was 1.195 times the percentage for Black/African American persons.
Disparities by transmission category (sex assigned at birth): The highest viral suppression group percentage was for males with infection attributed to MMSC (67.2%) and the lowest viral suppression group percentage was for males with infection attributed to IDU (52.0%) (Figure 25, Table 4a). The average percentage for all other transmission categories (excluding the percentage for males with infection attributed to MMSC) was 59.9%.
- Absolute disparities
- Absolute (maximal) percentage difference: Males with infection attributed to MMSC were the closest to the target (27.8%) and had a group percentage higher than the overall viral suppression outcome of 64.6%.
Males with infection attributed to IDU were the farthest from the target (43.0%) and had a group percentage lower than the overall viral suppression outcome.
The percentage difference between the percentages for males with infection attributed to MMSC and for males with infection attributed to IDU was 15.2%. The percentage difference between the percentage for males with infection attributed to MMSC and the average percentage for all other transmission categories was 7.3%.
- Absolute (maximal) percentage difference: Males with infection attributed to MMSC were the closest to the target (27.8%) and had a group percentage higher than the overall viral suppression outcome of 64.6%.
- Relative disparities
- Summary percentage ratio: The percentages for males with infection attributed to MMSC and males with infection attributed to IDU were 0.707 and 0.547 times the 95% target, respectively. The average percentage for all other transmission categories was 0.892 times the percentage for males with infection attributed to MMSC.
- Maximal percentage ratio: The percentage for males with infection attributed to MMSC was 1.292 times the percentage for males with infection attributed to IDU.
Disparities by region of residence: The highest viral suppression group percentage was for persons who resided in the Midwest (66.4%) and the lowest viral suppression group percentage was for persons who resided in the South (63.4%) (Figure 25, Table 4a). The average percentage for all other regions (excluding the percentage for persons who resided in the Midwest) was 64.6%.
- Absolute disparities
- Absolute (maximal) percentage difference: Persons who resided in the Midwest were the closest to the target (28.6%) and had a group percentage higher than the overall viral suppression outcome of 64.6%.
Persons who resided in the South were the farthest from the target (31.6%) and had a group percentage lower than the overall viral suppression outcome.
The percentage difference between the percentages for persons who resided in the Midwest and for persons who resided in the South was 3.0%. The percentage difference between the percentage for persons who resided in the Midwest and the average percentage for all other regions was 1.8%.
- Absolute (maximal) percentage difference: Persons who resided in the Midwest were the closest to the target (28.6%) and had a group percentage higher than the overall viral suppression outcome of 64.6%.
- Relative disparities
- Summary percentage ratio: The percentages for persons who resided in the Midwest and in the South were 0.699 and 0.667 times the 95% target, respectively. The average percentage for all other geographic areas was 0.973 times the percentage for persons who resided in the Midwest.
- Maximal percentage ratio: The percentage for persons who resided in the Midwest was 1.047 times the percentage for persons who resided in the South.
Disparities by population area of residence: Although viral suppression was similar for all geographic areas, the highest viral suppression group percentage was for persons who resided in metropolitan areas (65.8%) and the lowest viral suppression group percentage was for persons who resided in rural areas (63.6%) (Figure 25, Table 4a). The average percentage for all other geographic areas (including the percentage for persons who resided in MSAs and rural areas and excluding the percentage who resided in metropolitan areas) was 64.2%.
- Absolute disparities
- Absolute (maximal) percentage difference: Persons who resided in metropolitan areas were the closest to the target (29.2%) and had a group percentage higher than the overall viral suppression outcome of 64.6%.
Persons who resided in rural areas were the farthest from the target (31.4%) and had a group percentage lower than the overall viral suppression outcome.
The percentage difference between the percentages for persons who resided in metropolitan and rural areas was 2.2%. The percentage difference between the percentages for persons who resided in metropolitan and in all other geographic areas was 1.6%.
- Absolute (maximal) percentage difference: Persons who resided in metropolitan areas were the closest to the target (29.2%) and had a group percentage higher than the overall viral suppression outcome of 64.6%.
- Relative disparities
- Summary percentage ratio: The percentages for persons who resided in metropolitan areas and in rural areas were 0.693 and 0.669 times the 95% target, respectively. The average percentage for all other geographic areas was 0.976 times the percentage for persons who resided in metropolitan areas.
- Maximal percentage ratio: The percentage for persons who resided in metropolitan areas was 1.035 times the percentage for persons who resided in rural areas.
2020 Status and Disparities in PrEP Coverage
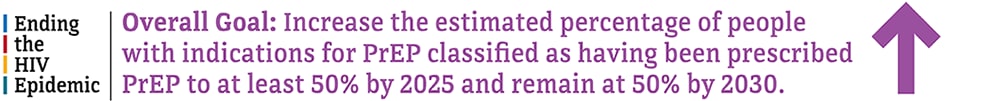
During 2020, 24.7% of an estimated 1,216,210 persons aged ≥ 16 years with indications, or eligible, for PrEP were prescribed PrEP (Table 8a). For PrEP coverage, the maximal percentage difference was 25.3% from the 50% target and the maximal percentage ratio was 0.494 times the 50% target. Percentages for PrEP coverage suppression varied by race/ethnicity and sex assigned at birth (Figure 26, Table 8a).
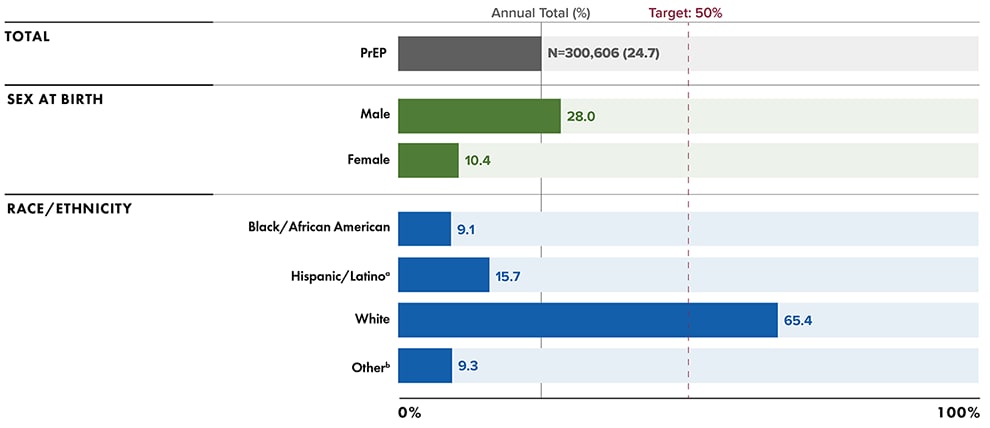
Note. Gray line indicates the overall percentage of persons with indications for PrEP prescribed PrEP. Data for 2020 should be interpreted with caution due to the impact of the COVID-19 pandemic on access to HIV testing, care-related services, and case surveillance activities in state/local jurisdictions. See Guide to Acronyms and Initialisms, Data Tables, and Technical Notes for more information on definitions and data specifications.
a Hispanic/Latino persons can be of any race.
b Includes American Indian/Alaska Native, Asian, Native Hawaiian/other Pacific Islander, and multiracial persons.
Disparities by race/ethnicity and sex assigned at birth were as follows:
Disparities by race/ethnicity: The highest PrEP coverage group percentage was for White persons (65.4%) and the lowest PrEP coverage group percentage was for Black/African American persons (9.1%) (Figure 26, Table 8a). The average percentage for all other racial/ethnic groups (excluding the percentage for White persons) was 11.4%.
- Absolute disparities
- Absolute (maximal) percentage difference: White persons had a group percentage that exceeded the overall PrEP coverage target of 50% (15.4%).
Black/African American persons were the farthest from the target (40.9%) and had a group percentage lower than the overall PrEP coverage outcome.
The percentage difference between the percentage for White and for Black/African American persons was 56.3%. The percentage difference between the percentage for White persons and the average percentage for all other racial/ethnic groups was 54.0%.
- Absolute (maximal) percentage difference: White persons had a group percentage that exceeded the overall PrEP coverage target of 50% (15.4%).
- Relative disparities
- Summary percentage ratio: The percentages for White and Black/African American persons were 1.308 and 0.182 times the 50% target, respectively. The average percentage for all other racial/ethnic groups was 0.174 times the percentage for White persons.
- Maximal percentage ratio: The percentage for White persons was 7.187 times the percentage for Black/African American persons.
Disparities by sex assigned at birth: The highest PrEP coverage group percentage was for males (28.0%) and the lowest PrEP coverage group percentage was for females (10.4%) (Figure 26, Table 8a).
- Absolute disparities
- Absolute (maximal) percentage difference: Males were the closest to the target (22.0%) and had a group percentage lower than the overall PrEP coverage outcome of 50.0%.
Females were the farthest from the target (39.6%) and had a group percentage lower than the overall PrEP coverage outcome.
The absolute percentage difference between the percentages for males and for females was 17.6%.
- Relative disparities
- Summary percentage ratio: The percentages for males and females were 0.560 and 0.208 times the 50% target, respectively.
- Maximal percentage ratio: The percentage for males was 2.692 times the percentage for females.