Key points
- Maritime industries have a higher fatality rate and risk of injury and illness than the national average for all workplaces.
- The NIOSH Center for Maritime Safety and Health Studies coordinates research to prevent injuries and illnesses among this worker population.

Overview
There are approximately 400,000 workers employed in U.S. maritime industries. These workers face a higher risk of fatality, injury, and illness than other American workers. In fact, commercial fishing is widely regarded as one of the most dangerous jobs in the United States. Likewise, the water transportation industry has a fatality rate 4.7 times higher than the rate for all U.S. workers.
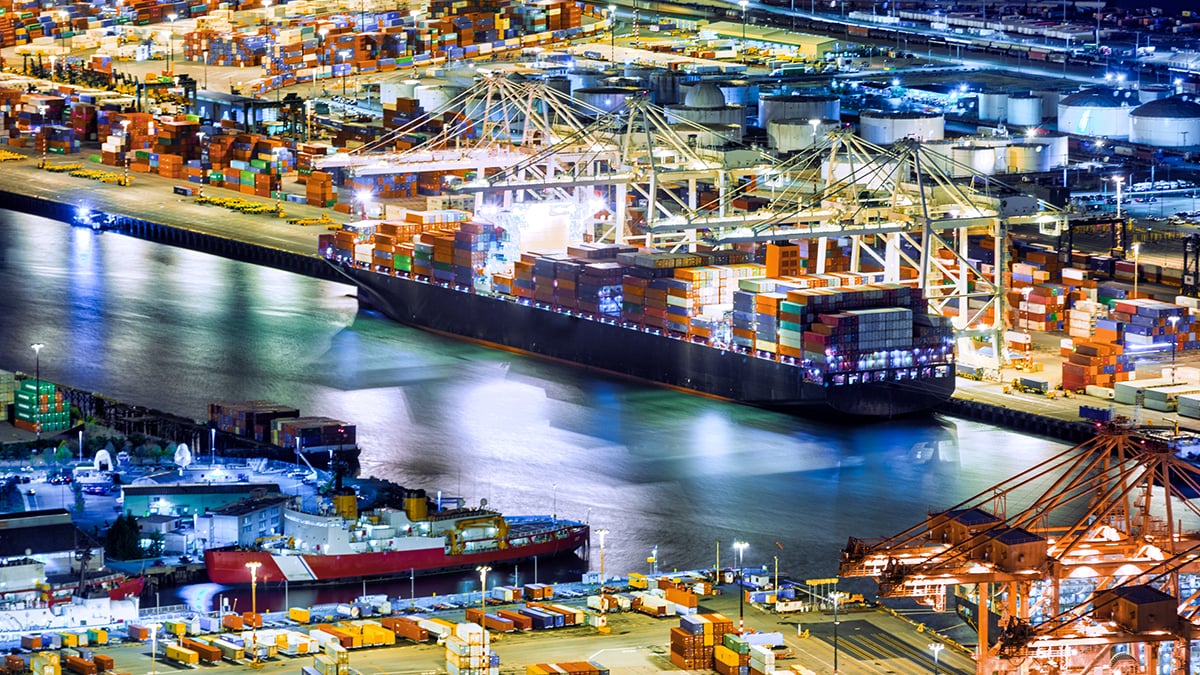
Hazards presented by the maritime environment can be encountered both on the water and at waterfront facilities, such as shipyards and marine terminals. There are some hazards that are unique to a specific maritime industry.
What's being done
The NIOSH Center for Maritime Safety and Health Studies addresses the unique occupational safety and health hazards within the maritime industries. It currently prioritizes seven maritime industries/occupations:
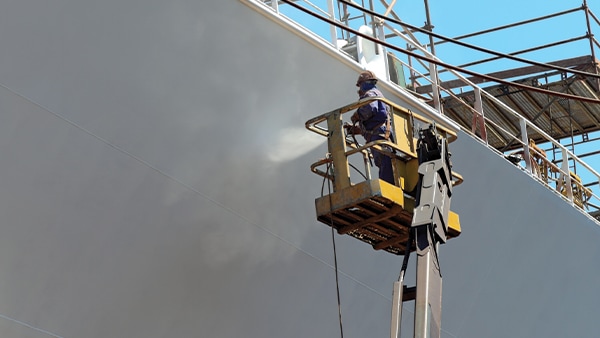
- shipyards
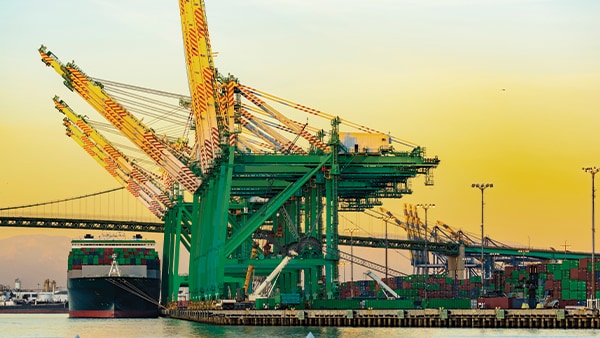
- marine terminals and port operations
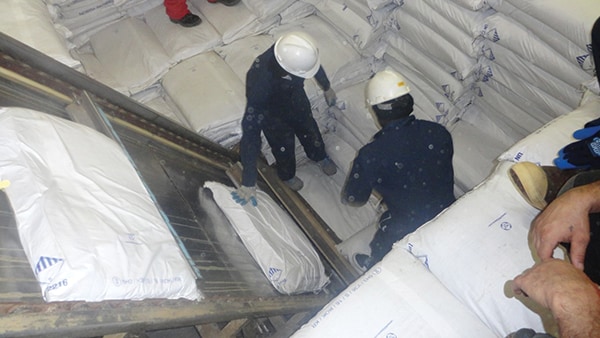
- marine transportation
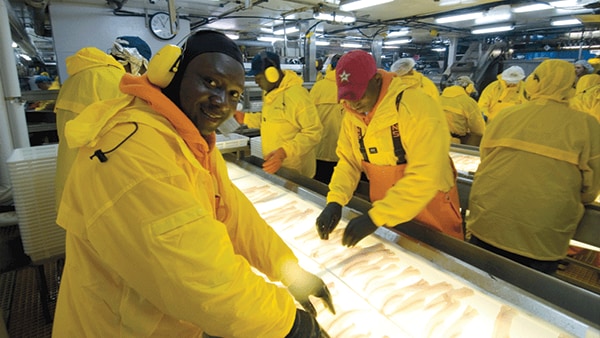
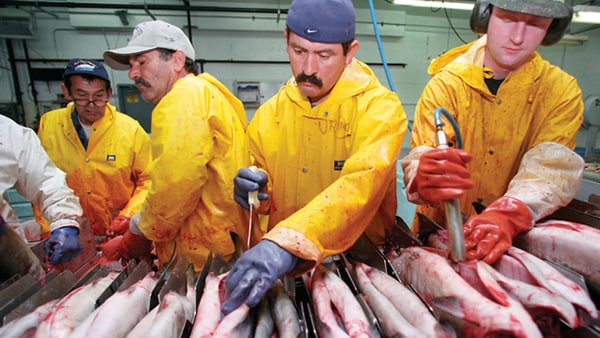
- seafood processing
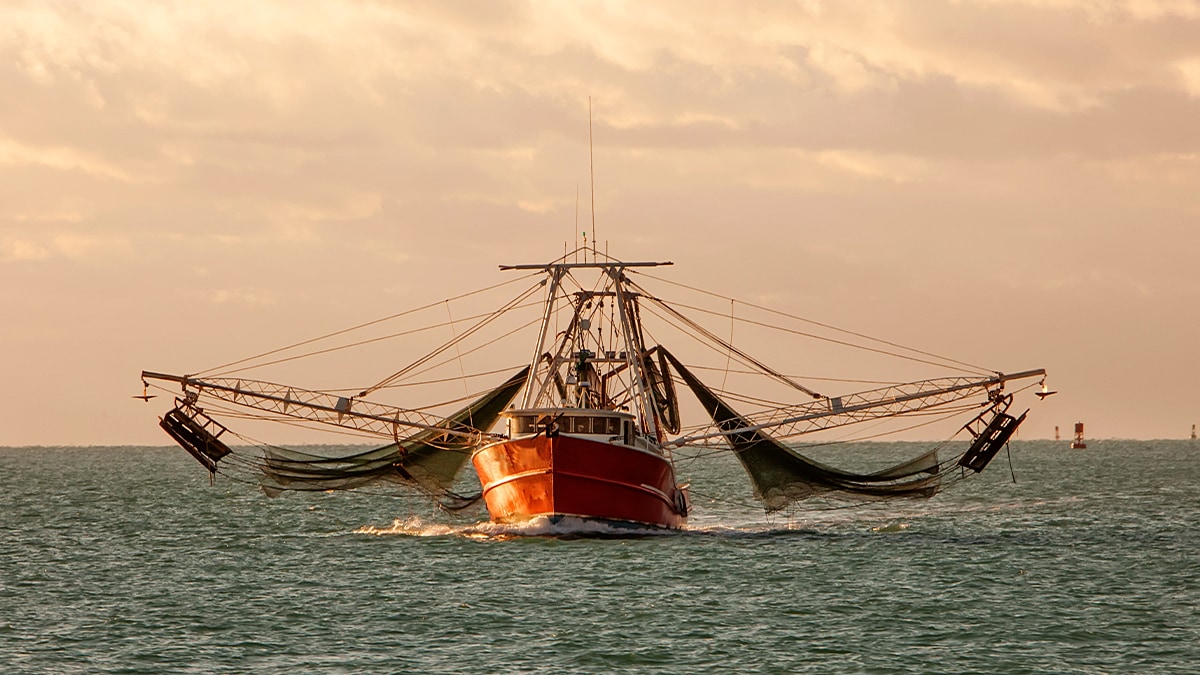
- commercial fishing
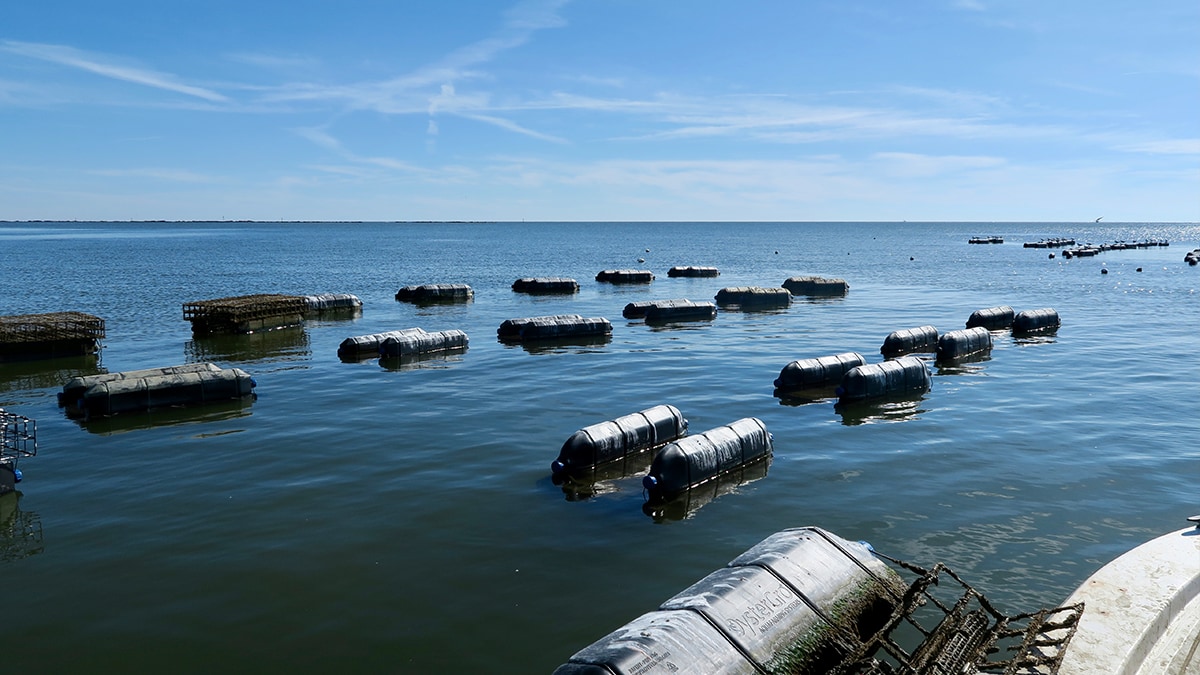
- aquaculture
- commercial diving
These industries and occupations have injury, illness and fatality rates higher than others in the U.S. They also pose unique challenges for occupational safety and health outreach, as many are made up of small businesses with few or seasonal employees or are in remote locations. In some settings, maritime employees live and work aboard vessels.
| NAICS or SOC2 | U.S. Employment3: | U.S. Fatality rate per 100,000 workers4: | U.S. Nonfatal injury/illness rate per 100,000 workers5: | |
|---|---|---|---|---|
| Ship and boat building | 3366 | 164,630 | 4.0 | 5,369.8 |
| Marine terminals and port operations | 4883 | 98,267 | 15.9 | 4,916.0 |
| Water transportation | 483 | 67,532 | 18.4 | 2,326.7 |
| Seafood processing | 3117 | 36,880 | 6.3 | 6,670.2 |
| Commercial fishing | SOC 45-3011 | 33,917 | 93.0 | 441.8 |
| Aquaculture | 1125 | 6,627 | 18.9 | 5,237.4 |
| Commercial Diving | SOC 49-9092 | 3,509 | 158.9 | 1,867.4 |
- Fatal and nonfatal injury and illness rates may be inflated due to undercounting of total workers in some industries/occupations. Traditionally, maritime workers have been undercounted by the Bureau of Labor Statistics due to the remoteness of job location, part-time or temporary nature of the work, overlap with other industries/occupations, and other factors.
- NAICS is the North American Industry Classification System and SOC is the Standard Occupational Classification.
- Worker counts are based on the Bureau of Labor Statistics six-year average of workers, 2011–2017. Commercial fishing counts are from the Current Population Survey, commercial diving counts are from Occupational Employment and Wages tables, and all others are from the Quarterly Census of Employment and Wages.
- Fatality rates are based on six-year averages from the Bureau of Labor Statistics Census of Fatal Occupational Injuries, 2011–2017.
- Nonfatal injury and illness rates are based on six-year averages of Bureau of Labor Statistics Survey of Occupational Injuries and Illnesses, 2011–2017.
Learn More
Marine Terminals and Port Operations
Ergonomic Hazards in Seafood Processing
Language Barriers in Seafood Processing
Fatigue Hazards in Seafood Processing

