Review: Diabetic Retinopathy
‹View Table of Contents
The VEHSS team conducted a review of published literature on examination-based population studies reporting the prevalence of diabetic retinopathy (DR).
Diabetic retinopathy (DR) occurs when high blood sugar damages the blood vessels below the retina. There are two primary types of DR: non-proliferative diabetic retinopathy (NPDR) and proliferative diabetic retinopathy (PDR).(AOA, 2015) With NPDR, the blood vessels of the retina leak, causing the macula to swell.(AOA, 2015) There are three stages of NPDR: mild, moderate, and severe. Mild NPDR refers to the early stages where blood vessels begin to swell and leak.(NEI, 2015) In moderate cases of NPDR, blood vessels continue to swell and become unable to transport blood. NPDR is considered severe when the retina becomes oxygen deprived and signals growth factors to form new blood vessels.(NEI, 2015) In PDR, new blood vessels form, but are weak and prone to leakage. Scar tissue forms which may lead to retinal detachment and blindness).(AOA, 2015) Nerve damage can also occur with diabetic retinopathy. Diabetic macular edema (DME) is the swelling of the macula and can occur at any stage. The term vision-threatening DR (VTDR) is defined as the presence of severe NPDR, proliferative DR, or clinically significant macular edema (CSME).(Wong T.Y., 2013)
Download the full report:
Published Examination-Based Prevalence of Major Eye Disorders [PDF – 703 KB]
In 1968, a group of experts developed a grading system for DR called the Arlie House Classification of DR.(Wu L, 2013) The system grades stereo photographs and classifies DR in 13 levels: level 10 indicates no retinopathy and level 85 signifies retinal detachment or severe vitreous hemorrhage. This system was modified in the Early Treatment of Diabetic Retinopathy Study (ETDRS). The term CSME was introduced by the ETDRS and refers to a specific form of DME. It was defined as the “(1) thickening of the retina at or within 500 μm of the center of the macula; or (2) hard exudate at or within 500 μm of the center of the macula associated with thickening of adjacent retina; or (3) a zone of retinal thickening 1 disc area or larger, any part of which is within 1 disc diameter of the center of the macula.”(Wu L, 2013)
Diabetic Retinopathy Literature Review Results
There were 18 studies conducted between 1992 and 2016 that examined the prevalence of diabetic retinopathy (DR). These studies examined a variety of demographics including race/ethnicity, age, sex, income, and education level. Various stages of DR were examined including mild, moderate, and severe NPDR, DME, and vision threatening DR (VTDR)
Table 1. Diabetic Retinopathy Prevalence Sources
| Author | Date of Publication | Title | Date of Data Collection | Data Source | Sample Size | Prevalence Data Stratified by: | Stage of AMD |
|---|---|---|---|---|---|---|---|
| Varma R, Wen G, et al. | 2016 | Prevalence of Diabetic Retinopathy in Adult Chinese American Individuals: The Chinese American Eye Study | 2010-2013 | The Chinese American Eye Study | 665 | Age, Sex, Race | Any, Mild NPDR, Moderate NPDR, Severe NPDR, PDR |
| Kovarik JJ, Eller AW, et al. | 2016 | Prevalence of Undiagnosed Diabetic Retinopathy Among Inpatients with Diabetes: the Diabetic Retinopathy Inpatient Study | 2011-2012 | DRIPS | 113 | Not stratified by demographic variables | Any, Mild NPDR, Moderate NPDR, Severe NPDR, PDR |
| Rodriguez N, Aguilar, S | 2016 | Prevalence of Diabetic Retinopathy in a Clinic Population from Puerto Rico | 2001-2009 | Retrospective Chart Review | 411 | Age, Sex | Mild NPDR, Moderate NPDR, Severe NPDR, PDR |
| Park D, Mansberger SL, et al. | 2016 | Eye Disease in Patients with Diabetes Screened with Telemedicine | 2006–2009 | Telemedicine Screening Program | 424 | Not stratified by demographic variables | Any, Mild NPDR, Moderate NPDR, Severe NPDR, PDR |
| Zhang X, Cotch MF, et al. | 2012 | Vision Health Disparities in the United States by Race/Ethnicity, Education, and Economic Status: Findings from Two Nationally Representative Surveys | 2005–2008; 1988–1994 | NHANES 2005-2008, NAHNES III | 5,704; 8,208 | Race/Ethnicity | Any |
| Maa AY, Evans C, et al. | 2013 | Veteran Eye Disease after Eligibility Reform: Prevalence and Characteristics | January 2008–February 2008 | Atlanta VA Medical Center Chart Review | 658 | Not stratified by demographic variables | NPDR, PDR |
| Zhang X, Saadine J, et al. | 2010 | Prevalence of Diabetic Retinopathy in the United States, 2005-2008 | 2005–2008 | 2005-2008 NHANES | 1,006 | Age, Sex, Race/Ethnicity | Any, VTDR |
| Lim A, Stewart J, Chui TY, et al. | 2008 | Prevalence and Risk Factors of Diabetic Retinopathy in a Multi-Racial Underserved Population | 2004–2006 | SFGH Eye Van | 1,073 | Race/Ethnicity | Any, Mild, Moderate, Severe |
| Wong TY, Klein R, Islam FM, et al. | 2006 | Diabetic Retinopathy in a Multi-Ethnic Cohort in the United States | 2000–2002 | MESA | 778 | Race/Ethnicity | Any, Minimal, Early-moderate, Severe-proliferate, VTDR |
| Mansberger SL, Romero FC, et al. | 2005 | Causes of Visual Impairment and Common Eye Problems in Northwest American Indians And Alaska Natives | Unknown | Northwest AIAN | 288 | Race | NPDR, PDR |
| Varma R, Torres M, Pena F, et al. | 2004 | Prevalence of Diabetic Retinopathy in Adult Latinos: The Los Angeles Latino Eye Study | 2000–2008 | LALES | 1,217 | Age, Sex, Race/Ethnicity | Any, Mild NPDR, Moderate NPDR, Severe NPDR, PDR |
| Kempen JH, O’Colmain BJ, Leske MC, et al. | 2004 | The Prevalence of Diabetic Retinopathy Among Adults in the United States | 1985–1998 | EDPRG | N/A | Age, Race/Ethnicity, Sex | Any, VTDR |
| Roy MS, Klein R, O’Colmain BJ, et al. | 2004 | The Prevalence of Diabetic Retinopathy Among Adult Type 1 Diabetic Persons in the United States | 1980–1982, 1993–1998 | WESDR, New Jersey 725 | 594, 790 | Sex, Age, Race | Any, VTDR |
| Lee PP, Feldman ZW, Ostermann J, et al. | 2003 | Longitudinal Prevalence of Major Eye Diseases | 1999 | National Long-Term Care Survey | Various | Not stratified by demographic variables | Any DR, PDR |
| West SK, Klein R, et al. | 2001 | Diabetes and Diabetic Retinopathy in a Mexican-American Population | 1997–1999 | Proyecto VER | 1,044 | Not stratified by demographic variables | Any, Moderate NPDR Severe NPDR, PDR |
| Harris MI, Klein R, Cowie CC, et al. | 1998 | Is the risk of Diabetic Retinopathy Greater in Non-Hispanic Blacks and Mexican Americans than in Non-Hispanic Whites with Type 2 Diabetes? A U.S. Population Study. | 1988–1994 | NHANES III | Various | Race/Ethnicty | Any, Mild NPDR, Moderate NPDR, PDR |
| Haronian E, Wheeler NC, et al. | 1993 | Prevalence of Eye Disorders Among the Elderly in Los Angeles | 1982–1990 | UCLA MEC | 431 | Age, Sex | Any |
| Klein R, Klein B | 1992 | Epidemiology of Proliferative Diabetic Retinopathy | 1980–1982 | WESDR | 2,366 | Age, Sex | PDR |
Overall Diabetic Retinopathy Prevalence Rates
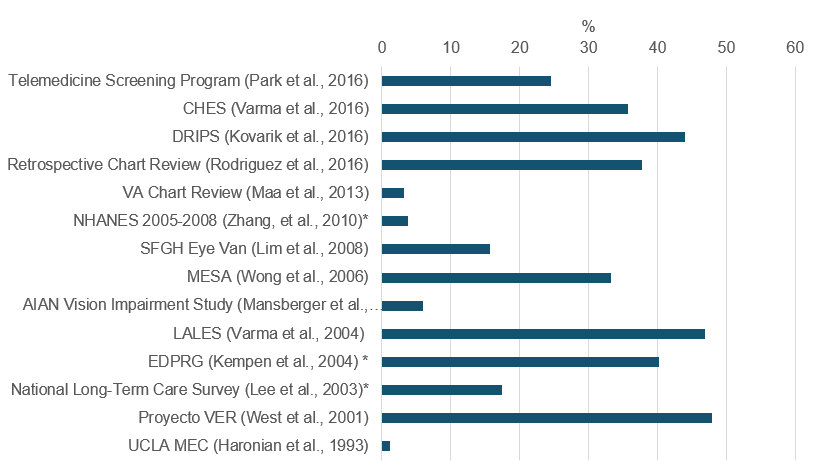
Figure 1 below shows diabetic retinopathy (DR) prevalence rates from 11 of the selected studies that reported an overall rate. The high degree of variation among the results in this figure is likely due to in part to methodological, disease definition and population differences among the studies. This figure excludes studies that did not report an overall rate for the study. The figure is intended to illustrate the range of published prevalence values; direct comparison of the studies is impossible without considering the underlying differences in the studies. Detailed results from each individual study are available in the full report “Published Examination-based Prevalence of Major Eye Disorders.”
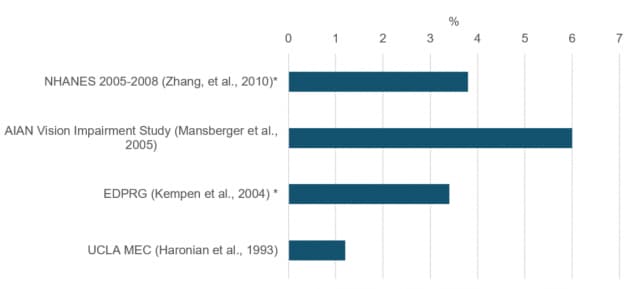
Most studies determined the prevalence of DR from a study sample of diabetic individuals (Figure 1), while some reported the prevalence rates among a general population including individuals with and without diabetes (Figure 2). The studies described throughout this section compared DR prevalence rates across race/ethnicity, age, education level, and income. Variation among these studies could be a result of the different distributions of sociodemographic characteristics among the study samples as well as differences in the prevalence of diabetes. Further, three of the studies reported estimates that were adjusted to a national standard.
Figure 1. Overall Prevalence Rates of Diabetic Retinopathy Among Populations with Diabetes.

*Age- or population- adjusted prevalence rate
Figure 2. Overall Prevalence Rates of Diabetic Retinopathy (not restricted to persons with diabetes).

*Age- or population- adjusted prevalence rate