Using an Epi Curve to Determine Most Likely Period of Exposure
This Quick Learn lesson will take approximately 10 minutes to complete.
When you are finished, you will be able to interpret an epidemic curve or “epi curve”, and determine the likely period of exposure that led to the outbreak.
You can move through this lesson by using the NEXT and BACK icons below.
What an Epi Curve Can Tell You
An epi curve is a visual display of the onset of illness among cases associated with an outbreak.
You can learn a lot about an outbreak from an epi curve, such as
- The outbreak's time trend, which is the distribution of cases over time
- Outliers, that is, cases that stand apart from the overall pattern
- General sense of the illness magnitude
- Inferences about the outbreak's mode of spread
- The most likely period of exposure
In a point source outbreak of a known disease, you also can use the epi curve to identify the most likely time period of exposure that led to the outbreak. Knowing the period of exposure allows you to focus your search for the source of the outbreak.
Point Source Outbreak
Persons are exposed to the same source over a brief time, such as through a single meal or at an event. The number of cases rises rapidly to a peak and falls gradually. Most cases occur within one incubation period.
Incubation Period
To determine the most likely period of exposure for an outbreak, you need to know the average incubation period for the disease and the range of incubation periods, which are the minimum and maximum reported incubation periods.
The incubation period is the time from exposure to the causative agent until the first symptoms develop and is characteristic for each disease agent.
Example: Shiga toxin-producing E. coli has an average incubation period of 3-4 days with a range from a minimum of 2 days to a maximum of 10 days.
Determining the Period of Exposure
The following steps will allow you to determine the most likely period of exposure for a point source outbreak based on the epi curve.
- Identify the peak of the outbreak, which is the time period then the largest number of cases occurred.
- Count back from the peak, the average incubation period for disease. Note that date.
- Identify the earliest case in the outbreak and count back the minimum incubation period. Note that date.
- Identify the last case in the outbreak and count back the maximum incubation period. Note that date.
The range of dates identified in Step 2-4 represent the most likely period of exposure and ideally should fall within a few days of each other. If the three dates are widely separated, this indicates that the incubation period has a wide range or the outbreak is not a point source outbreak.
Point Source Outbreak
Persons are exposed to the same source over a brief time, such as through a single meal or at an event. The number of cases rises rapidly to a peak and falls gradually. Most cases occur within one incubation period.
Determining the Period of Exposure
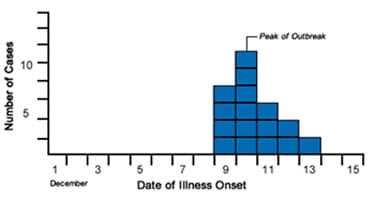
Let's look at an example and walk through the steps to determine the most likely period of exposure. Below is the epi curve from an outbreak of Shiga toxin-producing E. coli (STEC). The outbreak appears to be due to a point source.
Cases of Shiga Toxin-producing E. coli by Date of Onset, Port Yourtown, December 2011.

Step 1: Identify the Peak
Identify the peak of the outbreak. In the outbreak below, the peak occurs on December 10, which is the date with the highest number of cases.
Shiga Toxin-producing E. coli Cases by Date of Onset, Port Yourtown, December 2011
Step 2: Count Back the Average Incubation Period
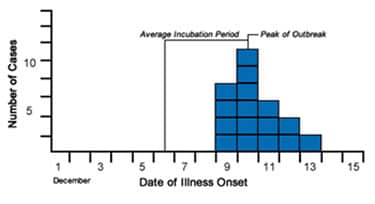
The average incubation period for Shiga toxin-producing E. coli (STEC) is 4 days. Now, count back 4 days from the peak. That date is December 6.
Shiga Toxin-producing E. coli Cases by Date of Onset, Port Yourtown, December 2011
Step 3: Count Back the Minimum Incubation Period
Identify the earliest case in the outbreak and count back the minimum incubation period, which is two days. That date is December 7.
Shiga Toxin-producing E. coli Cases by Date of Onset, Port Yourtown, December 2011

Step 4: Count Back the Maximum Incubation Period
Identify the last case and count back the maximum incubation period. In this case, the last case is December 13, and the incubation period is 10 days. You should count back to December 3.
Shiga Toxin-producing E. coli Cases by Date of Onset, Port Yourtown, December 2011

Result: Most Likely Period of Exposure
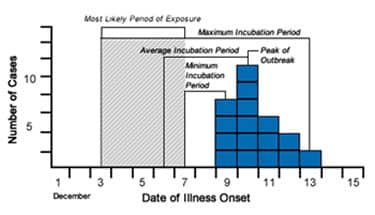
After analyzing the epi curve, we determined the first case occurred on December 9, the peak of the outbreak on December 10, and the last case occurred on December 13. With the described methods, we have determined the
- Average incubation period from peak — December 6
- Minimum incubation period from the first case — December 7
- Maximum incubation period from the last case — December 3
Using these range of dates, we have can determine the most likely period of exposure for this outbreak is December 3-7. Investigators will focus on this time period when searching for the exposure that resulted in this outbreak.
Shiga Toxin-producing E. coli Cases by Date of Onset, Port Yourtown, December 2011
Your Turn: Exercise 1
Notice in the example we just completed the interval on the x-axis 1 day. Some epi curves will use intervals of multiple days, weeks, or even months. The interval depends on the time frame that cases occurred. Always be sure to look at the interval so that you interpret the epi curve appropriately.
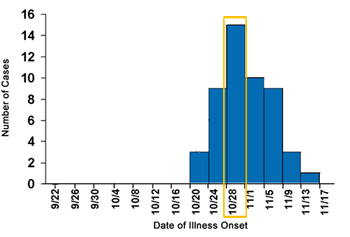
Now, it’s your turn. Walk through the steps to determine the most likely period of exposure for a point source outbreak of Hepatitis A in Alabama. The incubation range for Hepatitis A is 15-50 days and has an average incubation of 25-30 days. Use an average incubation period of 28 days. Because the cases are spread over multiple months, the x-axis is divided into 4-day intervals, starting on the day noted.
Hepatitis A Cases By Date of Onset in Colbert Country, Alabama September-November 2006

Exercise 1: Determine the Peak
What is the peak for the epi curve below? Select the correct answer.
Hepatitis A Cases by Date of Onset in Colbert Country, Alabama September-November 2006

Exercise 1: Correct
The peak, which occurred during the 4-day interval beginning 10/28, is the highest point of the epi curve.
Hepatitis A Cases by Date of Onset in Colbert Country, Alabama September-November 2006
Exercise 1: Incorrect
The peak, which occurred during the 4-day interval beginning 10/28, is the highest point of the epi curve.
Hepatitis A Cases by Date of Onset in Colbert Country, Alabama September-November 2006

Exercise 1: Incorrect
The peak, which occurred during the 4-day interval beginning 10/28, is the highest point of the epi curve.
Hepatitis A Cases by Date of Onset in Colbert Country, Alabama September-November 2006

Exercise 2: Count Back the Average Incubation Period
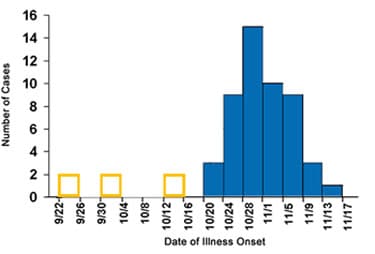
Count back the average incubation period from the peak. Select the appropriate area of the graph. The average incubation period for hepatitis A is 28 days. Select the correct answer below.
Hepatitis A Cases by Date of Onset in Colbert Country, Alabama September-November 2006
Exercise 2: Incorrect
You should have counted 28 days from the peak during 10/28. That date falls within the 4-day period beginning 9/30.
Hepatitis A Cases by Date of Onset in Colbert Country, Alabama September-November 2006

Exercise 2: Correct
You should have counted 28 days from the peak during 10/28. That date falls within the 4-day period beginning 9/30.
Hepatitis A Cases by Date of Onset in Colbert Country, Alabama September-November 2006

Exercise 2: Incorrect
You should have counted 28 days from the peak during 10/28. That date falls within the 4-day period beginning 9/30.
Hepatitis A Cases by Date of Onset in Colbert Country, Alabama September-November 2006

Exercise 3: Count Back the Minimum Incubation Period
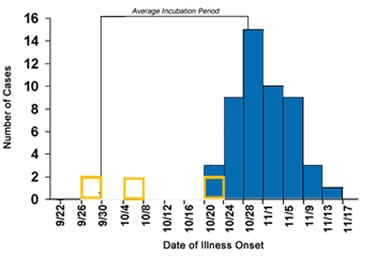
Identify the earliest case in the outbreak and count back the minimum incubation period. What is the approximate date? Select the correct answer below.
Note: The range in incubation periods for hepatitis A is 15-50 days.
Hepatitis A Cases by Date of Onset in Colbert Country, Alabama September-November 2006
Exercise 3: Incorrect
The first identified case occurred during the 4-day period beginning on 10/20. By counting back the minimum incubation period of 15 days, we can determine the minimum incubation period from the peak occurred during the 4-day period beginning 10/4.
Hepatitis A Cases by Date of Onset in Colbert Country, Alabama September-November 2006

Exercise 3: Correct
The first identified case occurred during the 4-day period beginning on 10/20. By counting back the minimum incubation period of 15 days, we can determine the minimum incubation period from the peak occurred during the 4-day period beginning 10/4.
Hepatitis A Cases by Date of Onset in Colbert Country, Alabama September-November 2006

Exercise 3: Incorrect
The first identified case occurred during the 4-day period beginning on 10/20. By counting back the minimum incubation period of 15 days, we can determine the minimum incubation period from the peak occurred during the 4-day period beginning 10/4.
Hepatitis A Cases by Date of Onset in Colbert Country, Alabama September-November 2006

Exercise 4: Count Back the Maximum Incubation Period
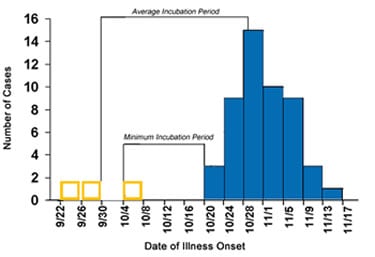
Identify the last case in the outbreak and count back the maximum incubation period. What is this date? Select the correct answer below.
Note: The range in incubation periods for hepatitis A is 15-50 days
Hepatitis A Cases by Date of Onset in Colbert Country, Alabama September-November 2006
Exercise 4: Incorrect
The last identified case was during the 4-day period beginning 11/13. By counting back the maximum incubation period of 50 days, the identified date falls within the 4-day period beginning 9/22.
Hepatitis A Cases by Date of Onset in Colbert Country, Alabama September-November 2006

Exercise 4: Incorrect
The last identified case was during the 4-day period beginning 11/13. By counting back the maximum incubation period of 50 days, the identified date falls within the 4-day period beginning 9/22.
Hepatitis A Cases by Date of Onset in Colbert Country, Alabama September-November 2006

Exercise 4: Correct
The last identified case was during the 4-day period beginning 11/13. By counting back the maximum incubation period of 50 days, the identified date falls within the 4-day period beginning 9/22.
Hepatitis A Cases by Date of Onset in Colbert Country, Alabama September-November 2006

Exercise 4: Incorrect
The last identified case was during the 4-day period beginning 11/13. By counting back the maximum incubation period of 50 days, the identified date falls within the 4-day period beginning 9/22.
Hepatitis A Cases by Date of Onset in Colbert Country, Alabama September-November 2006

Exercise 5: Determine the Most likely Period of Exposure
You have now determined the following dates and time periods:
- Peak of the outbreak occurred — 10/28
- Average incubation period from peak — 4-day period beginning 9/30
- Minimum incubation period from the first case — 4-day period beginning 10/4
- Maximum incubation period from the last case — 4-day period beginning 9/22
Based on the information above, what is the most likely period of exposure? Select the correct answer.
Hepatitis A Cases by Date of Onset in Colbert Country, Alabama September-November 2006

Exercise 5: Incorrect
The most likely period of exposure is 9/22 – 10/7.
The minimum incubation period from the first case occurred during the 4-day period beginning on 10/4 and ending on 10/7. The maximum incubation period from the last case occurred during the 4-day period beginning on 9/22.
The average incubation period from the peak occurred during the 4-day period beginning on 9/30, which falls between the minimum and maximum periods.
Hepatitis A Cases by Date of Onset in Colbert Country, Alabama September-November 2006

Exercise 5: Incorrect
The most likely period of exposure is 9/22 – 10/7.
The minimum incubation period from the first case occurred during the 4-day period beginning on 10/4 and ending on 10/7. The maximum incubation period from the last case occurred during the 4-day period beginning on 9/22.
The average incubation period from the peak occurred during the 4-day period beginning on 9/30, which falls between the minimum and maximum periods.
Hepatitis A Cases by Date of Onset in Colbert Country, Alabama September-November 2006

Exercise 5: Incorrect
The most likely period of exposure is 9/22 – 10/7.
The minimum incubation period from the first case occurred during the 4-day period beginning on 10/4 and ending on 10/7. The maximum incubation period from the last case occurred during the 4-day period beginning on 9/22.
The average incubation period from the peak occurred during the 4-day period beginning on 9/30, which falls between the minimum and maximum periods.
Hepatitis A Cases by Date of Onset in Colbert Country, Alabama September-November 2006

Exercise 5: Correct
The most likely period of exposure is 9/22 – 10/7.
The minimum incubation period from the first case occurred during the 4-day period beginning on 10/4 and ending on 10/7. The maximum incubation period from the last case occurred during the 4-day period beginning on 9/22.
The average incubation period from the peak occurred during the 4-day period beginning on 9/30, which falls between the minimum and maximum periods.
Hepatitis A Cases by Date of Onset in Colbert Country, Alabama September-November 2006

Summary
Congratulations!
You have analyzed an epi curve to determine the likely period of exposure that led to the outbreak.

To view other Quick Learn Lessons, visit CDC Learning Connection.

