At a glance

Executive Summary
- The Centers for Disease Control and Prevention (CDC) uses the National Immunization Survey-Teen (NIS-Teen) to monitor national, state, and selected local area and territorial vaccination coverage among adolescents age 13-17 years. In 2018, the NIS shifted from a dual landline and cell-phone frame to a single cell-phone frame sampling design to increase efficiency. This report uses the 2016 and 2017 NIS-Teen data to assess the impact of the change in survey design on local, state and national vaccination coverage estimates among adolescents 13-17 years old.
- Dropping the landline sampling frame did not change any of the national vaccination coverage estimates in 2016 and only changed 3 of the 15 vaccination measures examined among adolescents 13-17 years in 2017. Human papillomavirus (HPV) vaccination coverage was higher in 2017 for single-frame compared to dual-frame estimates, by 0.9 percentage points for ≥1 dose among all adolescents, 1.0 percentage points for up-to-date (UTD) among all adolescents, and 1.4 percentage points for ≥1 dose among male adolescents.
- Across 18 sociodemographic categories for the HPV vaccine (≥1 dose), single-frame estimates were significantly higher than dual-frame estimates for 11 of the comparisons among males and two of the comparisons among females in 2017. For ≥1 dose quadrivalent meningococcal conjugate vaccine (MenACWY) and ≥1 dose tetanus, diphtheria, and acellular pertussis vaccine (Tdap), there were four statistically significant comparisons for each vaccine across 18 sociodemographic categories in 2017, ranging from -1.3 to 2.3 (MenACWY) and -0.7 to 2.5 (Tdap).
- At the state level, the median difference between single-frame and dual-frame design estimates of vaccination coverage were 0.5 in 2016 and 0.3 in 2017 for ≥1 dose HPV vaccination, -0.3 in 2016 and 0.1 in 2017 for ≥1 dose MenACWY, and -0.3 in 2016 and -0.1 in 2017 for ≥1 dose Tdap.
- As the NIS transitioned from a dual- to single-frame design in 2018, it is important to consider that there may be small changes in vaccination coverage with the change in sampling design, and direct comparisons with coverage estimates from previous years should be made with caution.
Introduction
Since 2006, the NIS-Teen has been monitoring vaccination coverage for a nationally representative sample of adolescents age 13-17 years through a random digit dialing (RDD) telephone survey 12. As landline phone use decreased and cell-phone use increased, the NIS-Teen transitioned from a single-frame landline sample in 2006 to dual (landline and cell-phone) sample frame in 2011 to ensure that the survey base reflected the U.S. population 34. However, due to a declining number of landline-only households in the U.S. in recent years5, the NIS-Teen discontinued landline sampling and shifted to single-frame cell-phone RDD sampling in 2018 to increase efficiency. For example, from 2012 to 2018, the proportion of households with 13-17 year old adolescents that were landline-only decreased from 3.5% to 2.2% (Table 1). This report uses the 2016 and 2017 NIS-Teen data to assess the impact of a change from a dual-frame to a single-frame survey design on national, state and selected local area vaccination coverage estimates among adolescents 13-17 years old. Specifically, we examined whether there were differences in vaccination coverage estimates among adolescents age 13-17 years using single-frame cell-phone sample compared with a dual-frame landline and cell-phone sample nationally, by select sociodemographic characteristics, and by state and select local areas and territories using data from 2016 and 2017 NIS-Teen surveys. We assessed these years because they are the most recent with data from the dual-frame design, and provide an opportunity to observe any potential differences in vaccination coverage estimates using different sampling designs.
Methods
NIS-Teen data from 2016 and 2017 were analyzed to assess vaccination coverage among adolescents age 13-17 years using two different sampling designs: (a) single-frame cell-phone design and (b) dual-frame landline and cell-phone design. Dual-frame estimates have previously been published for 2016 and 201767. To produce single-frame estimates, data for 2016 and 2017 were subset to the cell-phone sample and reweighted. Estimates were weighted separately for single- and dual- frame sample designs to adjust for nonresponse in each sampling frame and to calibrate the weights to the total population of age-eligible adolescents. Under both the single- and dual-frame designs, survey weights were calibrated to marginal totals for teen's age, teen's sex, teen's race/ethnicity, mother's education, and household telephone status.
First, sociodemographic characteristics for adolescents under the single- and dual-frame design in 2016 and 2017 were compared. Next, national vaccination coverage estimates for the HPV vaccine (≥1 dose, UTD with the recommended number of doses), overall and by sex, MenACWY (≥1 dose, ≥2 doses), Tdap (≥1 dose), measles, mumps, and rubella vaccine (MMR) (≥2 doses), hepatitis B vaccine (≥3 doses), and varicella vaccine (≥1 dose, ≥2 doses) were assessed by sampling design (single- and dual-frame) and survey year. Furthermore, national coverage for ≥1 dose of HPV vaccine (overall and by sex), MenACWY, and Tdap were assessed by select sociodemographic characteristics (race/ethnicity, poverty status, health insurance status, and metropolitan statistical area (MSA) status for single- and dual-frame designs. Finally, state and select local estimates for HPV vaccine (≥1 dose, UTD, overall and by sex), MenACWY (≥1 dose), and Tdap (≥1 dose) were assessed for single- and dual-frame designs in 2016 and 2017. The distribution of state-level differences for ≥1 dose HPV vaccine, MenACWY, and Tdap, and state-level coverage for ≥1 dose HPV vaccine using single- and dual-frame designs were graphed.
The difference in single- and dual-frame estimates and its confidence intervals were reported for each territory, local area, state and national estimate. A confidence interval that includes zero indicates that there is no statistically significant difference detected between the single- and dual-frame estimates. Confidence intervals that do not include zero suggest that coverage is higher or lower based on the single-frame cell-phone design (if the difference is positive or negative, respectively).
Findings
There were no sociodemographic characteristics that were significantly different by sampling frame in 2016 and 2017 (Table 2). Dropping the landline sampling frame did not substantially change national vaccination coverage estimates for any of the 15 vaccination measures examined among adolescents 13-17 years in 2016 and 2017. Of the 15 comparisons in each year, only three were statistically significant: for HPV vaccination in 2017, single-frame estimates were higher than dual-frame estimates by 0.9 percentage points for ≥1 dose among all adolescents, 1.0 percentage points higher for UTD among all adolescents, and 1.4 percentage points for ≥1 dose among male adolescents (Table 3).
Across sociodemographic factors, the largest number of statistically significant differences between the single- and dual-frame estimates were found for ≥1 dose HPV vaccine. Across 18 comparisons, eight were statistically significant in 2017, ranging from 1.0 to 3.4 percentage points, with the largest difference being among those who were uninsured (Table 4). Among males, 11 were statistically significant, ranging from 1.2 to 3.6 percentage points, with the largest difference being among those whose race/ethnicity was non-Hispanic "other" (Table 5). Among females, two were statistically significant (3.1 and 4.2 percentage points), with the largest difference being among those who were uninsured (Table 6). Coverage was higher under the single-frame design compared to the dual-frame design for all significant differences among both males and females in 2017.
For ≥1 dose MenACWY, there were four statistically significant differences across sociodemographic characteristics in 2017, ranging from -1.3 to 2.3, with the largest differences being among those who were uninsured (Table 7). Compared to the dual-frame design, MenACWY coverage was lower under the single-frame design in 2017 for adolescents age 14 years at interview, those whose household is below the poverty level, and those with other types of insurance. Coverage was higher under the single-frame design compared to the dual-frame design for adolescents who were uninsured.
Similarly, for ≥1 dose Tdap, there were four statistically significant differences across sociodemographic characteristics in 2017, ranging from -0.7 to 2.5, with the largest differences being among those who are uninsured (Table 8). Coverage was lower for single-frame estimates than dual-frame estimates among adolescents aged 13 and 17 years at interview and for Hispanics. Coverage was higher under the single-frame design compared to the dual-frame design for adolescents who were uninsured.
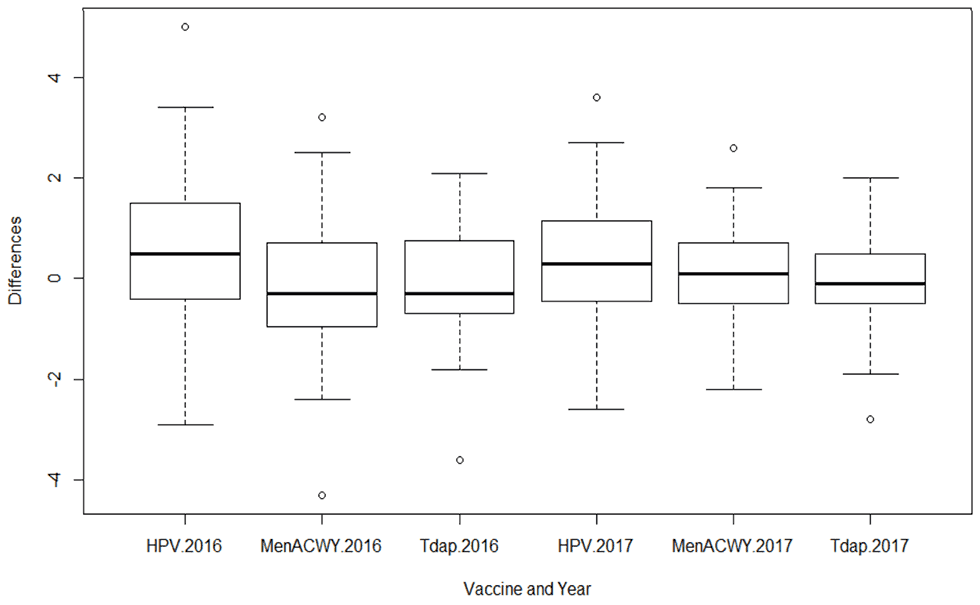
At the state level, the median difference between single-frame and dual-frame design estimates of vaccination coverage was 0.5 in 2016 and 0.3 in 2017 for ≥1 HPV vaccination, -0.3 in 2016 and 0.1 in 2017 for ≥1 MenACWY, and -0.3 in 2016 and -0.1 in 2017 for ≥1 Tdap (Figure 1).
Figure 1. Distribution of state-level differences for ≥1 dose HPV vaccine, MenACWY, and Tdap, National Immunization Survey-Teen, 2016 and 2017

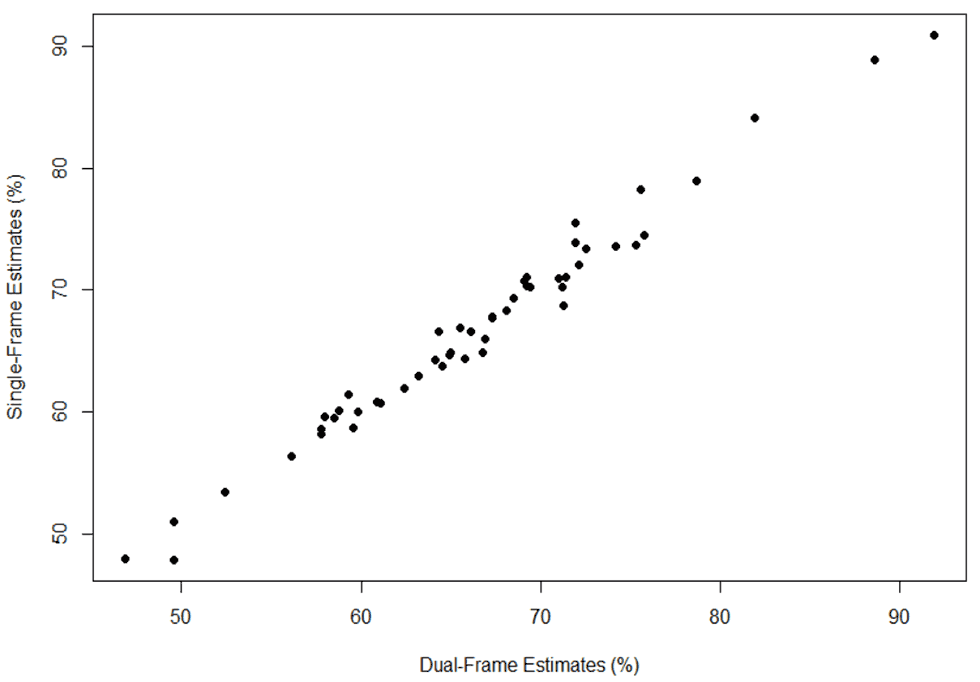
The majority of the state-level differences were between -2.0 and 2.0 percentage points across the three vaccines for both years. A scatterplot of state-level estimates of ≥1 dose HPV vaccine coverage in 2017 showed a high correlation between single- and dual-frame estimates (r=0.99) (Figure 2).
Figure 2. Scatterplot of state-level coverage for ≥1 dose HPV vaccine using single- and dual-frame designs, National Immunization Survey- Teen, 2017

Few differences between single- and dual-frame estimates among states, local areas, and territories were statistically significant; four in each year for ≥1 HPV vaccination, six in 2016 and nine in 2017 for ≥1 MenACWY, and nine in each year for ≥1 Tdap (Table 9 and Table 10). For UTD HPV vaccination, there was one jurisdiction with a statistically significant difference in 2016; by sex, there were six and nine jurisdictions with significant differences among females and males, respectively (Table 11). In 2017, there were six jurisdictions with statistically significant differences; by sex, there were ten and nine jurisdictions with significant differences among females and males, respectively (Table 12).
Conclusions
Vaccination coverage estimates using the single-frame design were similar to estimates from the dual-frame design nationally and by state and select local areas and territories. Although there were some differences by sociodemographic factors, the differences did not affect patterns of coverage. For example, under the single-frame design, coverage for ≥1 HPV vaccination is higher among minorities, those living below poverty, and those living in urban areas, similar to coverage under the dual-frame design.
Nationally, HPV vaccination coverage was slightly higher in 2017 under the single-frame cell-phone design overall, due to the difference among male adolescents. In 2017, a consistent finding across HPV vaccine (both males and females), Tdap, and MenACWY (≥1 dose) was higher coverage for single-frame estimates among the uninsured, with percentage point differences ranging from 2.3 (MenACWY) to 4.2 (≥1 HPV vaccination among females).
Reasons for these differences are not clear. In general, single-frame estimates differ from dual-frame estimates in two ways. First, they exclude adolescents from landline-only households and adolescents in households with both landline and cell telephones (dual users) reached by the survey through a landline phone. Second, the subgroups of respondents included in both estimates (households with only cell-phones and dual user households reached by cell-phone) are weighted differently in single-frame and dual-frame estimates. Thus, single-frame estimates may differ from dual-frame estimates because: 1) vaccination coverage for adolescents in landline only households may differ from coverage in households with cell-phones; 2) vaccination coverage in dual user households that respond to the survey by landline phone may differ from coverage in dual user households that respond by cell-phone; and 3) different levels of bias for single-frame and dual-frame estimates may remain after weighting adjustments that aim to make the samples representative of the adolescent population.
Because landline-only households constituted only a small percentage of the dual-frame sample (e.g., 2% in 2017), the potential for differences in single- and dual-frame estimates is limited. A lack of precision for some vaccines may be responsible for not finding statistically significant differences, although the half-width of confidence intervals for differences in vaccination coverage between single- and dual-frame estimates averaged at most three percentage points (Table 13). Moreover, some of the statistically significant differences could be due to chance because of multiple comparisons8.
Other limitations should also be noted. Due to low sample size among specific sub-groups, we were unable to determine characteristics that may help explain the higher coverage estimates in these groups, such as among the uninsured. Bias may also remain after weighting adjustments for incomplete data from the sample frame and non-response.
As the NIS transitioned from a dual- to single-frame design in 2018, it is important to consider that there may be small changes in vaccination coverage estimates with the change in sampling design. As a result, assessing trends in coverage or comparing coverage estimates from 2018 data with data from prior years should be done with caution. However, any differences in vaccination coverage between single- and dual-frame designs are expected to be small and decrease even further as landline-only use continues to decline in the U.S.
Authors
Kimberly H. Nguyen, DrPH, Jim Singleton, PhD; Laurie D. Elam-Evans, PhD; Holly A. Hill, MD, PhD; Tanja Walker, MPH; David Yankey, PhD; Zhen Zhao, PhD; Immunization Services Division, National Center for Immunization and Respiratory Diseases, Centers for Disease Control and Prevention
Benjamin Fredua, MS, Leidos
Xian Tao, PhD, Ben Skalland, PhD, Kirk Wolter, PhD, NORC at the University of Chicago
- About the National Immunization Surveys (NIS). (2018). Centers for Disease Control and Prevention. Available at: www.cdc.gov/vaccines/imz-managers/nis/about.html.
- National Immunization Survey-Teen. (2014). Centers for Disease Control and Prevention. Available at: ftp://ftp.cdc.gov/pub/Health_Statistics/NCHS/Dataset_Documentation/NIS/NISTEENPUF14_DUG.pdf.
- Wolter KM, Smith PJ, Khare M, et al. (2017). Statistical methodology of the National Immunization Survey, 2005-2014. National Center for Health Statistics. Vital and Health Statistics 1(61).
- Greby, S, Knighton, C, Singleton, J, Black, C, Dorell, C, Yankey, D, Copeland, K, Montgomery, R, Pineau, V, Welch, B, Wolter, K (2012). Adding Households with Cell-phone Service to the National Immunization Survey (NIS). Available at: www.cdc.gov/vaccines/imz-managers/coverage/nis/child/dual-frame-sampling.html#f6
- Blumberg SJ, Luke JV. (2017). Wireless substitution: Early release of estimates from the National Health Interview Survey, July-December 2016. Available from: www.cdc.gov/nchs/data/nhis/earlyrelease/wireless201705.pdf.
- Walker, TY, Elam-Evans, LD, Singleton, JA, Yankey, D, Markowitz, LE, Fredua, B, Williams, CL, Meyer, SA and Stokley, S (2017). National, regional, state, and selected local area vaccination coverage among adolescents aged 13–17 years—United States, 2016. Morbidity and mortality weekly report, 66(33), 874.
- Walker, TY, Elam-Evans, LD, Yankey, D, Markowitz, LE, Williams, CL, Mbaeyi, SA, Fredua, B and Stokley, S. (2018). National, regional, state, and selected local area vaccination coverage among adolescents aged 13–17 years—United States, 2017. Morbidity and Mortality Weekly Report, 67(33), 909.
- Hsu, J. (1996). Multiple comparisons: theory and methods. Chapman and Hall/CRC.
