About
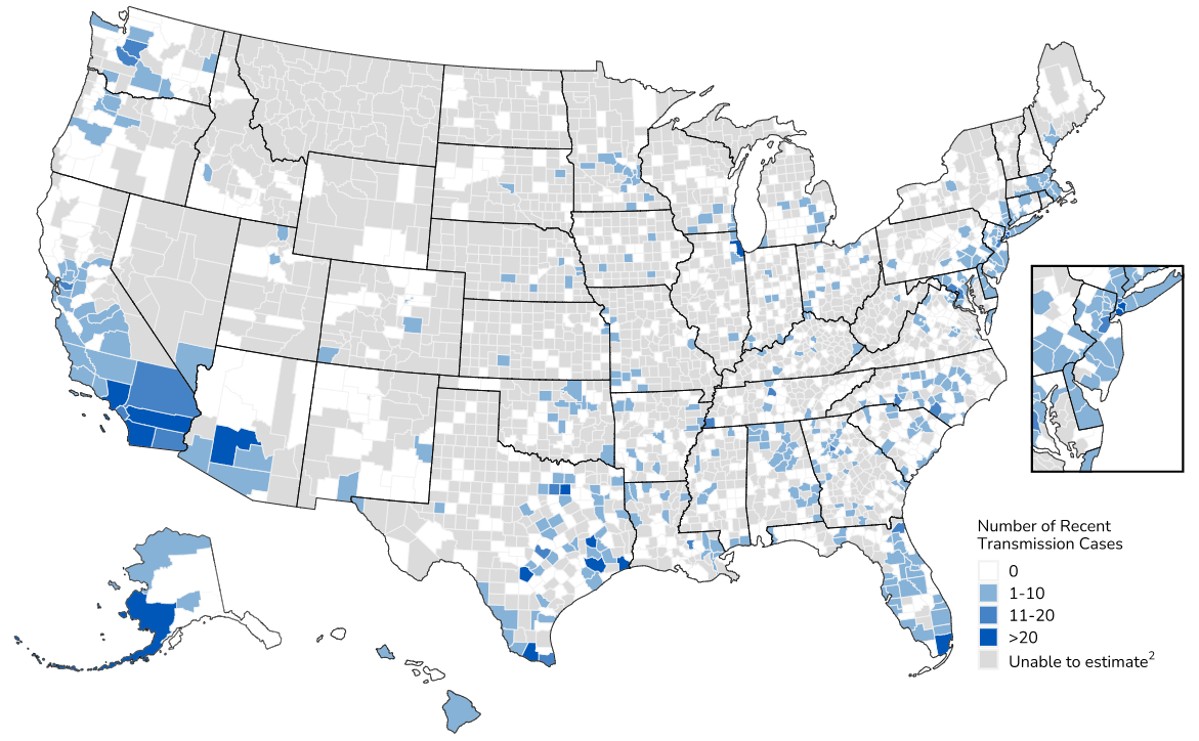
This map reports the number of tuberculosis (TB) cases that were attributed to recent transmission by county or county equivalent during 2023-2024.
Key Highlights
- TB cases attributed to recent transmission during 2023–2024 were not distributed evenly across the country.
- Fifteen counties or county-equivalent areas reported >20 cases attributed to recent transmission, 22 reported 11–20 cases, 370 reported 1–10 cases, and 810 reported 0 cases.
- The remaining 1,903 counties had no genotyped cases that could be evaluated for recent transmission during 2023–2024.
Data map
Figure 1. Tuberculosis Cases Estimated to be Attributed to Recent Transmission:1 United States, 2023–2024
Notes
1A case is attributed to recent transmission if a plausible source case can be identified in a person who had an M. tuberculosis isolate with the same wgMLSType that differed by ≤5 single nucleotide polymorphisms, had an infectious form of TB, was 10 years of age or older, resided within 100 miles of the case, and was diagnosed within 2 years before the case.
2Counties shaded gray had no genotyped cases that could be evaluated for recent transmission during 2023–2024.
Data for all years are updated through July 10, 2025.
See Technical Notes.