Demographics and Healthcare Utilization Data: California (2018)

At a glance

The Sickle Cell Data Collection (SCDC) program monitors and reports on the health of people with sickle cell disease (SCD) over time. View data from California on this page.

California state shaded black.

Overview

California’s Demographics and Healthcare Utilization Data are available for each year from 2010 through 2018. They provide information about the number of people with SCD in the state, their emergency department (ED) visits, and their hospitalizations during a particular year.

The people included in the 2018 data met at least one of the following criteria:

  • Born in 2018 and reported by the state newborn screening program with a confirmed diagnosis of SCD
  • Born prior to 2018 and reported by the state newborn screening program with a confirmed diagnosis of SCD and at least one of the following criteria:
    • Hospital discharge or ED utilization during 2018 or before and after 2018
    • Enrollment in the California Medicaid program during 2018 or before and after 2018
  • Received care at one of the state's clinical sites providing data to SCDC and a laboratory-confirmed diagnosis of SCD and at least one of the following criteria:
    • Received care at the clinical site during 2018 or after 2018
    • Hospital discharge or ED utilization during 2018 or before and after 2018
    • Enrollment in the California Medicaid program during 2018 or before and after 2018
  • Three or more healthcare visits (hospital, ED, or outpatient) with an SCD ICD-9-CM (through September 30, 2015) or ICD-10-CM (after October 1, 2015) code over any 5-year period between January 1, 2004, and December 31, 2019, and at least one of the following criteria:
    • Hospital discharge or ED utilization during 2018 or before and after 2018
    • Enrollment in the California Medicaid program during 2018 or before and after 2018

The clinical sites that are providing data to the SCDC program are‎

- The Center for Inherited Blood Disorders
- Children's Hospital Orange County
- Children's Hospital Los Angeles
- Loma Linda Medical Center
- Lucille Packard Children's Hospital at Stanford
- Rady Children's Hospital/University of California San Diego School of Medicine

- Sickle Cell Disease Foundation of California (community-based organization)
- University of California Davis Medical Center
- University of California Irvine Medical Center
- University of California San Francisco Benioff Children's Hospital (Oakland and San Francisco campuses)
- Valley Children's Hospital
- Zuckerberg San Francisco General Hospital & Trauma Center

Age: age on December 31, 2018

Hospital admissions: direct hospital admissions or hospital admissions that originated in the ED

30-day hospital readmissions: hospital or ED readmission within 30 days of discharge from the initial hospital admission

ED visits: ED visits that resulted in a release after treatment

30-day ED readmissions: hospital or ED readmission within 30 days of discharge from the initial ED visit

Demographics
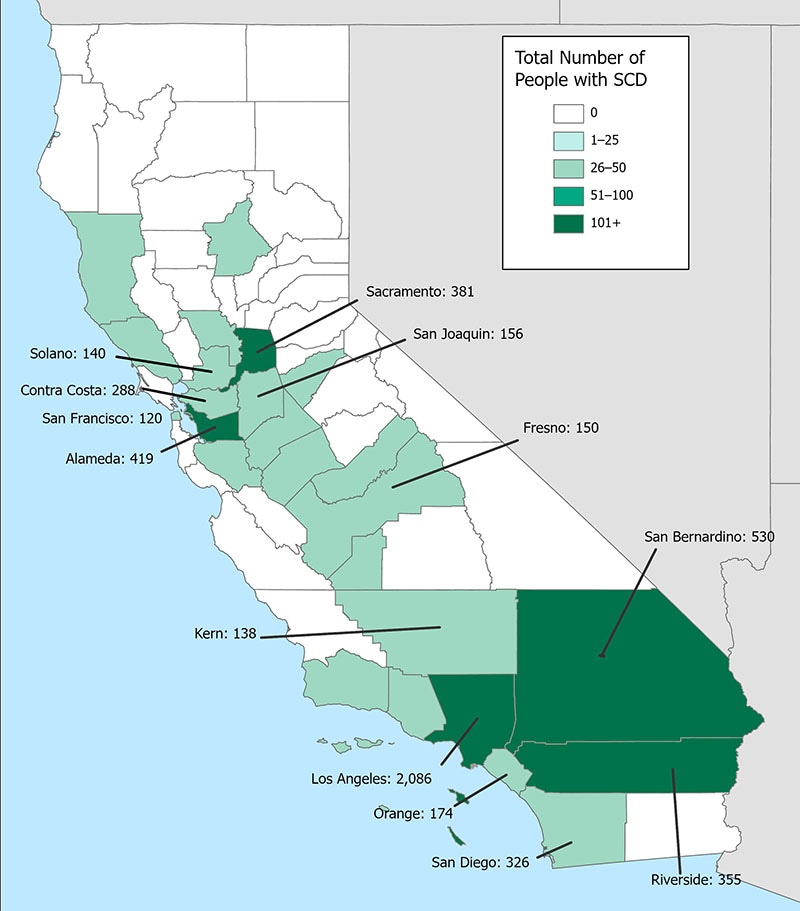
Map 1: Number of people with SCD by county of residence, California SCDC Data, 2018
Map 1: More than 80% of the counties in California had at least one person with SCD in 2018. More than 30% of the people with SCD who lived in California resided in Los Angeles County.
Map 1: Number of people with SCD by county of residence, California SCDC Data, 2018

Download current and archived data tables (2010-2018)

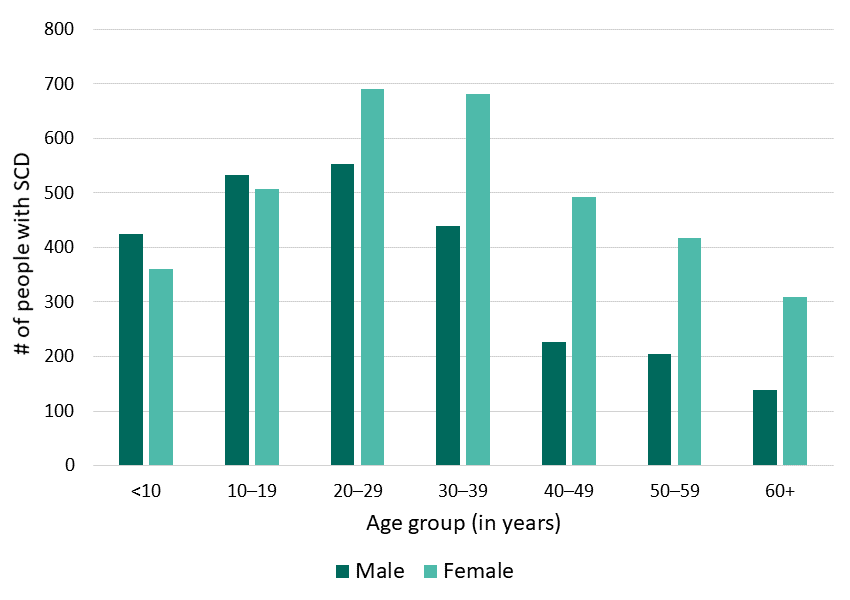
Figure 1: Age and sex, California SCDC Data, 2018
Figure 1: There were almost 6,000 people with SCD living in California in 2018. Almost 30% of them were 40 years old or older.
Figure 1: Age and sex, California SCDC Data, 2018

Download current and archived data tables (2010-2018)

Hospitalization utilization

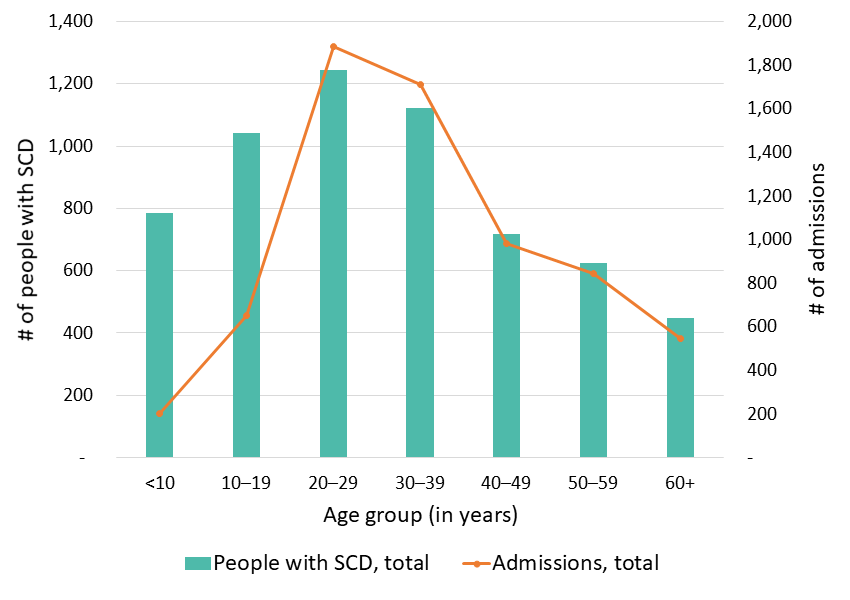
Figure 2: Total number of hospital admissions, California SCDC Data, 2018
Figure 2: People with SCD living in California in 2018 had a total of more than 6,500 hospital admissions.
Figure 2: Total number of hospital admissions, California SCDC Data, 2018

Download current and archived data tables (2010-2018)

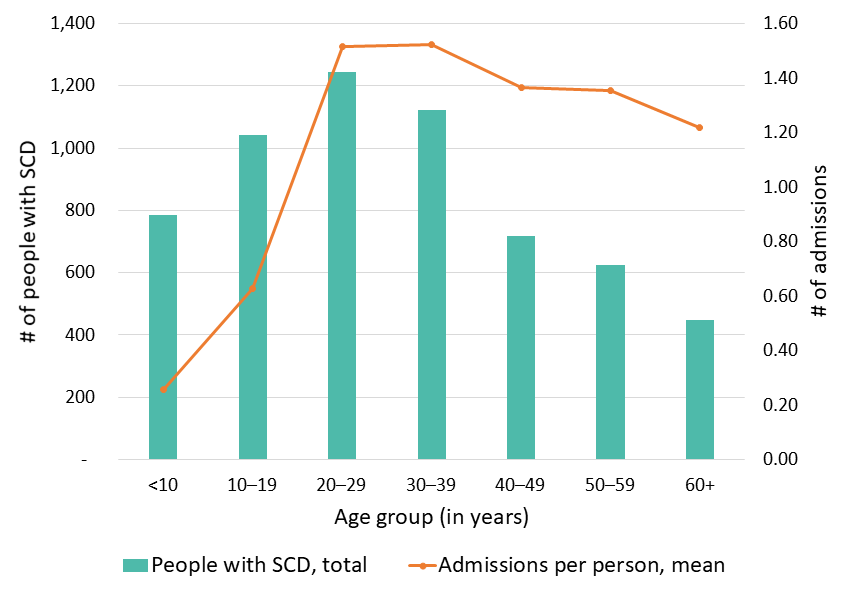
Figure 3: Average number of hospital admissions, California SCDC Data, 2018
Figure 3: The average number of hospitalizations for people with SCD living in California in 2018 was highest for 20- to 39-year-olds (1.5 hospitalizations) and lowest for <10-year-olds (0.3 hospitalizations).
Figure 3: Average number of hospital admissions, California SCDC Data, 2018

Download current and archived data tables (2010-2018)

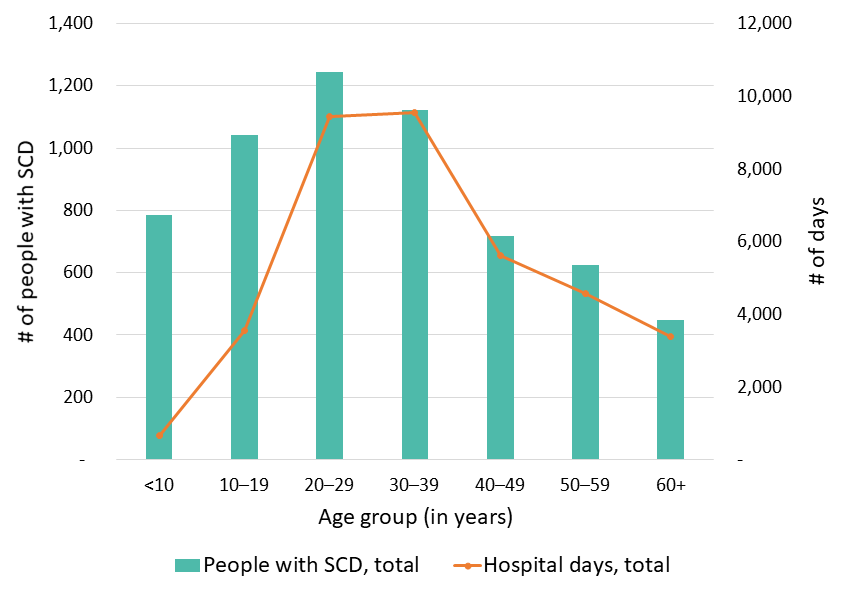
Figure 4: Total number of days in the hospital, California SCDC Data, 2018
Figure 4: People with SCD living in California in 2018 spent a total of almost 37,000 days in the hospital.
Figure 4: Total number of days in the hospital, California SCDC Data, 2018

Download current and archived data tables (2010-2018)

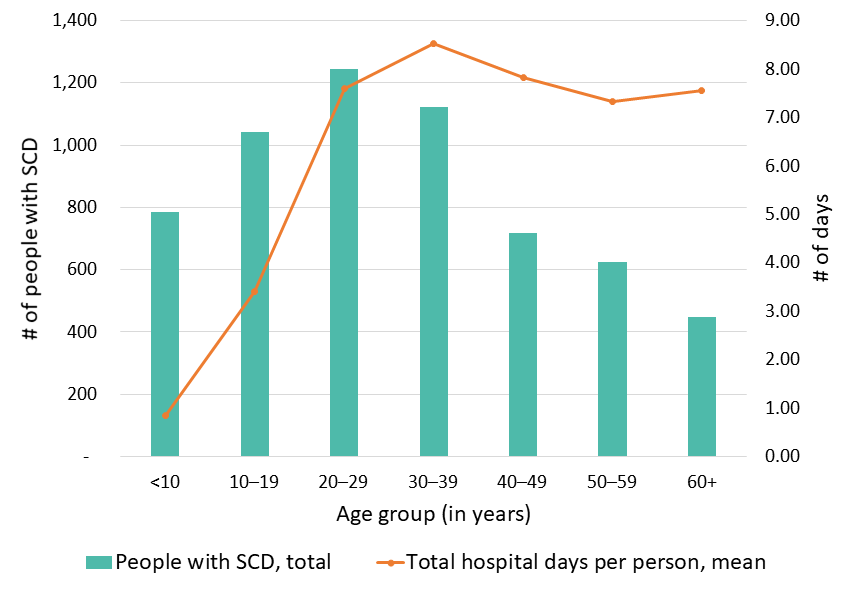
Figure 5: Average number of days in the hospital, California SCDC Data, 2018
Figure 5: The average number of days in the hospital for people with SCD living in California in 2018 was highest for 30- to 39-year-olds (8.5 days) and lowest for <10-year-olds (0.9 days).
Figure 5: Average number of days in the hospital, California SCDC Data, 2018

Download current and archived data tables (2010-2018)

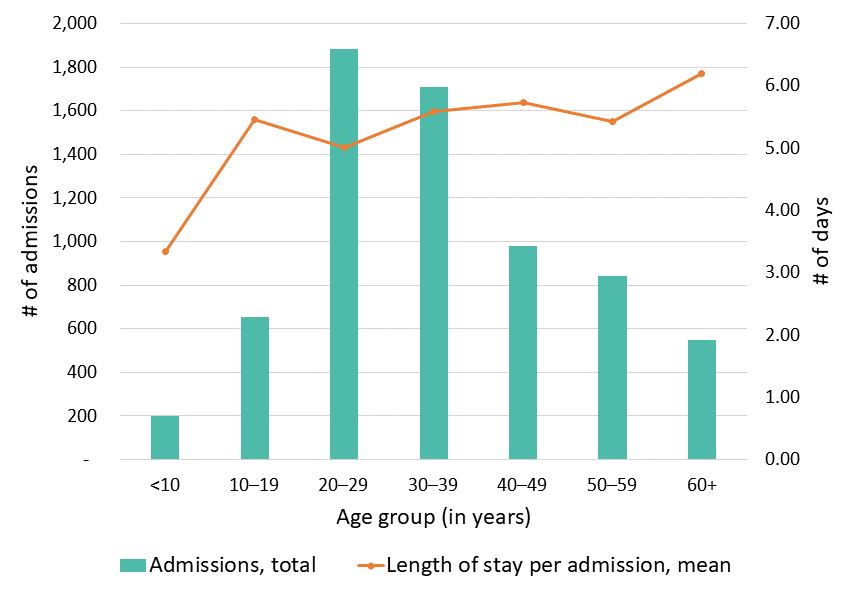
Figure 6: Average length of stay in the hospital, California SCDC Data, 2018
Figure 6: The average length of stay for a hospitalization for people with SCD living in California in 2018 was highest for people aged 60 years and older (6.2 days) and lowest for <10-year-olds (3.3 days).
Figure 6: Average length of stay in the hospital, California SCDC Data, 2018

Download current and archived data tables (2010-2018)

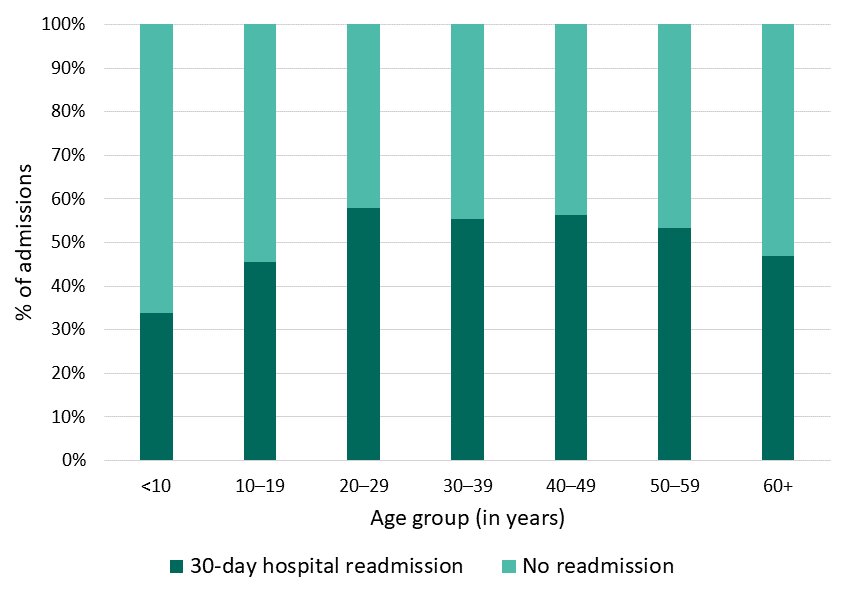
Figure 7: 30-day hospital readmissions, California SCDC Data, 2018
Figure 7: More than 55% of hospitalizations for 20- to 49-year-olds with SCD living in California in 2018 were followed by another hospital or ED admission within 30 days of discharge from the first hospitalization.
Figure 7: 30-day hospital readmissions, California SCDC Data, 2018

Download current and archived data tables (2010-2018)

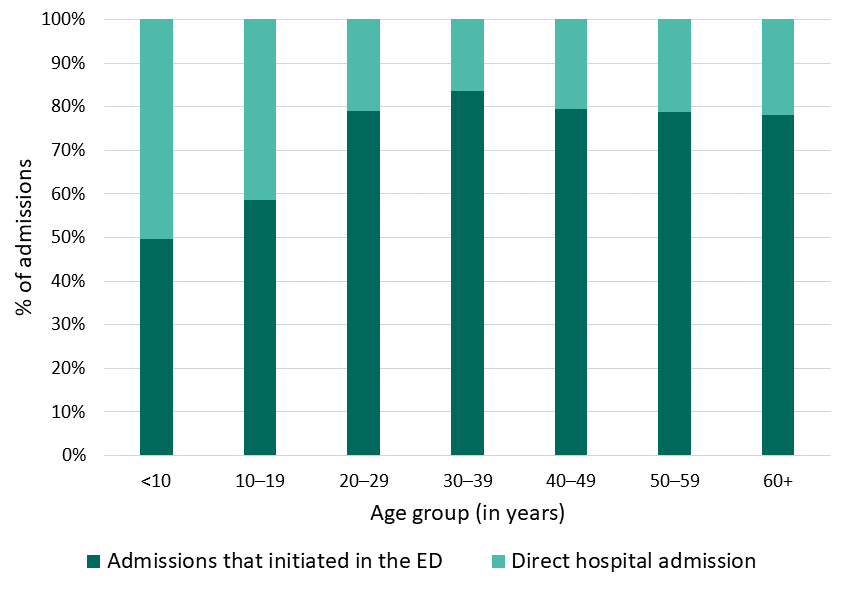
Figure 8: Hospital admissions that initiated in the ED, California SCDC Data, 2018
Figure 8: More than 75% of hospitalizations for people aged 20 years and older with SCD living in California in 2018 began in the ED.
Figure 8: Hospital admissions that initiated in the ED, California SCDC Data, 2018

Download current and archived data tables (2010-2018)

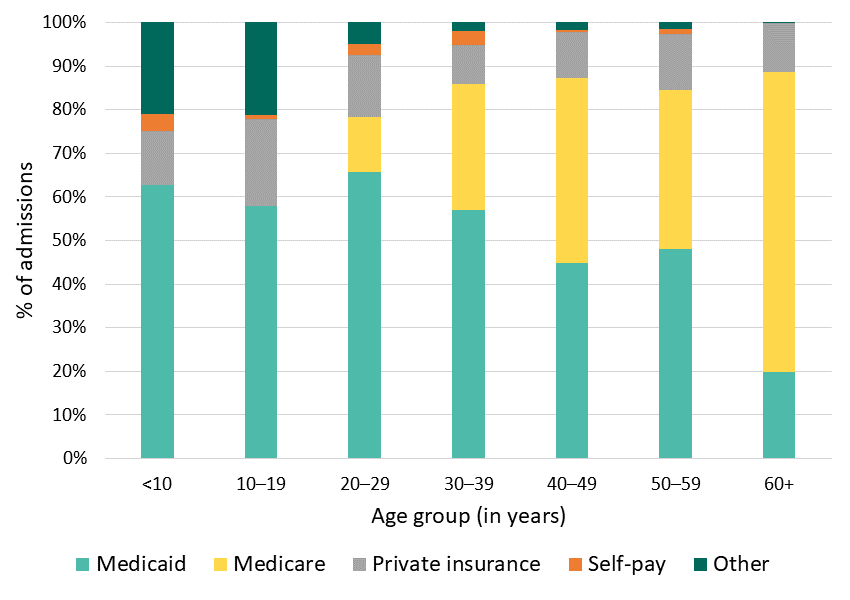
Figure 9: Payer of hospital admissions, California SCDC Data, 2018
Figure 9: More than 60% of hospitalizations for people with SCD living in California in 2018 were paid for by public insurance (Medicaid or Medicare).
Figure 9: Payer of hospital admissions, California SCDC Data, 2018

Download current and archived data tables (2010-2018)

ED utilization

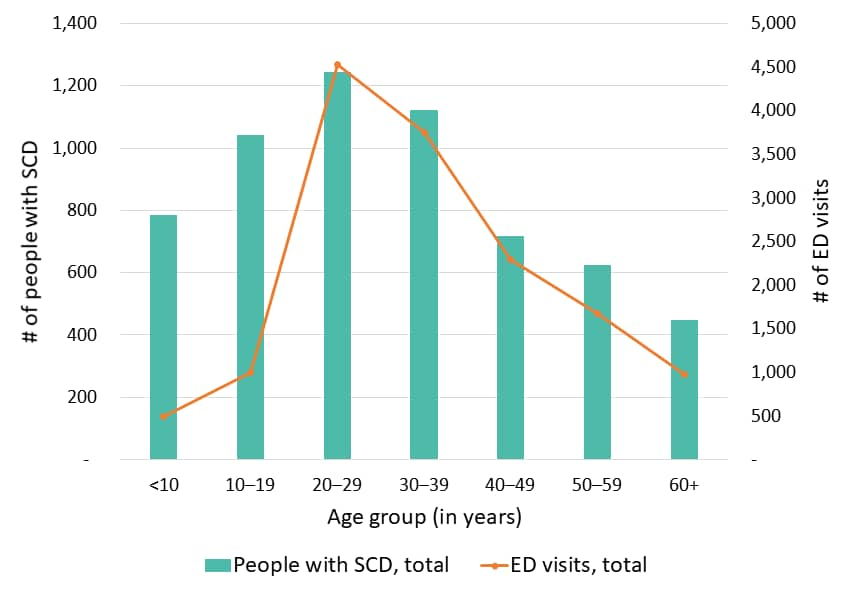
Figure 10: Total number of ED visits, California SCDC Data, 2018
Figure 10: People with SCD living in California in 2018 had a total of more than 14,500 ED visits.
Figure 10: Total number of ED visits, California SCDC Data, 2018

Download current and archived data tables (2010-2018)

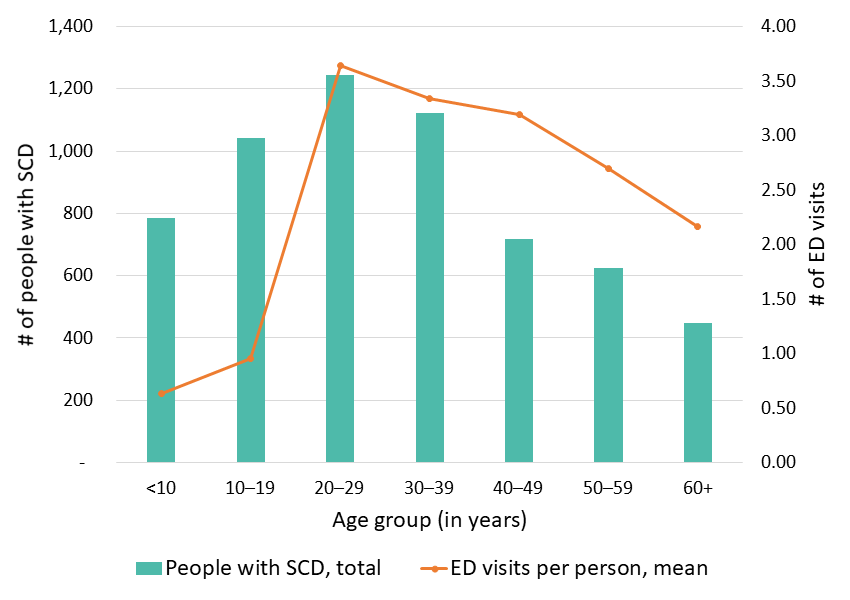
Figure 11: Average number of ED visits, California SCDC Data, 2018
Figure 11: The average number of ED visits for people with SCD living in California in 2018 was highest for 20- to 29-year-olds (3.6 ED visits) and lowest for <10-year-olds (0.6 ED visits).
Figure 11: Average number of ED visits, California SCDC Data, 2018

Download current and archived data tables (2010-2018)

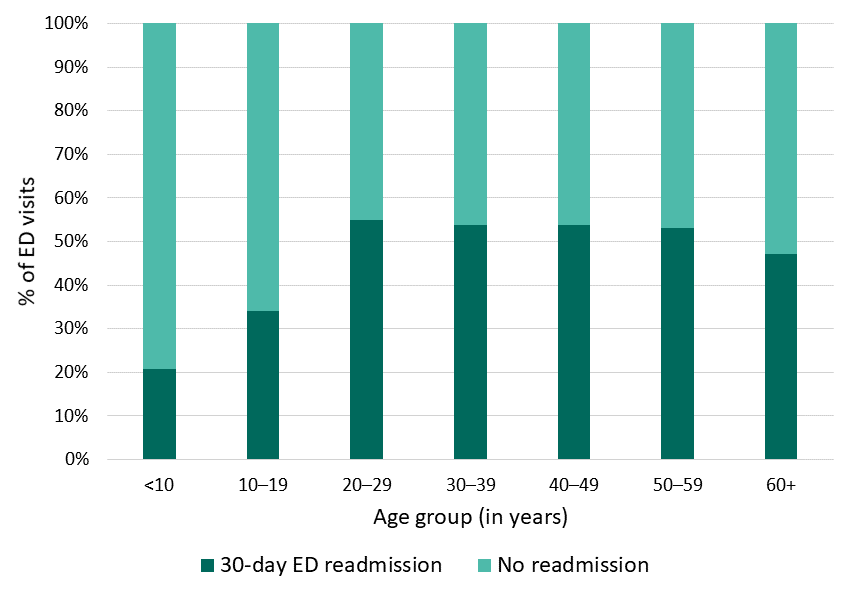
Figure 12: 30-day ED readmissions, California SCDC Data, 2018
Figure 12: More than 50% of ED visits for 20- to 59-year-olds with SCD living in California in 2018 were followed by another hospital or ED admission within 30 days of discharge from the first ED visit.
Figure 12: 30-day ED readmissions, California SCDC Data, 2018

Download current and archived data tables (2010-2018)

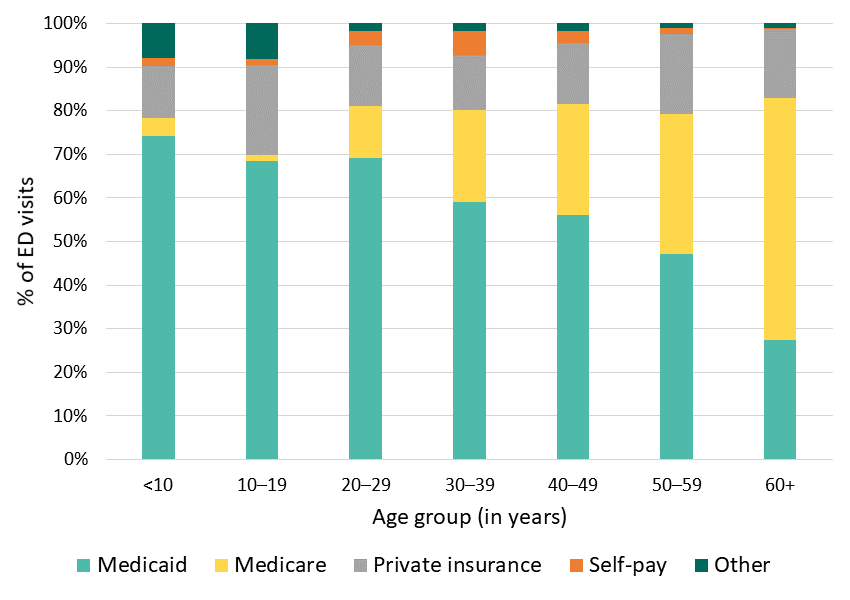
Figure 13: Payer of ED visits, California SCDC Data, 2018
Figure 13: More than 70% of ED visits for people with SCD living in California in 2018 were paid for by public insurance (Medicaid or Medicare).
Figure 13: Payer of ED visits, California SCDC Data, 2018

Download current and archived data tables (2010-2018)