What to know
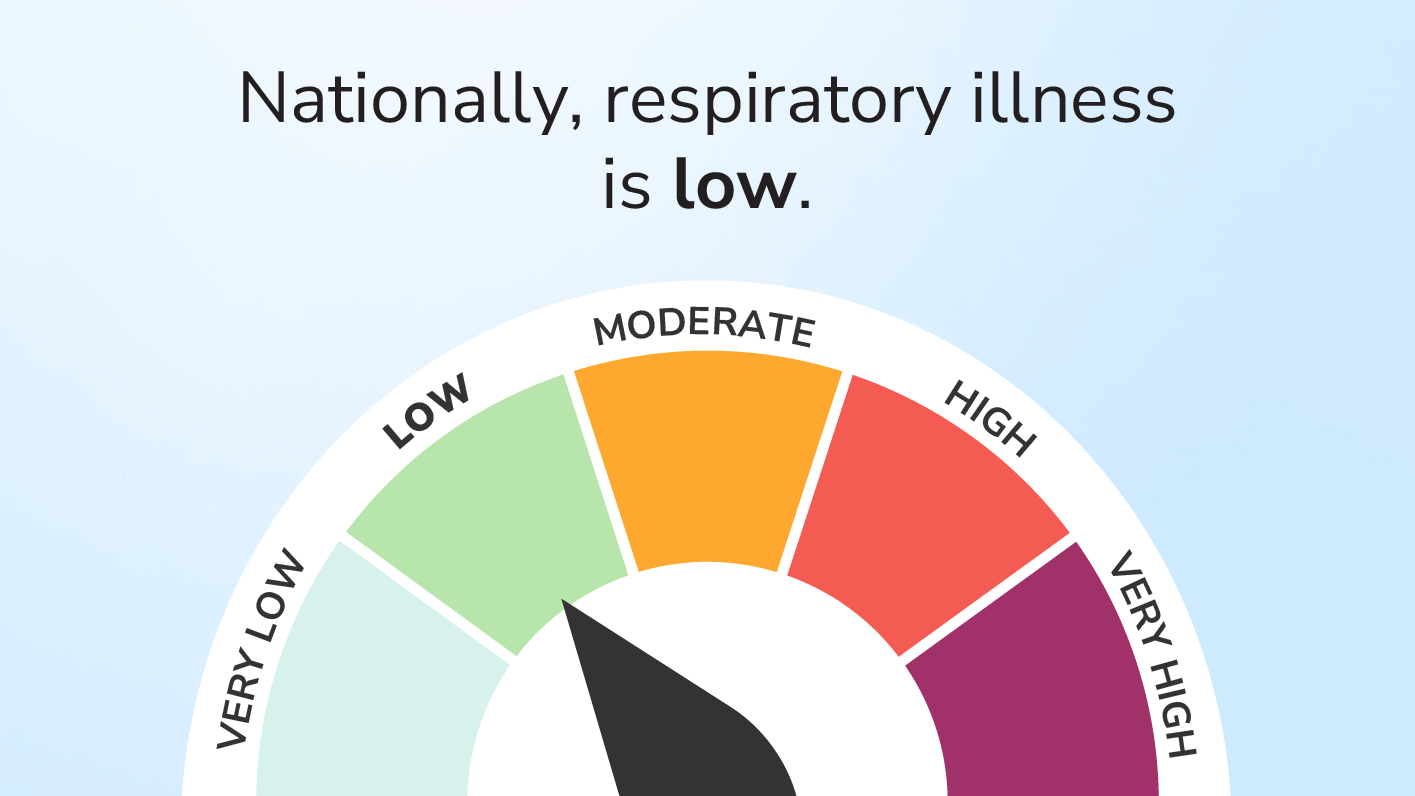
- As of December 20, 2024, the amount of acute respiratory illness causing people to seek healthcare is moderate nationally.
- COVID-19 activity is increasing from low levels in some areas of the nation.
- Seasonal influenza activity is moderate and continues to increase across the country.
- RSV activity is high and continues to increase in most areas of the United States, particularly in young children.
Your community snapshot
The CDC may not have data for all states, counties, or territories. Read more »
What it is: A measure of how frequently a wide variety of respiratory symptoms and conditions are diagnosed by emergency department doctors, ranging from the common cold to COVID-19, flu, and RSV.
Why it matters: Summarizes the total impact of respiratory illnesses, regardless of which diseases are causing people to get sick.
* Overall respiratory illness activity is displayed at the state or territory level, local data is unavailable at this time.
What it is: A measure of how much virus is present in sewage.
Why it matters: People who are infected often shed virus into wastewater, even if they don’t have symptoms. As a result, high wastewater levels may indicate an increased level of infections even when other measures remain low.
* Wastewater data is displayed at the state or territory level, local data is unavailable at this time.
† Flu levels are for Influenza A only, which includes avian influenza A(H5). Wastewater data can not determine the source of viruses (from humans, animals, or animal products).
What it is: A measure of how many people are seeking medical care in emergency departments.
Why it matters: When levels are high, it may indicate that infections are making people sick enough to require treatment.
* Emergency department data may cover an entire state or Health Service Area. Each Health Service Area includes one or more counties.
* Data is displayed at the state or territory level.
Season Outlook
As of December 19, CDC continues to expect the fall and winter virus season will have a similar or lower peak number of combined hospitalizations from COVID-19, influenza, and RSV compared to last year. However, peak hospitalizations from all respiratory viruses remain likely to be much higher than they were before the emergence of COVID-19.
CDC has updated the outlook this week. This update uses historical data and COVID-19 scenario modeling to assess when peak hospital demand may occur nationally and regionally. Additional updates will occur if there are big changes in how COVID-19, flu, or RSV are spreading. Read the entire 2024-2025 Respiratory Season Outlook- December Update. (12/20/2024).
Protect yourself and your community
- Safeguard your health - Get the latest information from Vaccines.gov
- Order 4 free at-home COVID-19 tests today on COVIDTests.gov
- Explore resources and recommendations for older adults - Stay informed and protected
- Review tailored health recommendations for high-risk individuals
- Feeling ill? Take immediate steps to protect yourself and others – Start here
- Have symptoms? Consider wearing a mask
- Take action against germs – Practice good hygiene
- Got questions? Check out our FAQs
Continue exploring these data
Explore related data
Anticipated trends for COVID-19 infections, based on modeling, are displayed at the national and state levels.
Wastewater (sewage) data specific to SARS-CoV-2, the virus that causes COVID-19, are displayed at the national, regional, and state levels. These data can provide an early signal of changes in infection levels.
Data on COVID-19 cases and deaths among residents and staff of nursing homes are displayed at the national and state levels.