Purpose
A video training focused on using environmental monitoring data to support public health decision making in radiation emergencies.
Maps
The files below are examples of maps that response officials may use during a radiation emergency. These maps provide information on the predicted or measured effects of the radiation emergency and are useful for planning and directing response efforts.
1. Prompt Effects of an Improvised Nuclear Device (IND)
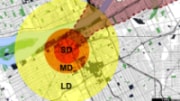
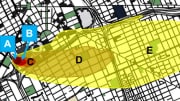
Predicted Damage Response Zones: This map is based on the assumed magnitude of the explosion. It delineates the Severe Damage (SD), Moderate Damage (MD), and Light Damage (LD) zones. Responders and decision-makers will use this map during the first few hours post-detonation to prioritize efforts to save lives in the impacted area.
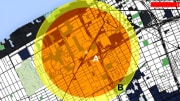
Prompt Effects on Population: This map is based on the assumed magnitude of the explosion. It delineates areas where few, if any, people would be expected to survive the combined effects of blast, heat, and radiation, and those areas where a large number of injuries would be expected due to structural collapse, fire, and flying debris. Responders and decision-makers will use this map during the first few hours post-detonation to prioritize search and rescue efforts. It should be noted that the area where few, if any, survivors would be expected roughly corresponds to the Severe Damage zone.
2. Radioactive Fallout from an Improvised Nuclear Device (IND)
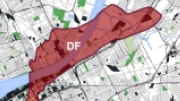
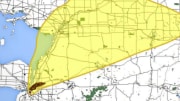
Predicted Dangerous Fallout Zone: This map is based on the assumed magnitude of the explosion and the predicted or observed meteorological conditions. It delineates the area where the radiation dose rate is 10 R/h (100 mSv/h) or greater. This area is known as the Dangerous Fallout (DF) zone. Responders and decision-makers will use this map during the first few hours to days post-detonation to advise the affected population to shelter (within the DF zone) or evacuate (outside the DF zone, barring any impediments to evacuation). It should be noted that radiation levels from an IND will change rapidly, and the size of the Dangerous Radiation Zone will shrink considerably within the first 48-72 hours. Terminology for the “Dangerous Fallout Zone” changed to “Dangerous Radiation Zone” with the third edition of the Planning Guidance for Response to a Nuclear Detonation.
This map may be refined as actual radiation measurements become available.
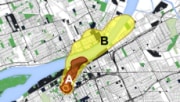
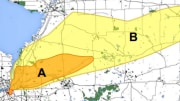
Predicted Area for Potential Fallout Casualties: This map is based on the assumed magnitude of the explosion and the predicted or observed meteorological conditions. It delineates those areas where radiation levels due to fallout could lead to fatalities among unprotected members of the population within the first few days to weeks (cumulative dose greater than 450 rad or [4.5 Sv]), and areas where unprotected members of the population would be expected to exhibit symptoms of radiation sickness (cumulative dose greater than 100 rad or [1 Sv]). Responders and decision-makers will use this map during the first few hours / days post-detonation to determine the need for and nature of protective measures (i.e., sheltering and evacuation), determine potential medical support needs, and prioritize rescue efforts.
This map may be refined as actual radiation measurements become available.
3. Worker Protection
Predicted Hot Zone: This map is applicable to Improvised Nuclear Device (IND) incidents. The model is based on the assumed magnitude of the explosion and the predicted or observed meteorological conditions. It delineates two areas with elevated radiation dose rates – the Dangerous Fallout (DF) zone, where the radiation dose rate is 10 R/h (100 mSv/h) or greater, and the Hot Zone, where radiation dose rate is between 10 mR/h (0.1 mSv/h) and 10 R/h (100 mSv/h). It should be noted that radiation levels from an IND will change rapidly, and the size of both zones will shrink considerably within the first 48-72 hours. Responders and decision-makers will use this map to identify areas in which detailed mission planning would be required because of elevated radiation levels, and to determine stay-times for emergency responders based on the nature of their mission (i.e., life-saving, protection of property, radiation monitoring, etc.)
This map may be refined as actual radiation measurements become available.
Worker Protection Areas: This map is applicable to both IND and Radiological Dispersal Device (RDD) incidents. The model is based on the assumed magnitude of the explosion and radioactive “source term” (i.e., the type(s) and amount(s) of radioactive material involved in the incident) and the predicted or observed meteorological conditions. It delineates areas where radiation dose rates exceed pre-defined values, typically 10 R/h (100 mSv/h), 1 R/h (10 mSv/h), 100 mR/h (1 mSv/h) and 10 mR/h (0.1 mSv/h). Responders and decision-makers will use this map during all phases of the response to identify areas in which detailed mission planning would be required because of radiation levels and to determine stay-times for emergency responders based on the nature of their mission (i.e., life-saving, protection of property, radiation monitoring, etc.).
This map may be refined as actual radiation measurements become available.
4. Short-term Protective Measures
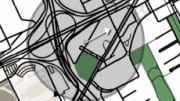
Default Evacuation or Sheltering Area: This map is applicable to an RDD incident, and is based on default guidance from the Conference of Radiation Control Program Directors, Inc. (CRCPD), a professional organization of state radiation control officials. It delineates the default 1,650 foot (500 meter) precautionary protective measure radius for an RDD incident. It is NOT based on the actual radioactive source term or meteorological conditions. Responders and decision-makers will use this map in the first few minutes to hours of the response to determine the boundaries of precautionary protective measure areas prior to having detailed information regarding the nature of the RDD.
Predicted Sheltering/Evacuation Areas: This map is applicable to both IND and RDD incidents, and is based on the assumed magnitude of the explosion and radioactive source term and the predicted or observed meteorological conditions. It delineates areas in which doses to members of the public due to radioactive materials exceed Environmental Protection Agency (EPA) and Department of Homeland Security (DHS) default recommendations for local and state officials for evacuation (1-5 rem [10-50 mSv]) or sheltering. In general, evacuation should be the preferred protective measure unless local conditions make evacuation unsafe.
If this map is produced while airborne radioactive materials are still present in the environment, the estimated radiation dose will include both internal radiation dose due to inhalation of radioactive materials and external radiation dose due to deposited radioactive materials. Typically, the dose calculation is for the first 96 hours (4 days) after the incident.
Decision-makers will use this map during the first few hours of a response and thereafter to determine the appropriate protective measure for members of the general public.
This map may be refined as actual radiation measurements become available.
5. Long-term Protective Measures
Predicted Relocation Areas: This map is applicable to both IND and RDD incidents. Initially, it will be based on the assumed magnitude of the explosion and radioactive source term and the predicted or observed meteorological conditions. It delineates areas where radiation doses to members of the public continuously occupying these areas would exceed Environmental Protection Agency (EPA) and Department of Homeland Security (DHS) default recommendations to local and state officials for relocation (2 rem [20 mSv] in the first year, 0.5 rem [5 mSv] during any year after the first year). Decision-makers will use this map days to weeks into the response to determine areas where members of the public should be relocated or where remedial actions should be undertaken. This map may also be used to determine areas where it is safe for people who evacuated during the early stages of the incident to return to their homes and businesses.
This map will be refined as actual radiation measurements become available, and no relocation decisions should be made until actual radiation conditions are well understood.
Predicted Area of Concern for Agricultural Products: This map is applicable to both IND and RDD incidents. Initially, it will be based on the assumed magnitude of the explosion and radioactive source term and the predicted or observed meteorological conditions. It delineates areas where the concentrations of radioactive materials in food products (i.e., products that are prepared for consumption) exceed default guidance levels provided by the US Food and Drug Administration (FDA). Days to weeks into the incident response, decision-makers will use this map to determine the need for environmental sampling and analysis for radioactive materials, and to inform decisions regarding restrictions on consumption and/or distribution of agricultural products.
The exact nature of these maps will be highly dependent on the agricultural product(s) present and the radioactive materials present in the environment. Typical maps would include contamination of milk (due to the short period of time between production and consumption) and contamination of agricultural products ready for harvest. Where several different agricultural products are present, there may be a series of these maps. Similarly, if the incident involves several different radioactive materials, there may be several different maps. Conceivably, there could be one map for each combination of agricultural product and radioactive material.
This map will be refined as actual laboratory measurements of radioactive materials in agricultural products become available. Typical practice is for agricultural restrictions to be imposed shortly after a radiological incident, and for maps such as this to be used to help decision makers determine if it is appropriate to relax those restrictions.

