About
Getting started
Understanding the layout
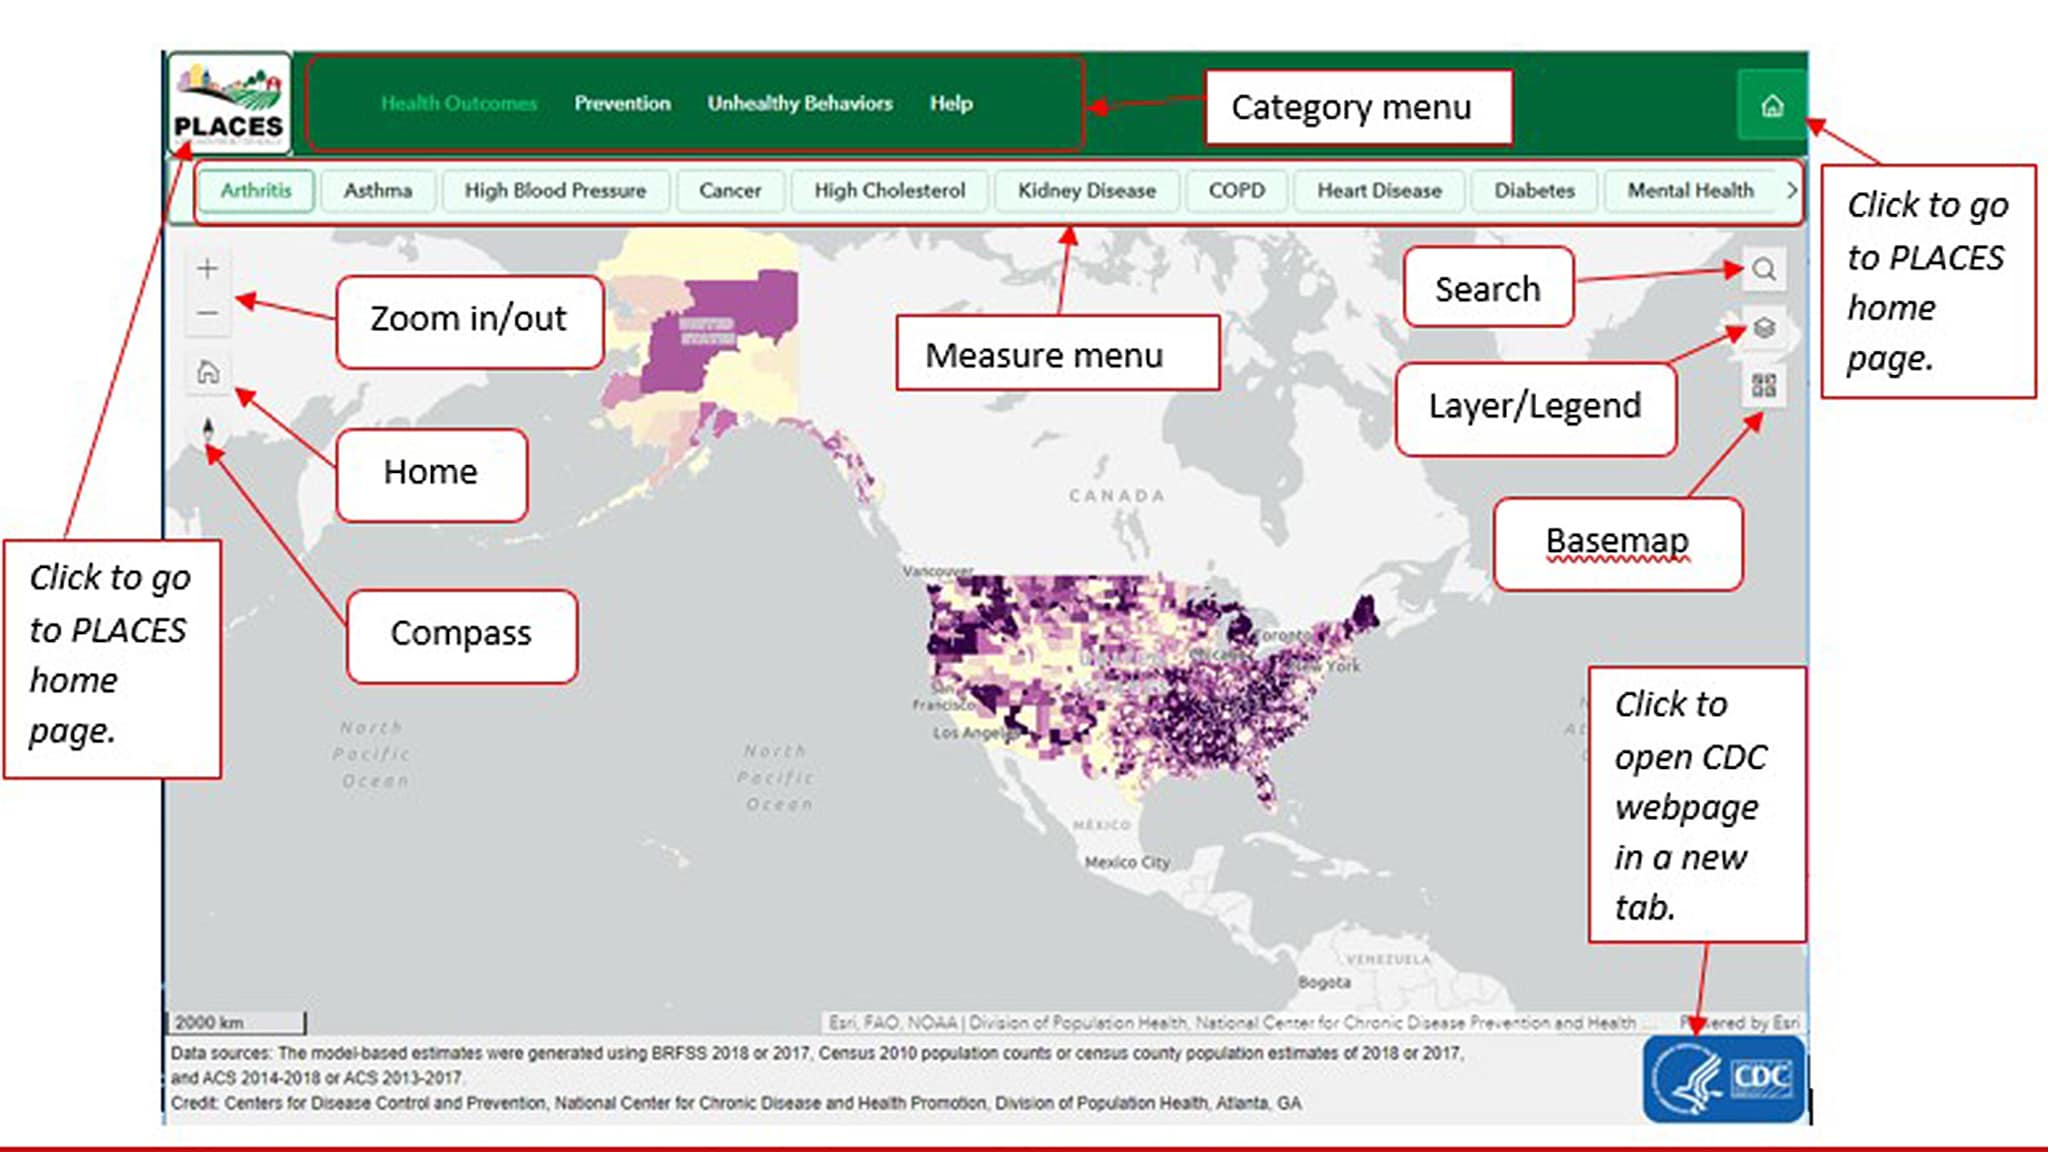
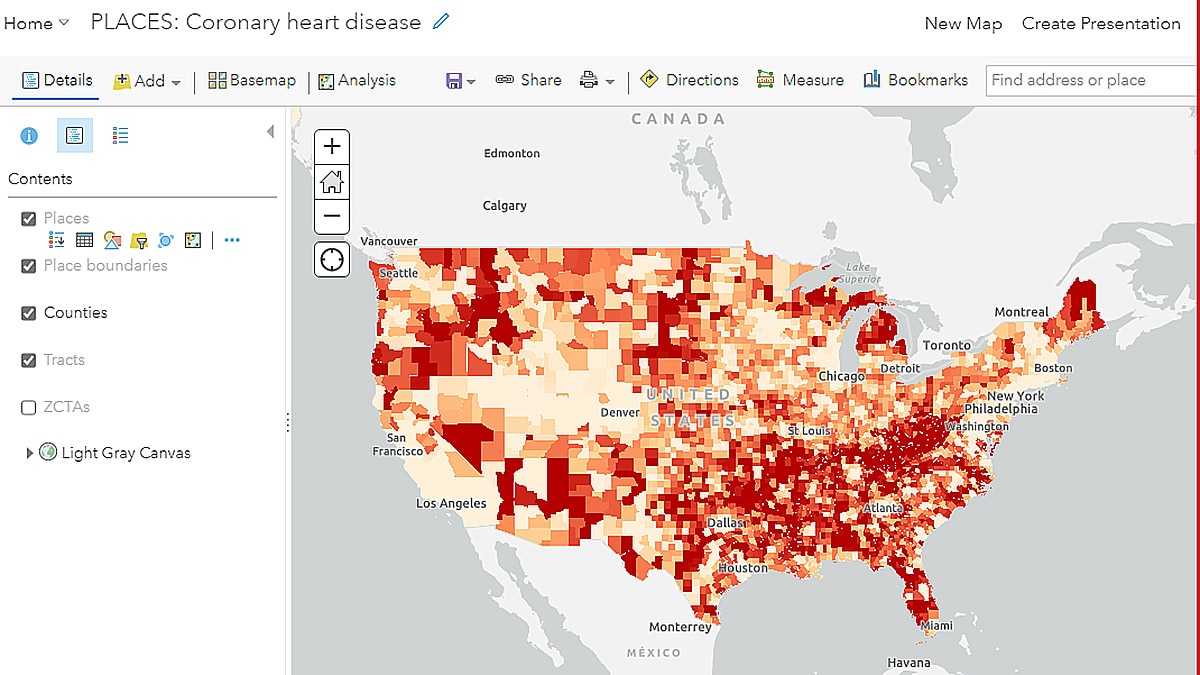
Home display
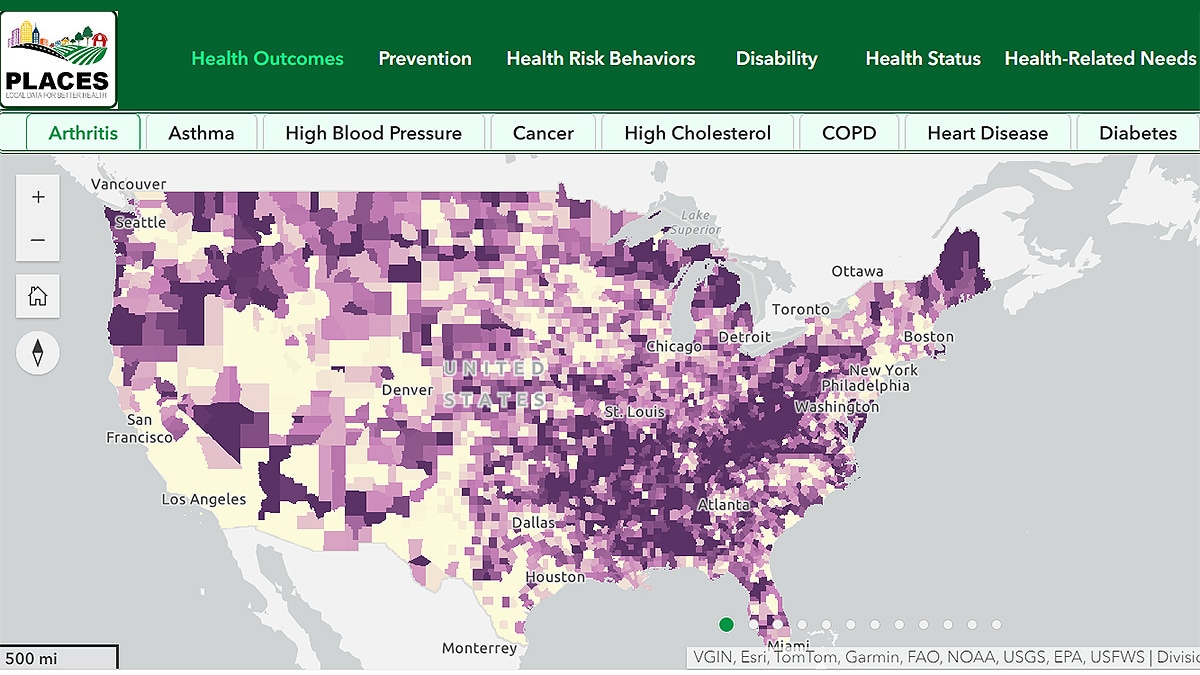
The home view on the PLACES Interactive Map defaults to the first category (Health Outcomes) and measure (Arthritis) displayed in the navigation menus at the top, at the country level (entire United States).
- The category and specific measure displayed are highlighted in green font on the top green navigation menus.
- At first, you will only see data for Counties displayed. You can zoom in to view more local levels.
Colors and boundaries
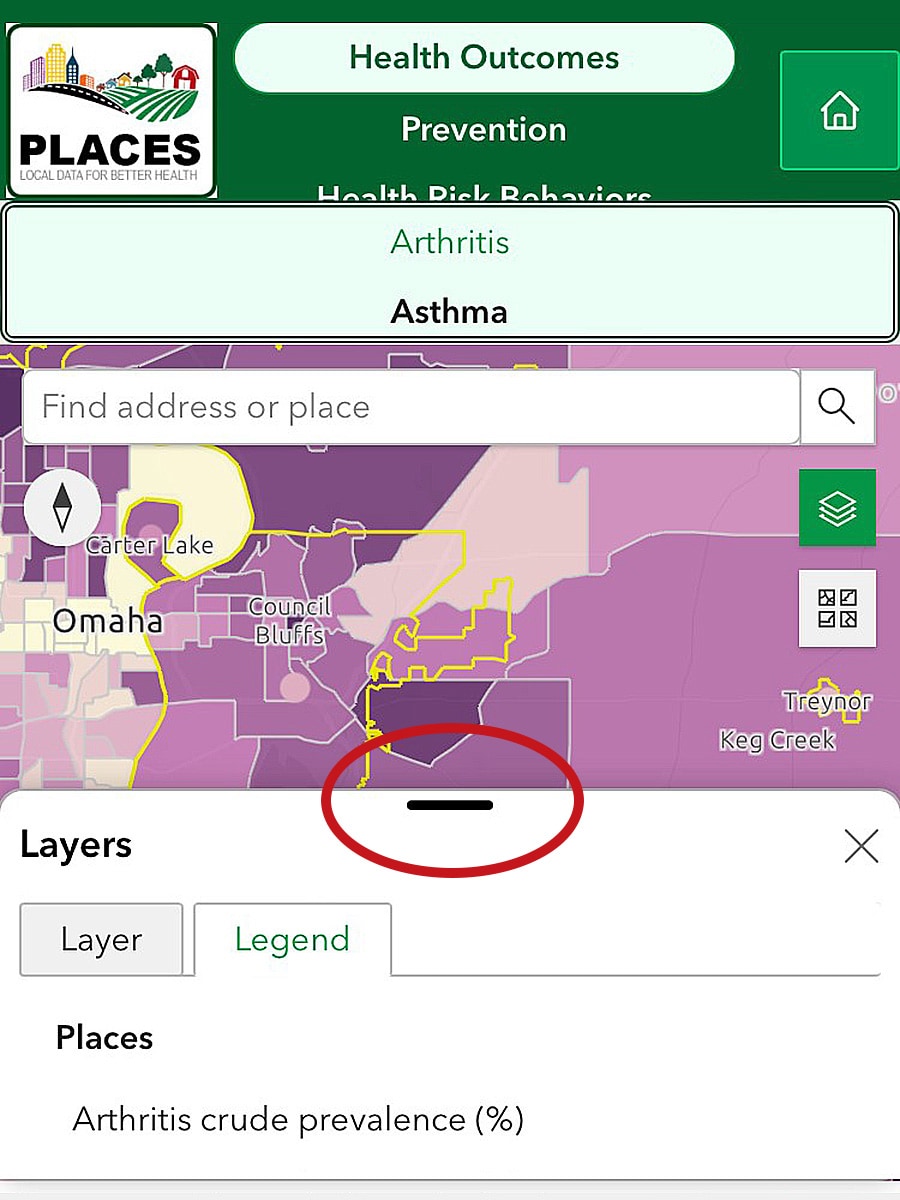
The colors and circles (boundaries) on the map reflect prevalence estimates.
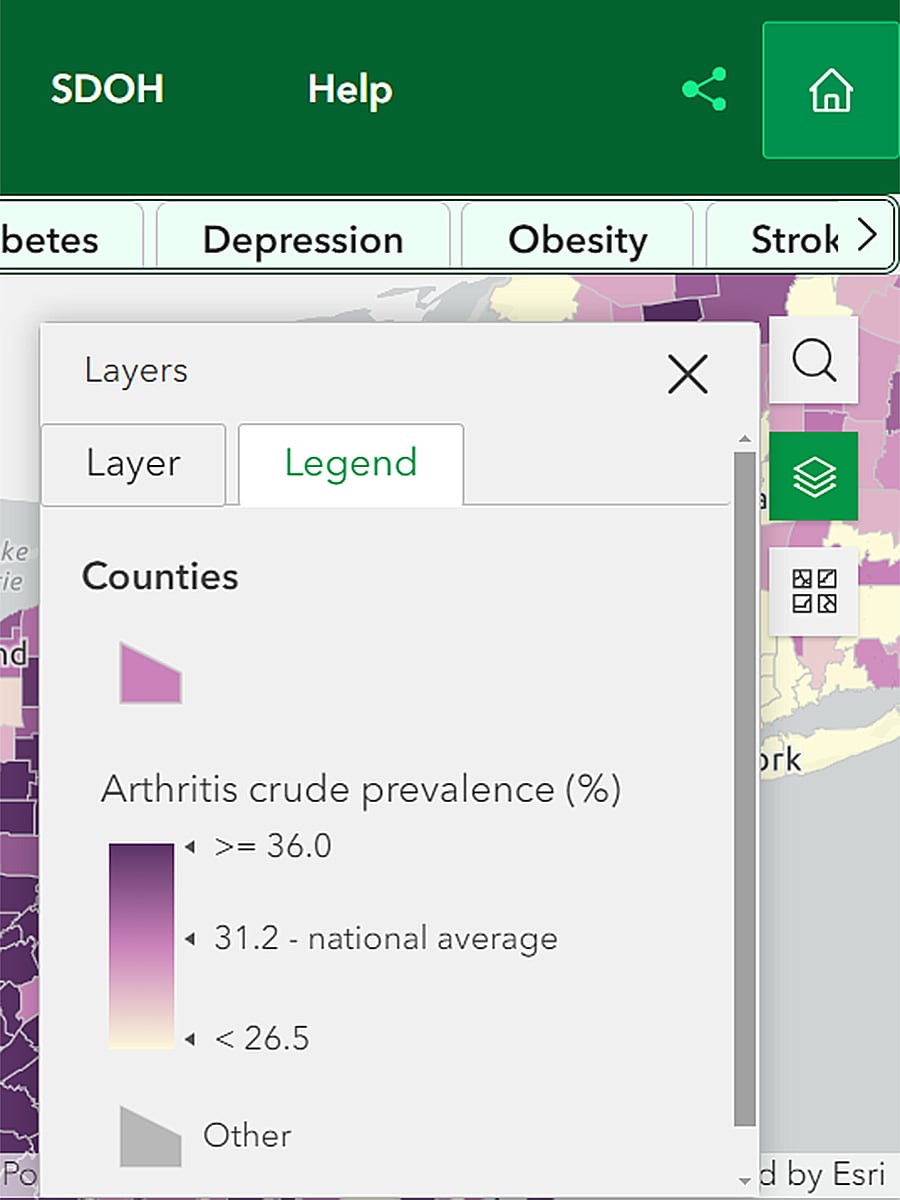
To check the prevalence estimates in your current map view, click the Layer/ legend button (stacked layers icon) in the upper right corner of the map, then click the Legend tab.
- The legend of prevalence estimates is the same for Counties, Tracts, and ZCTAs.
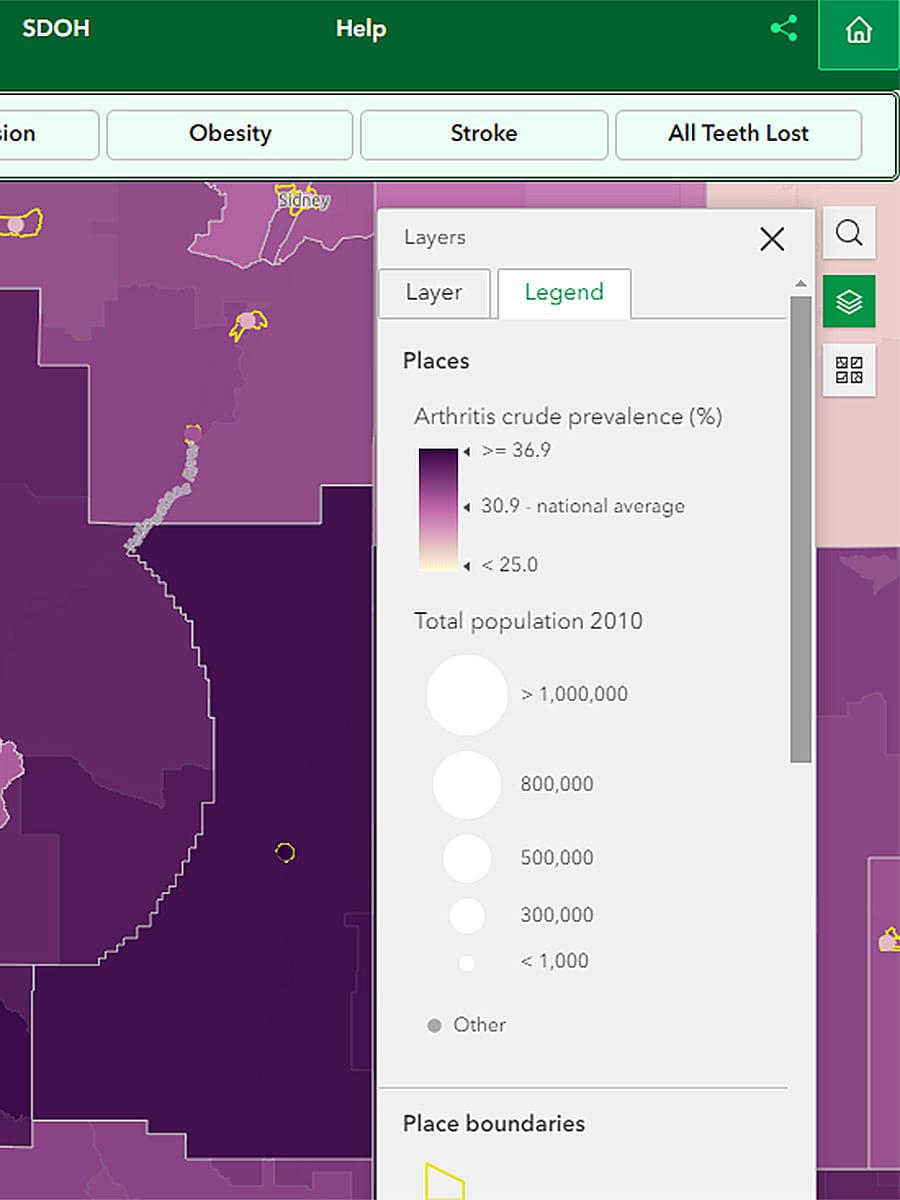
- For Places, the size of the circle is based on the total 2020 Census population.
- The Place boundary is shown in yellow.
Geographic levels
Maps are displayed in a "scale-dependent rendering."
- As you zoom in from the default view (county-level data), the Counties layer becomes hidden and the Tracts and ZCTA layers become visible.
- When you zoom further, the Places and Place boundaries become visible.
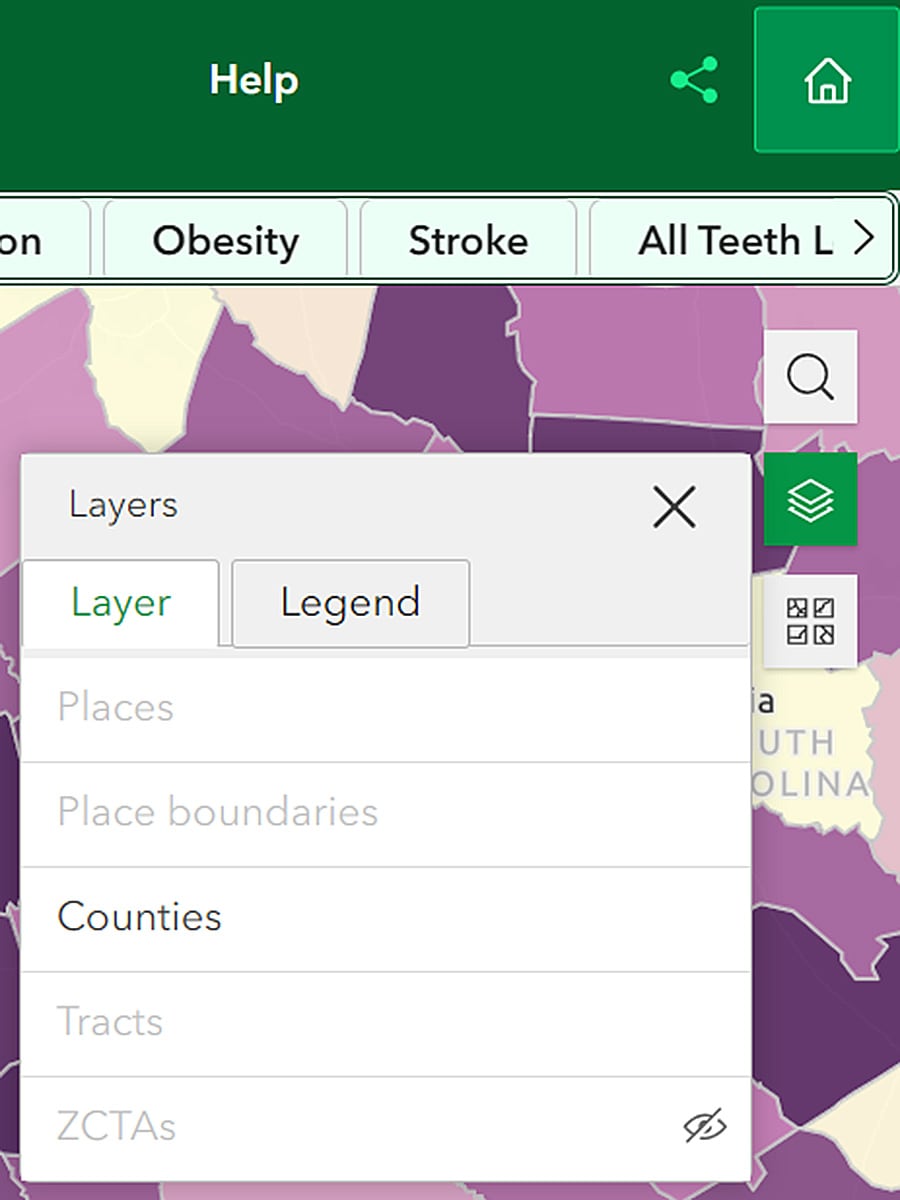
To check the geographic level in your current map view, click the Layer/legend button (stacked layers icon) in the upper right corner of the map, then click the Layer tab.
- Layers that appear in your current map view will display in black text.
- Layers that do not appear in your current map view will display in grey text.
To move the map around
There are two ways you can manipulate the map:
- Mouse: Click and hold your mouse on the map, then drag the mouse in the direction you want to move the map.
- Keyboard: Use the arrow keys on your keyboard to move in any direction.
To re-center the map
- Click the home button on the upper left side of the map to return to the full U.S. county map.
- Click the compass button on the upper left side of the map to reset the map orientation back to a north-to-south orientation.
Download or print
Data export and print functions in this map application are limited at this time. However:
- You can download and export PLACES data in a table format using CDC's PLACES data portal.
- You can print or export a PLACES map image by taking a screenshot of the map.
Navigating the map
To change geographic level view
You can change the geographic levels of your map view by zooming in/out or altering the geographic layers displayed in the Legend.
Zoom
To zoom in and out of a certain geographic level, you can:
- Mouse: Move the mouse wheel up to zoom in, and down to zoom out.
- Map buttons: Click the + or - buttons on the upper left part of the map to zoom in and out, respectively.
- Keyboard: Press the + key to zoom in and the – key to zoom out.
Having the Layer legend and tab open as you zoom in and out will display what geographic layer you are viewing.
Layer Legend
You can also use the Layer tab to alter the layers displayed.
- If you click on a layer that is currently visible in the Layer tab, it will become hidden.
- If you click on a layer that is currently not visible and not grey in the Layer tab, it will become visible
To search for a location
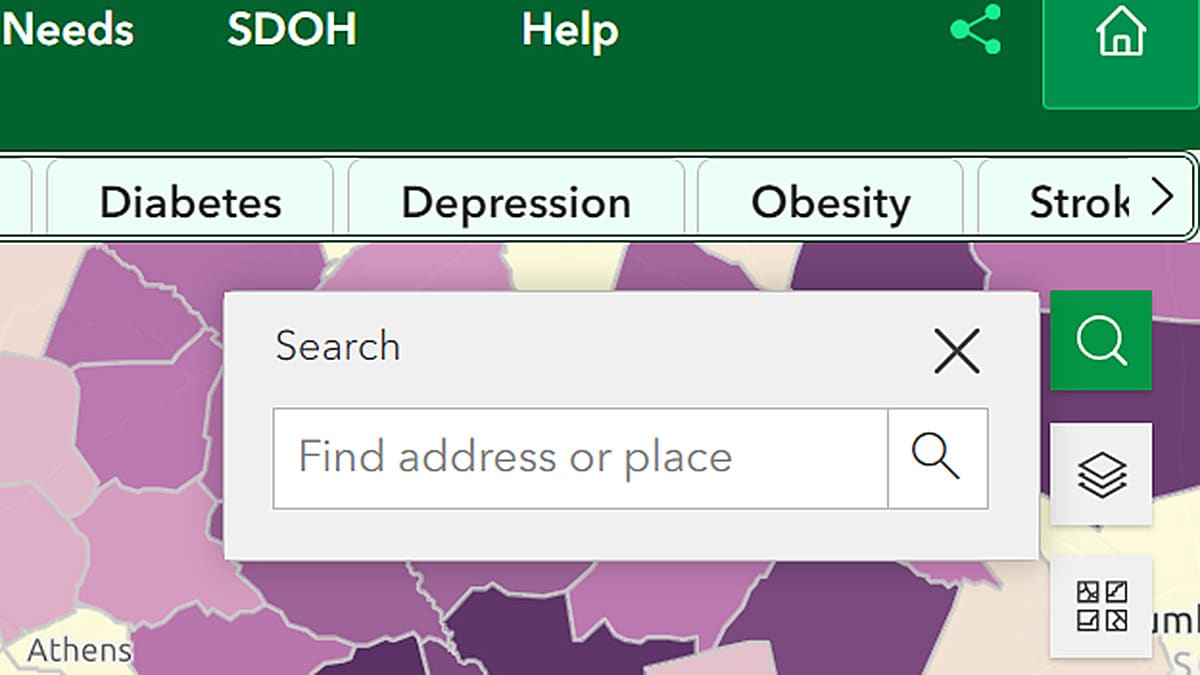
To view data for a specific location, use the search button in the top right of the map. To do so:
- Click on the search button (magnifying lens icon) and a search bar will pop up.
- Enter a place, zip code, or address into the text box and click enter to find a location.
- You can zoom in closer to that area.
Customizing data shown on map
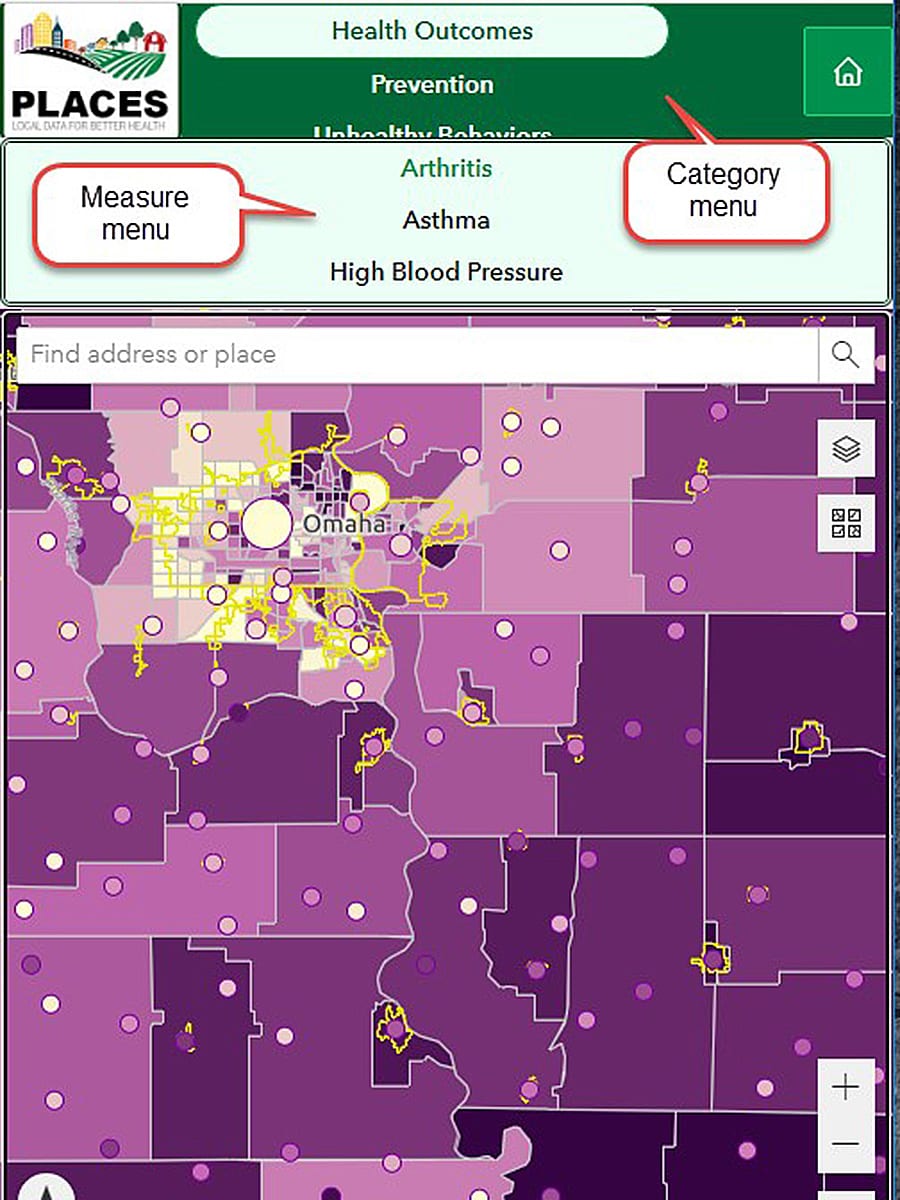
To view different data measures
The dark green menu at the top of the map allows you to switch between categories of measures.
The light green menu (below the category menu) allows you to switch between measures within a selected category.
- The category and specific measure you're in will display in green.
To change the category of measures you'd like to explore:
- Click on the desired category (dark green menu).
- The map will return to the full U.S. county map for that measure, defaulting to the first measure listed under that category of measures (on far left).
To change the measure you'd like to explore:
- To select a different measure, click on the measure of interest within that category.
- As you move from one measure to another within a category, the map will stay at the same geographic level you've selected.
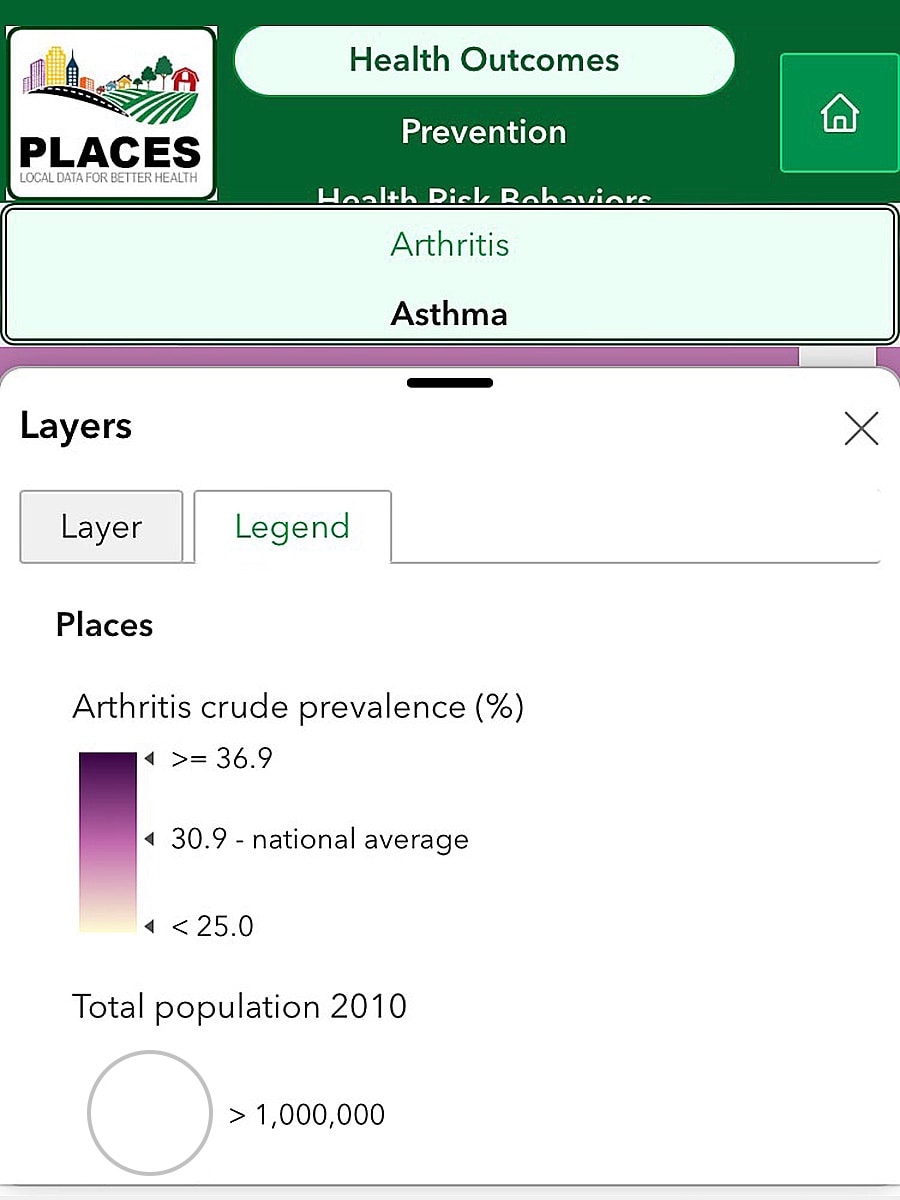
To view legend of prevalence estimates
Click the Legend tab to show the legend for the current visible layer on the map.
Map colors: For Counties, Tracts, and ZCTA levels, the same colors are used to reflect prevalence estimates.
Circles: For Places, the size of the circle is based on the total 2020 Census population. The color of the circles is based on the prevalence estimate.
Boundaries: Place boundaries are shown in yellow.
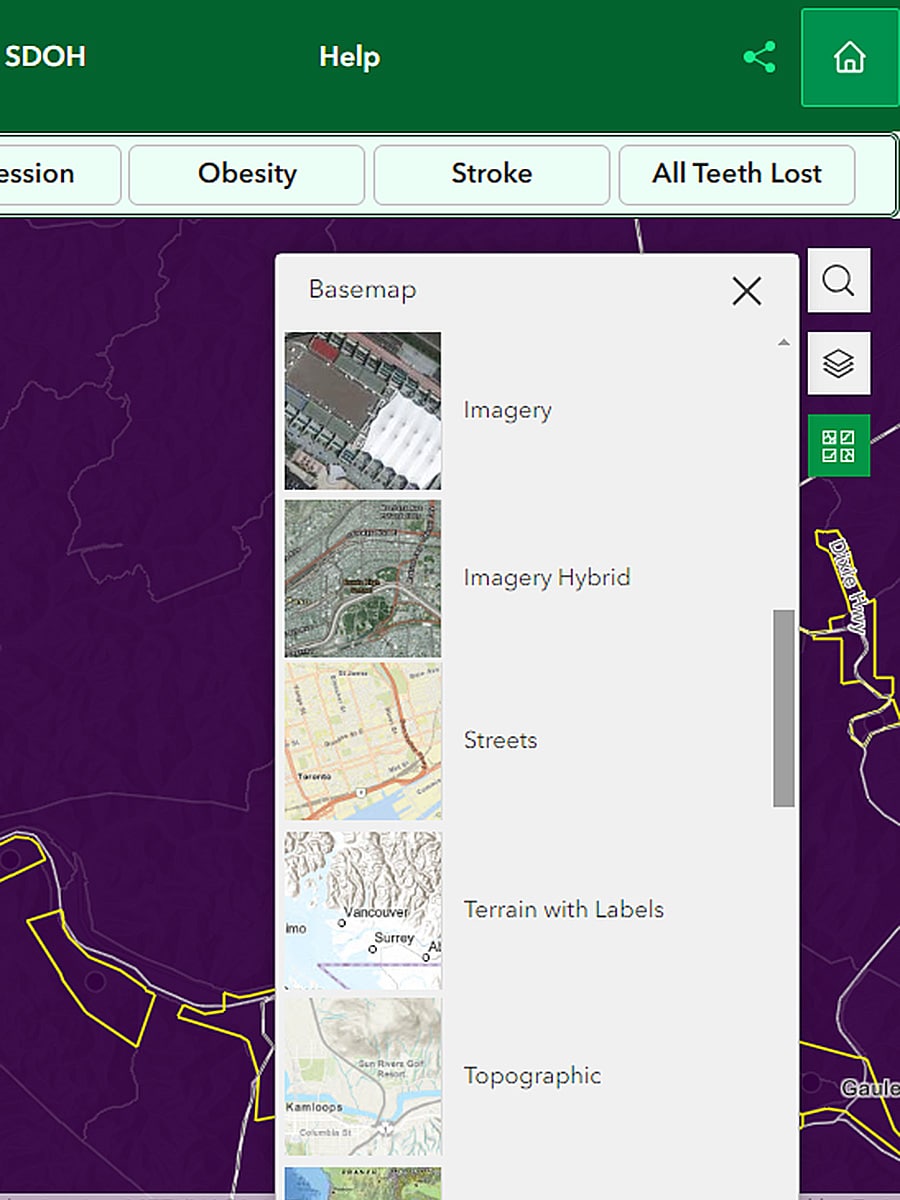
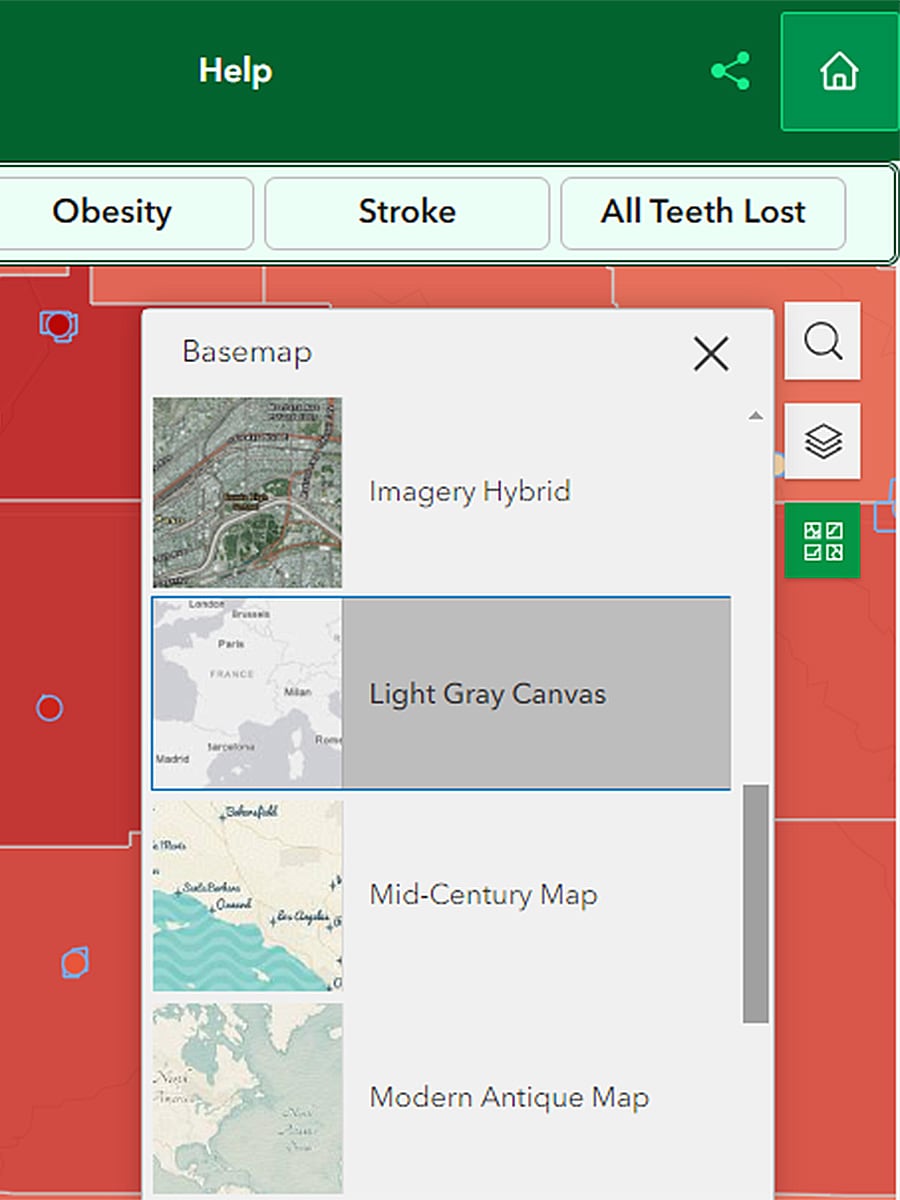
Basemap button
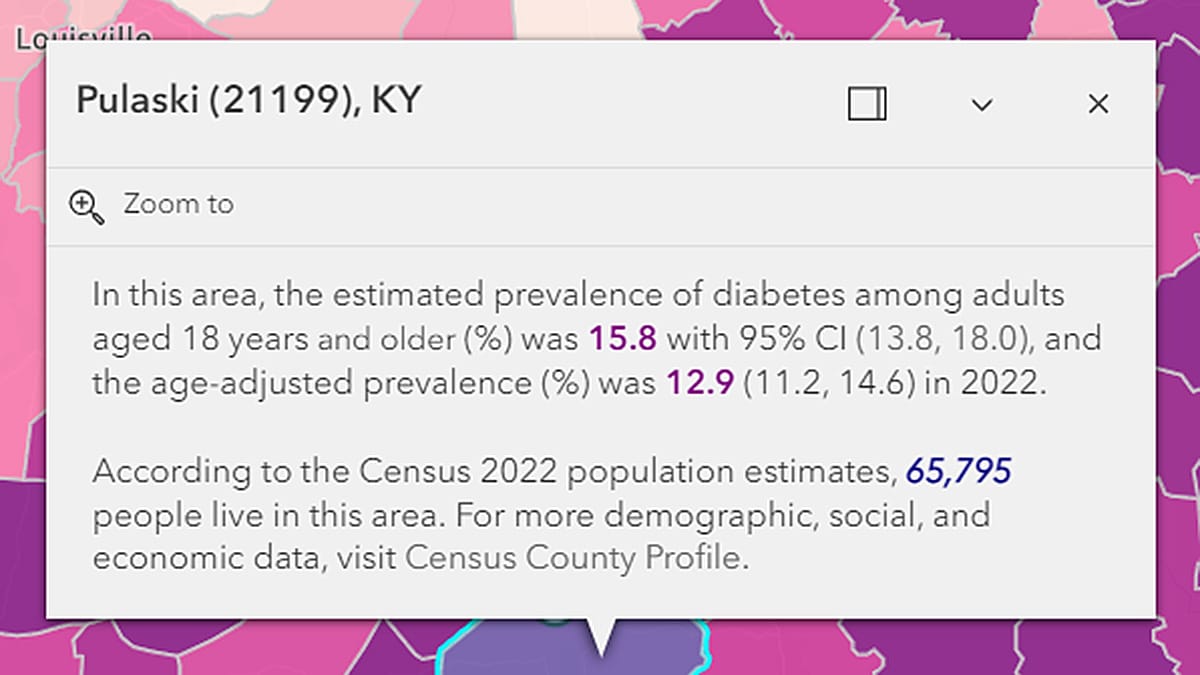
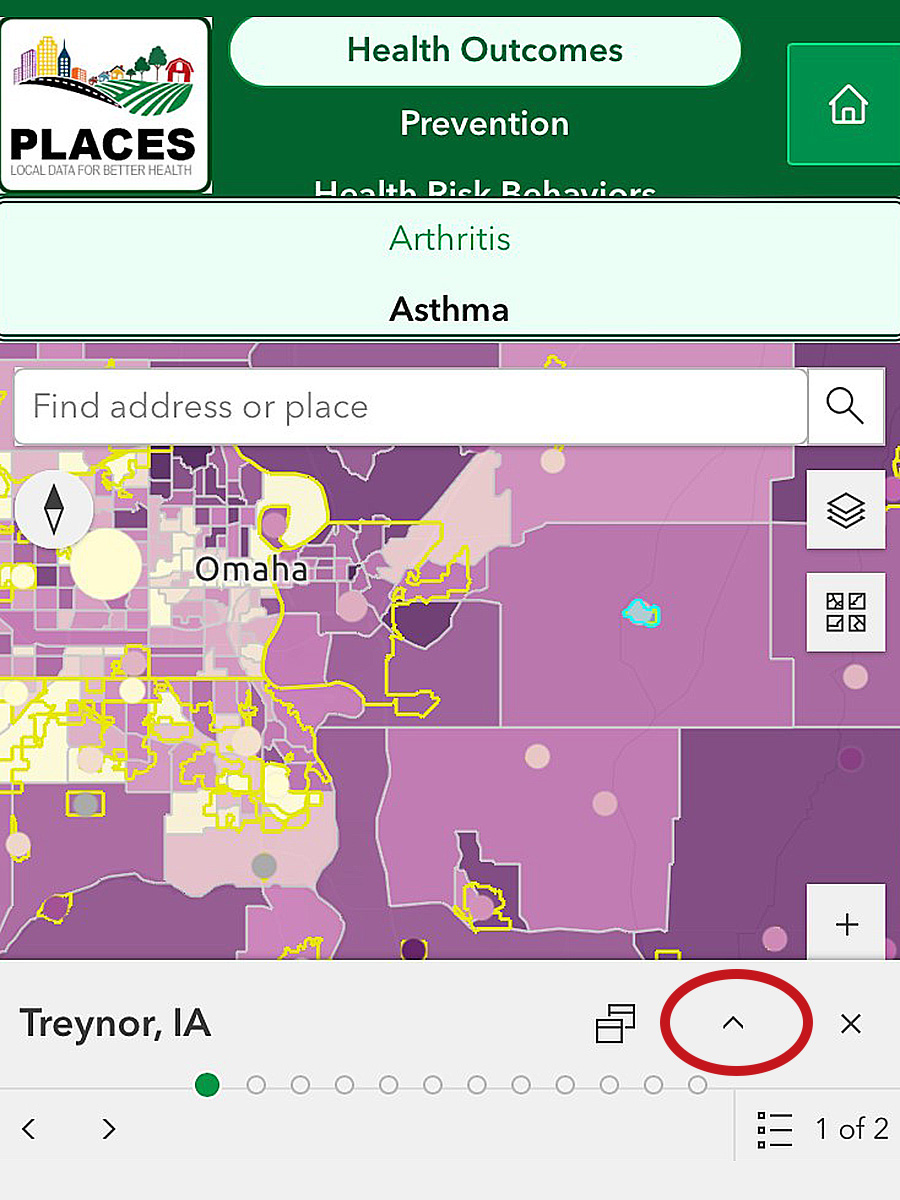
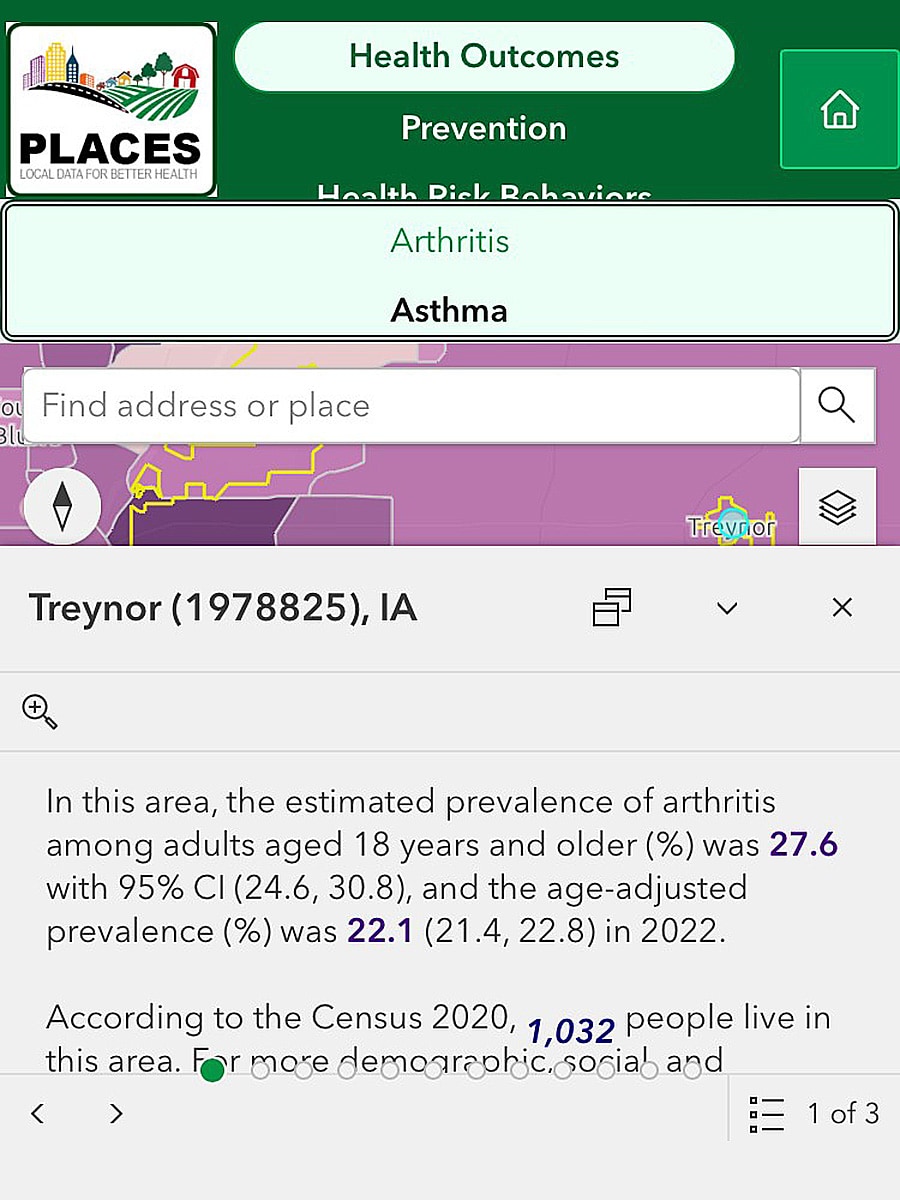
Click on map to see the estimates for that area.
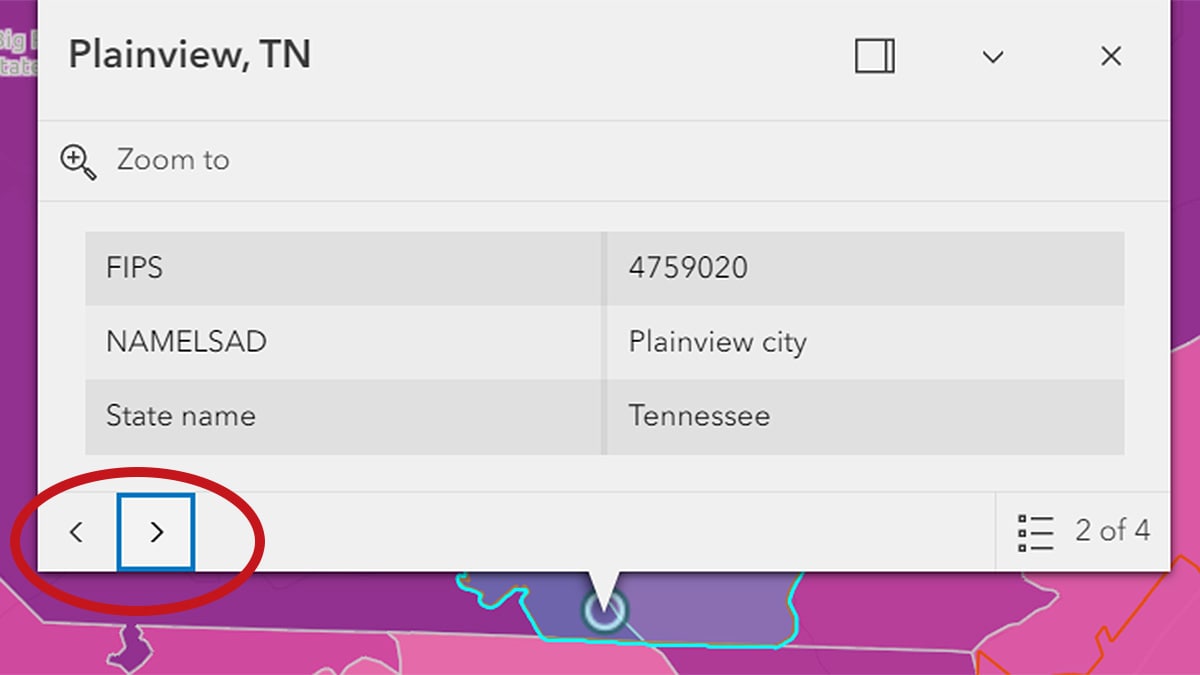
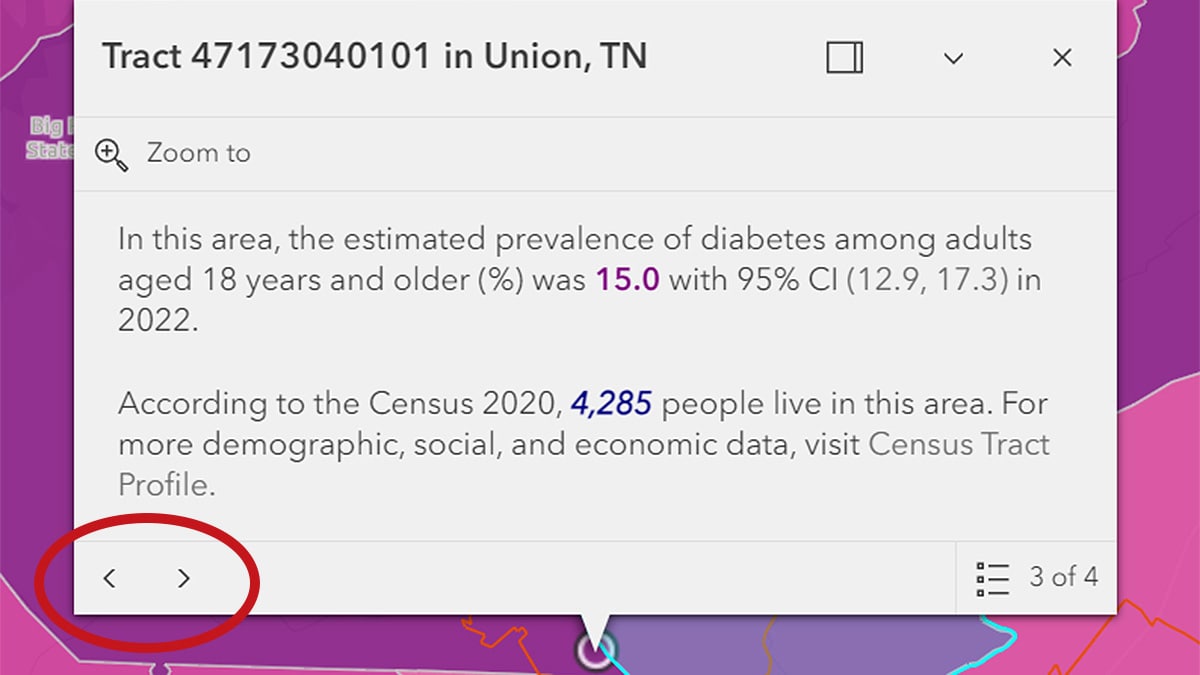
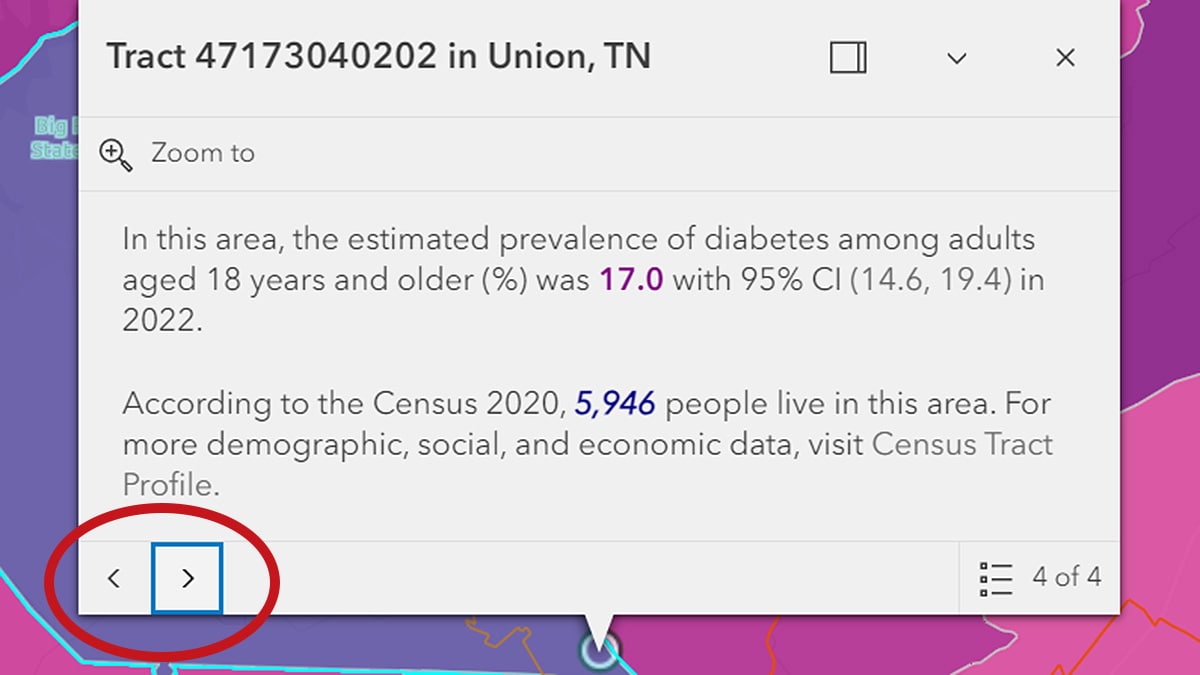
Once an area is clicked, a popup will display. Pop-ups display the estimate for the layer/layers visible on the map.
Advanced map customization
For those who want to customize maps, the service on ArcGIS Online is available to make maps online, or you can add data to your desktop GIS software.
To do this, go to PLACES ArcGIS Online repository. This will pull up all 40 individual web maps, which will allow you to:
- Zoom to your interested areas.
- Filter data.
- Use analysis tools.
- Overlay with other data available on the ArcGIS Living Atlas of the World (for example, American Community Survey social economic data).
- Overlay your own data.
- You can also save maps in your account for your organization's use.
For mobile use
The application is viewable on mobile devices with a few differences in layout. All tools are available.
If you need more information on how to use PLACES, please email us at places@cdc.gov.
Suggested Citation
PLACES. Centers for Disease Control and Prevention. Accessed [date]. https://www.cdc.gov/places