What to know
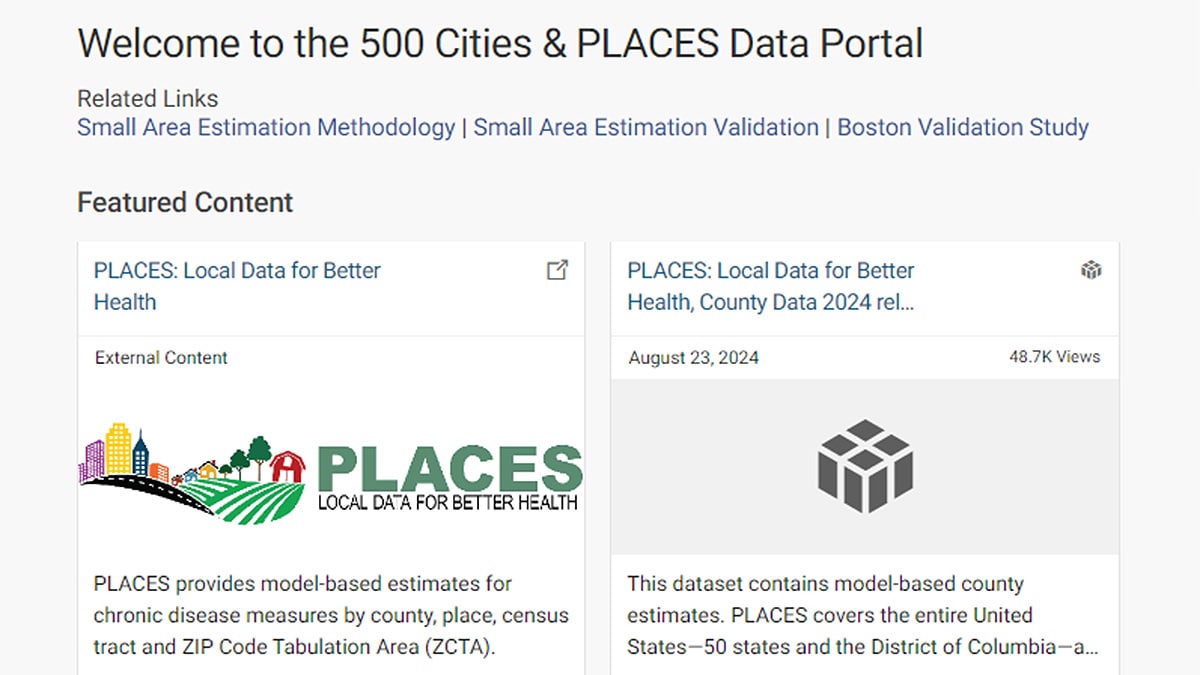
Overview
With each release, CDC makes PLACES datasets available in two formats (Open Data and GIS friendly) at four geographic levels. It is intended for users who want to explore detailed data in a table format, review subsets of data, download data based on their interests, and access data via API. This page explains how to use the portal.
PLACES data are available through the following websites:
Quick start Video Guides are also available.
Getting started
Accessing data on the PLACES data portal
To get started, you will need to select a geographic level and data format of interest.
There are two ways to access the current PLACES release data:
- In Open Data format by selecting County, Place, Census tract, or ZCTA level.
- Each row captures data for one measure for one geographic unit.
- Each row captures data for one measure for one geographic unit.
- In GIS-friendly format by selecting County-GIS, Place-GIS, Census tract-GIS, or ZCTA-GIS level.
- Each row captures data for all measures for one geographic unit.
- Each row captures data for all measures for one geographic unit.
The instructions below use county-level data in Open Data format as an example.
- To get started, click the County link to view the county dataset page.
About Tab
The Dataset page defaults to the About tab, which includes:
- About this Dataset: General information about the dataset.
- What's in this Dataset: The number of rows and columns in the dataset.
- Columns: Descriptions of each field in the dataset.
- Columns: Descriptions of each field in the dataset.
- Dataset Changelog: Lists changes made to this dataset.
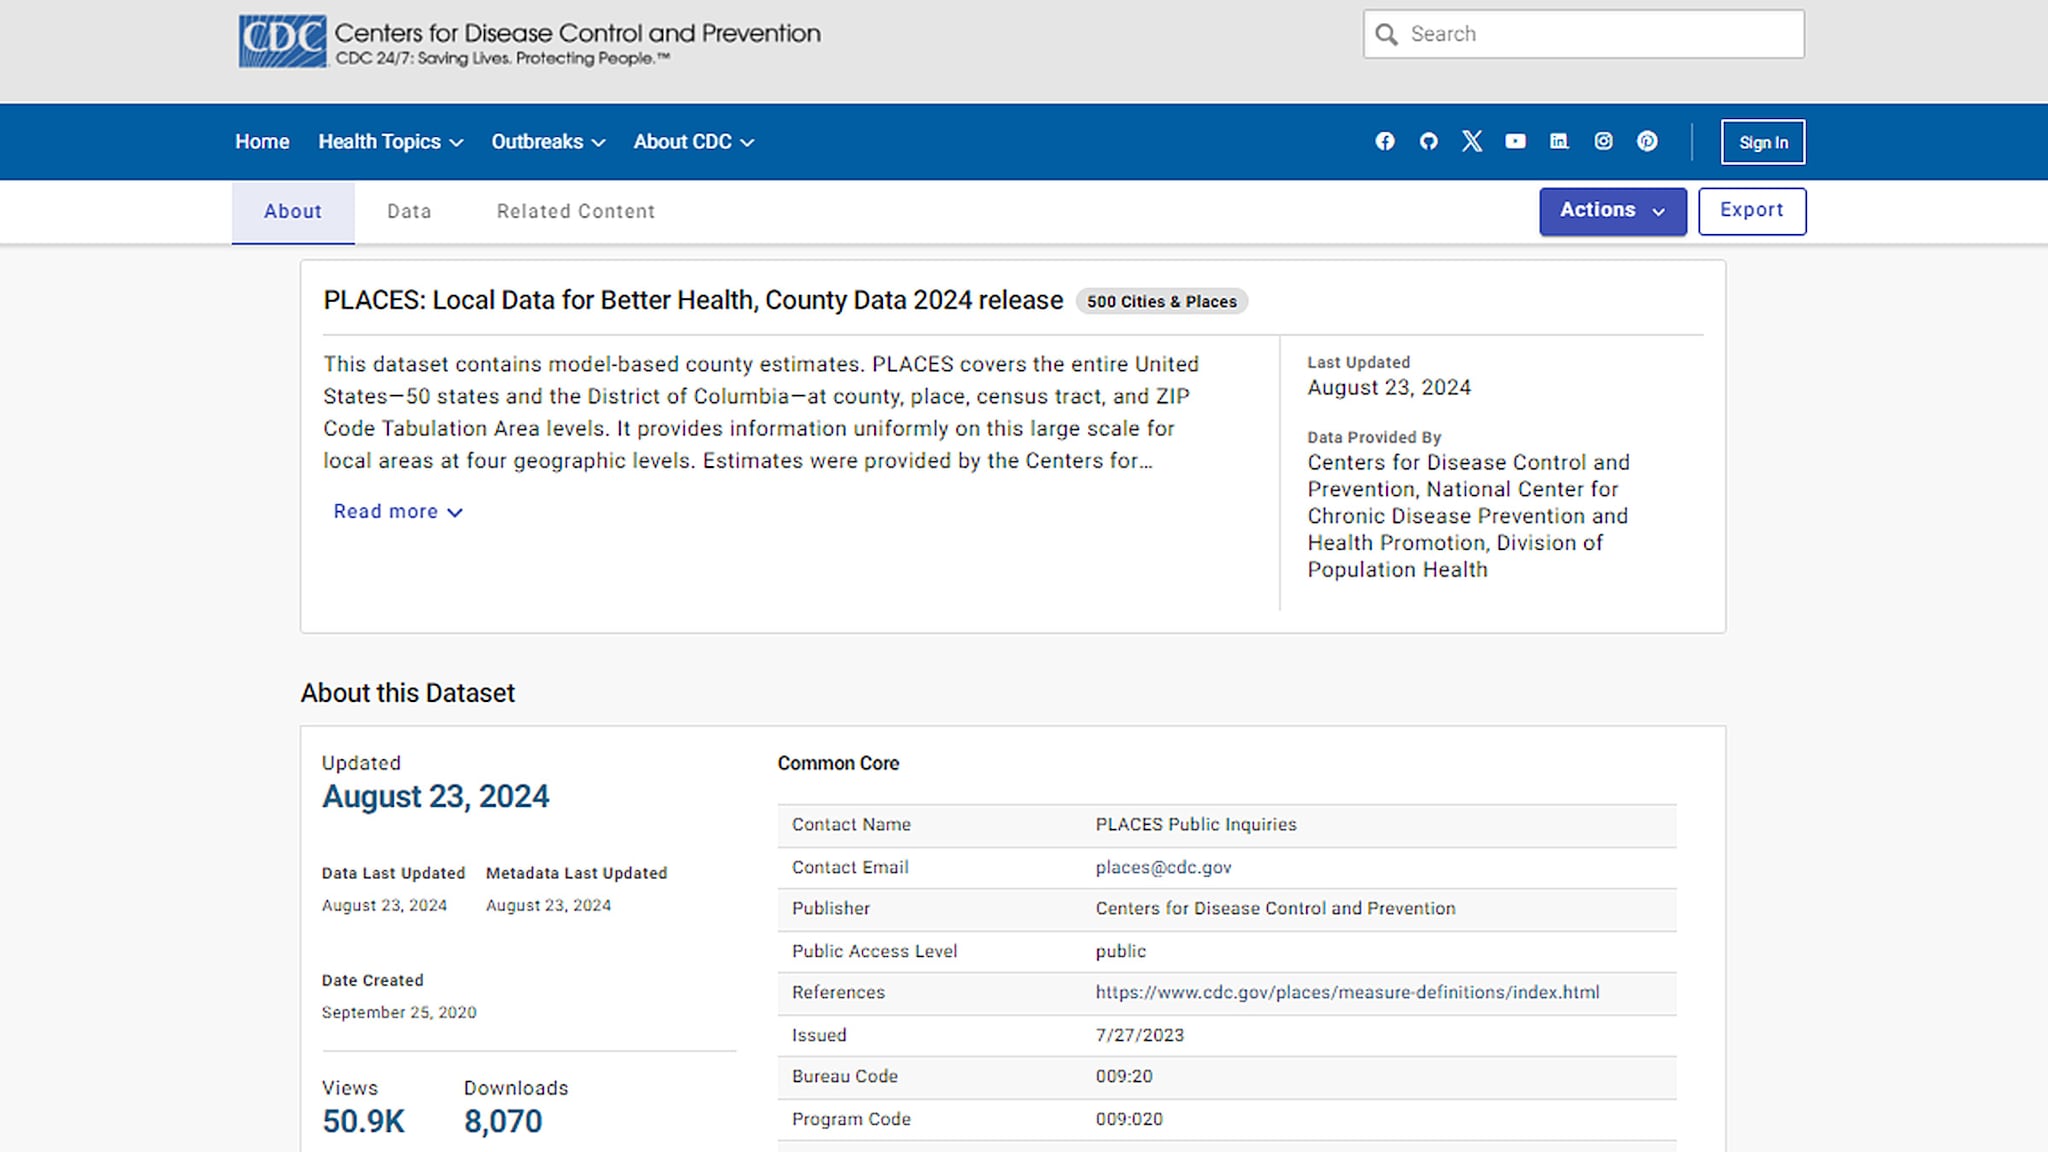
The (white) menu bar at top includes 3 tabs (on the left) and 2 buttons (on the right):
Tabs
- About: Default page when you click a dataset in the portal.
- Data: Provides table view of the dataset.
- Related Content: Provides items used this dataset, such as graph, filtered view, and chart.
Buttons
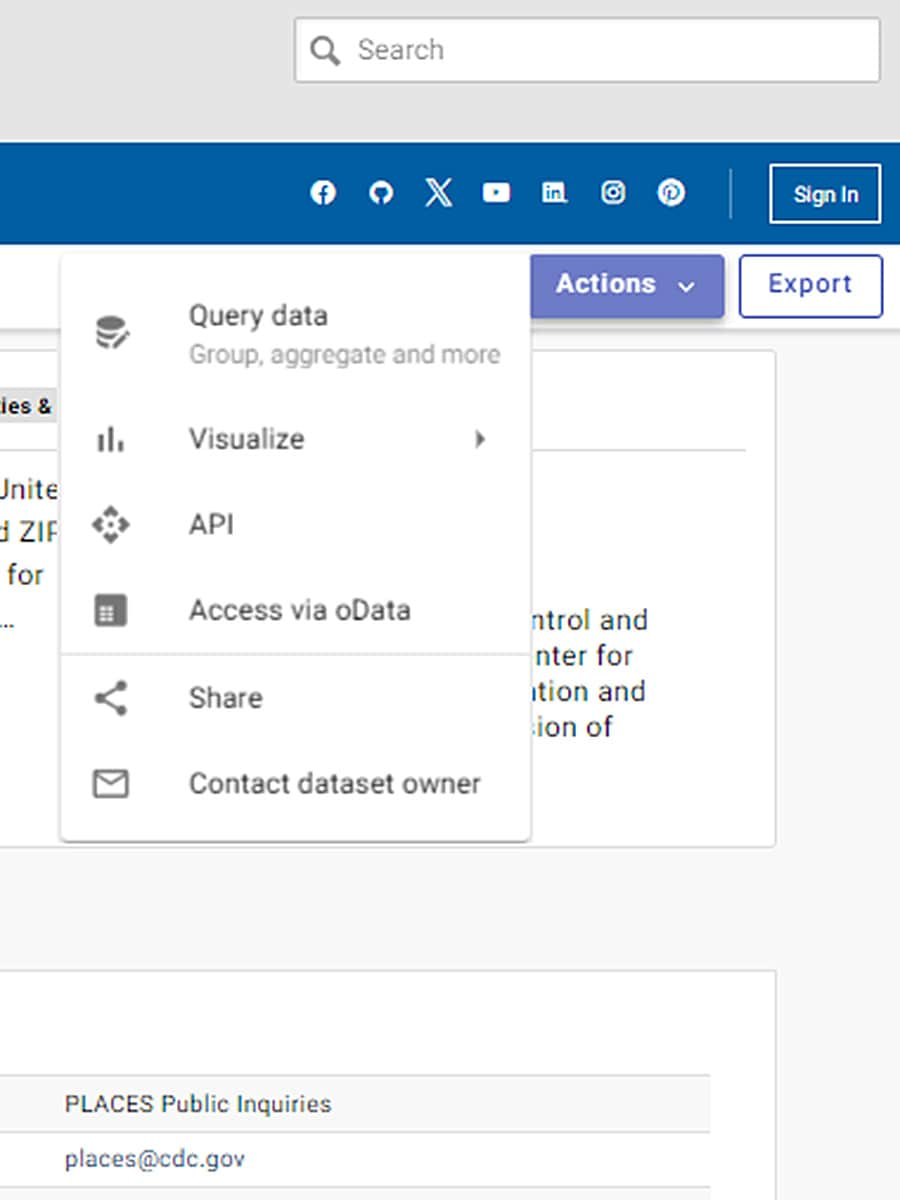
- Actions: Provides a drop-down menu of options for using the data:
- Query Data
- Visualize
- API
- Access via OData
- Share
- Contact dataset owner
- Query Data
- Export: You can click this button to export the entire dataset in your format of choice, such as JSON, GeoJSON, and CSV.
Each of these tabs and buttons are reviewed in detail below:
Data Tab: View data in table
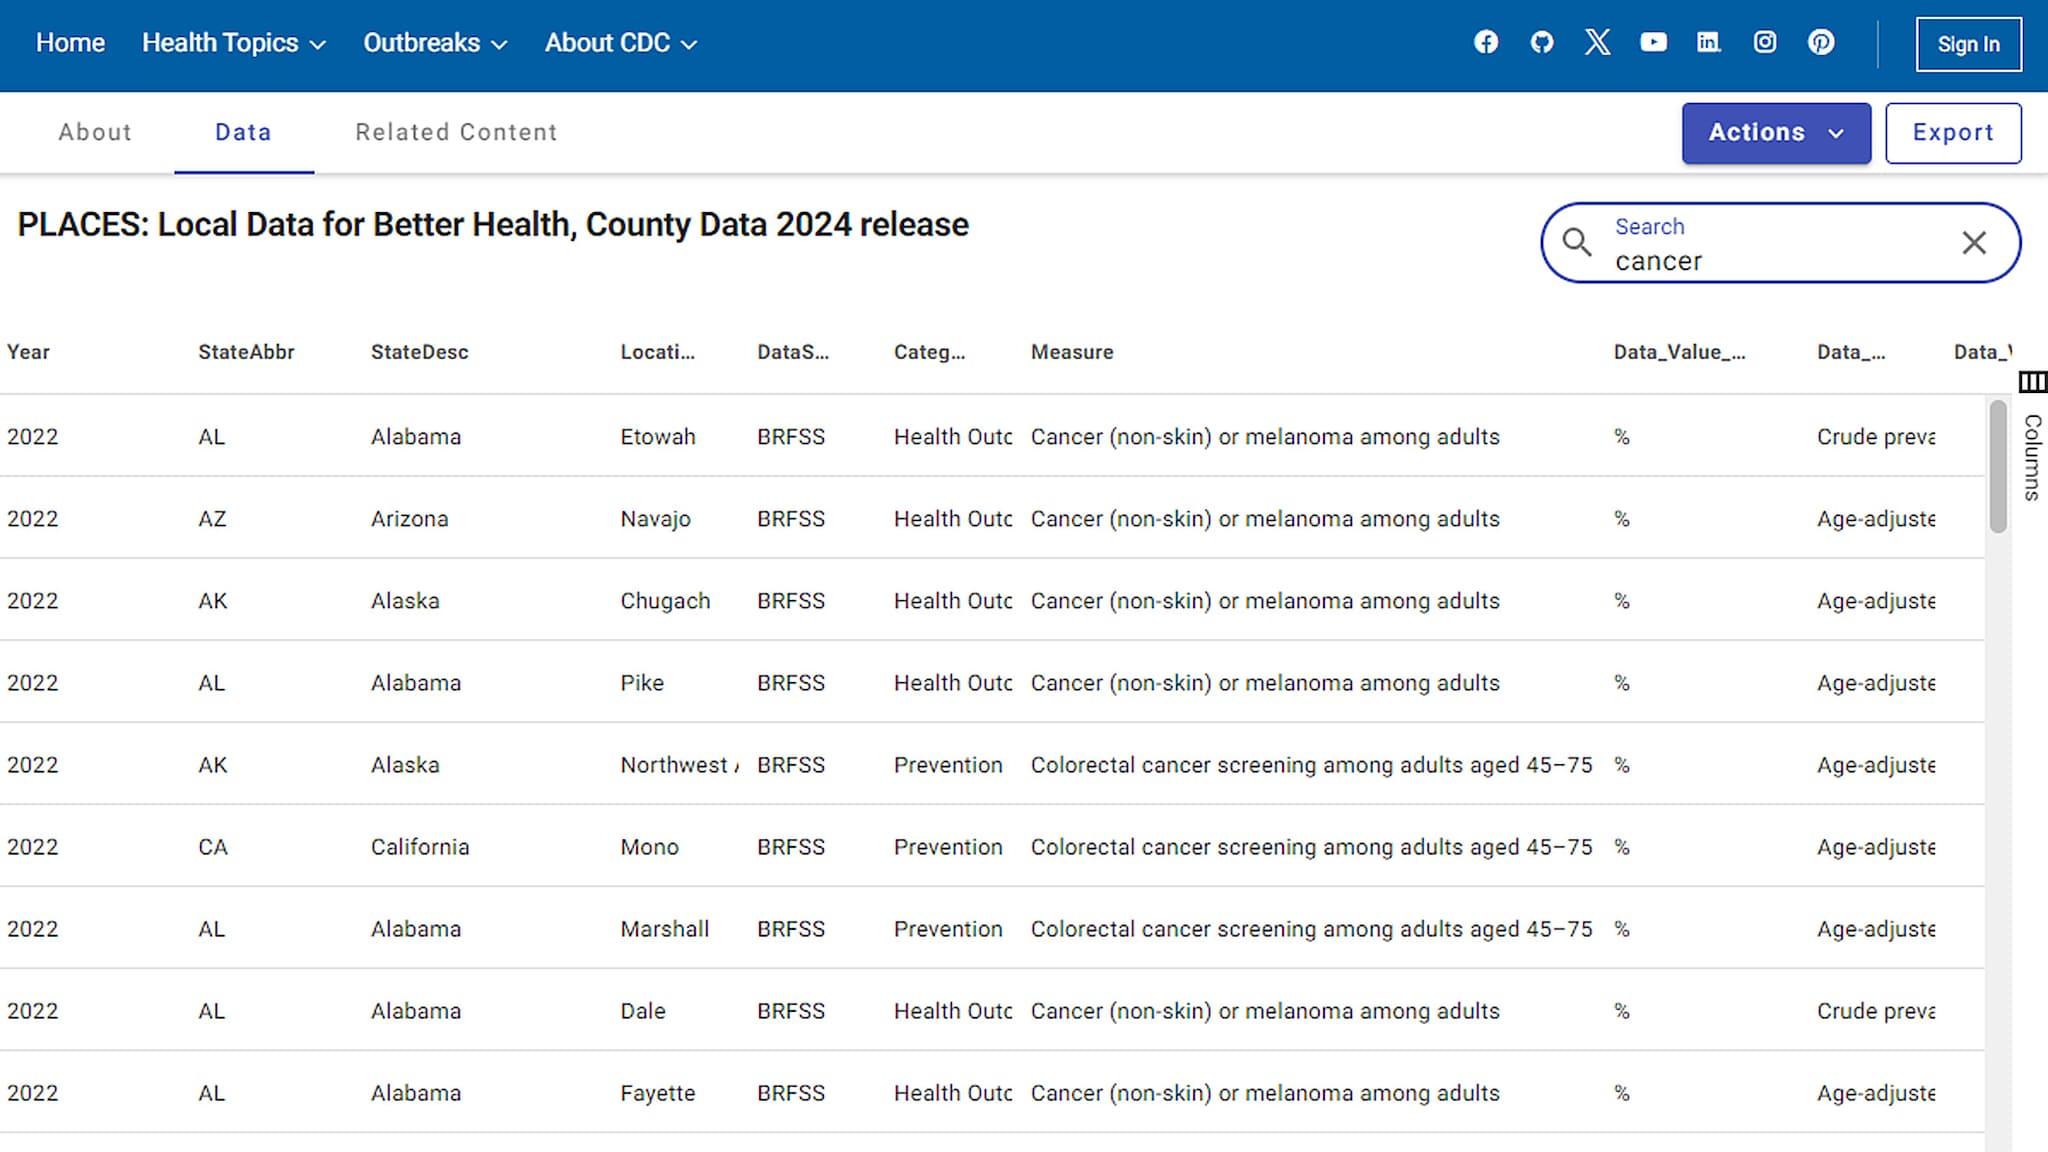
When you click the Data tab on the menu bar, the data displays in a table view.
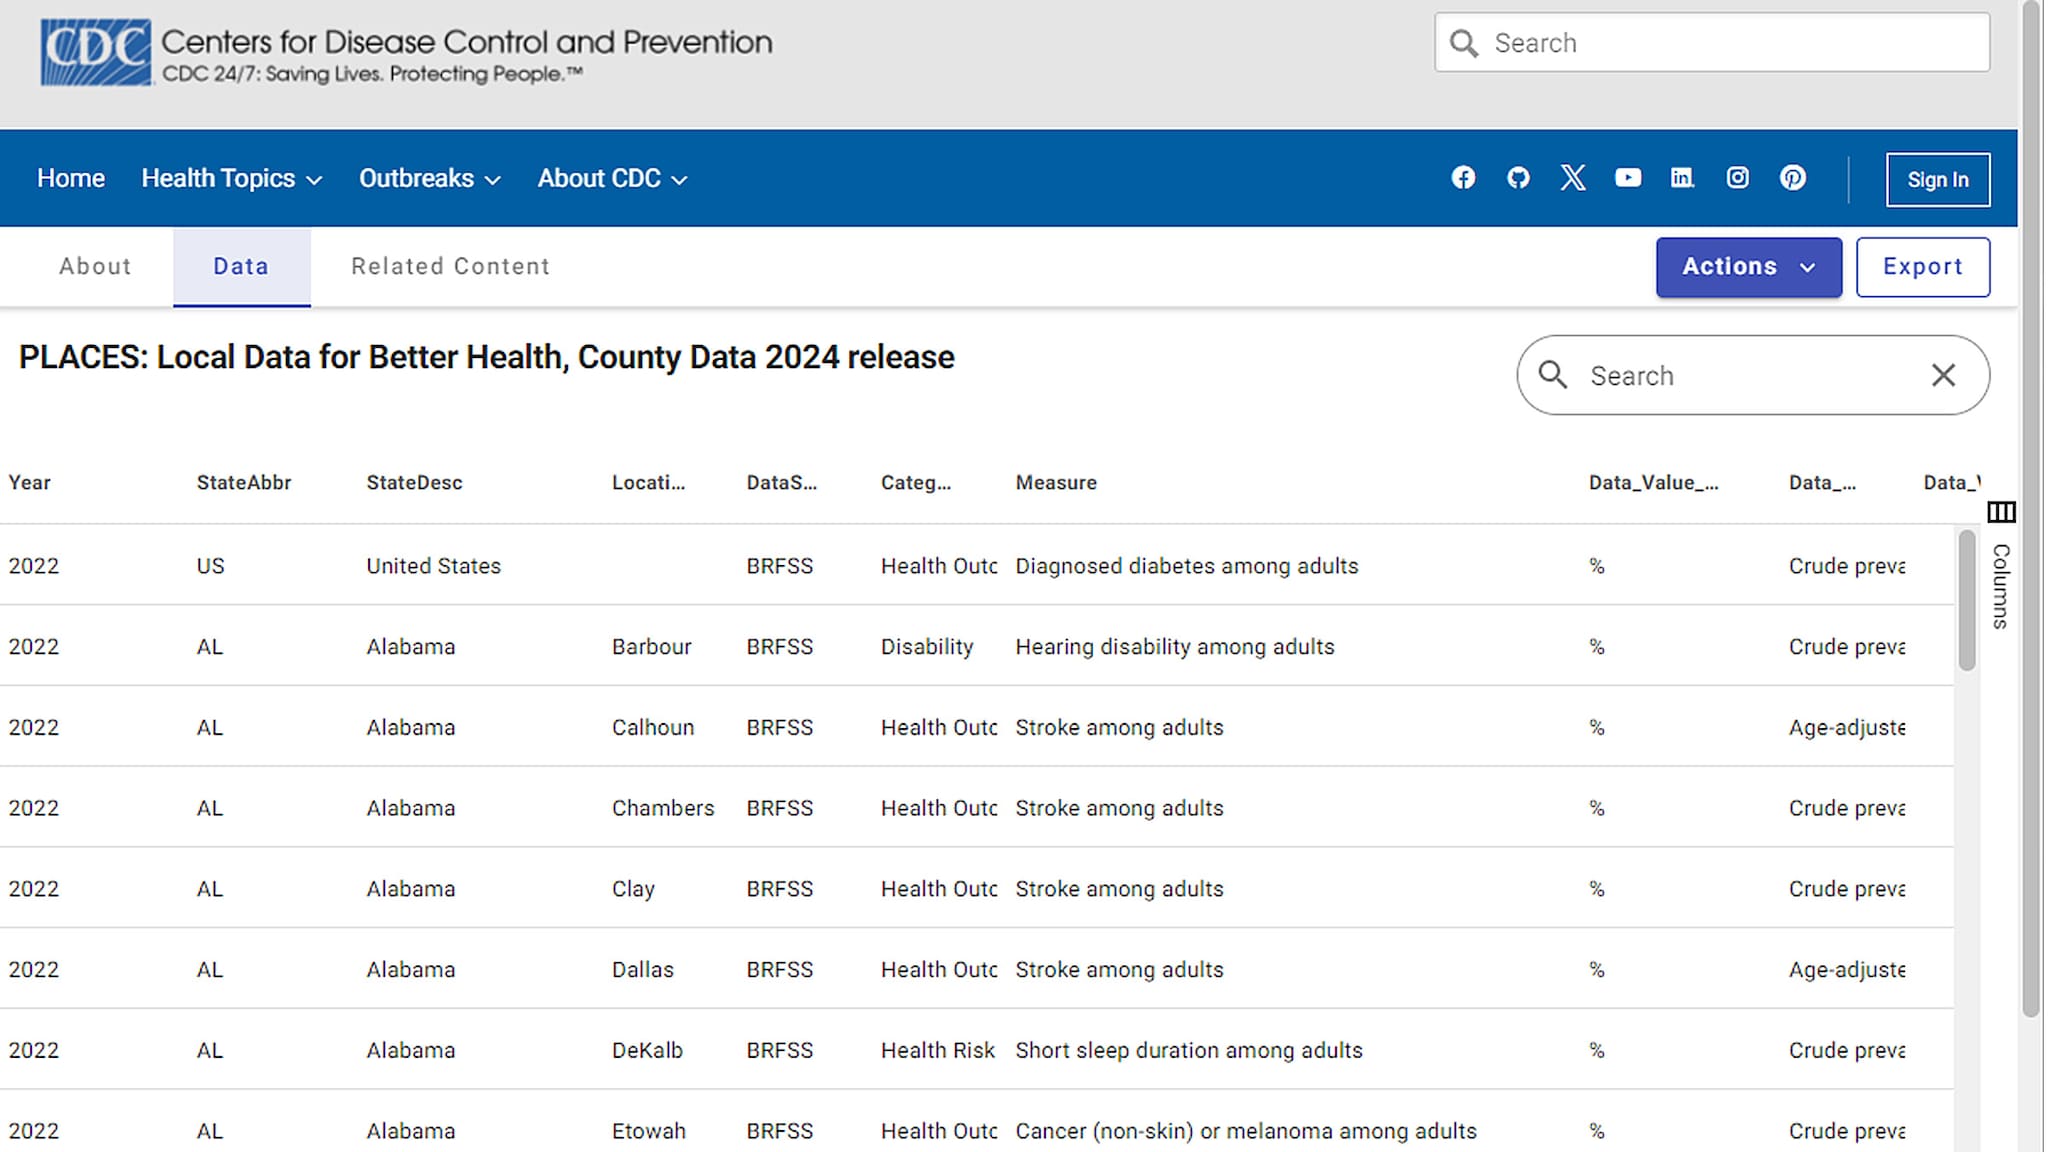
When you type a key word in the search box, the related estimates will display in the table (e.g. Cancer). You can export this search result to a CSV file or other format of your chose.
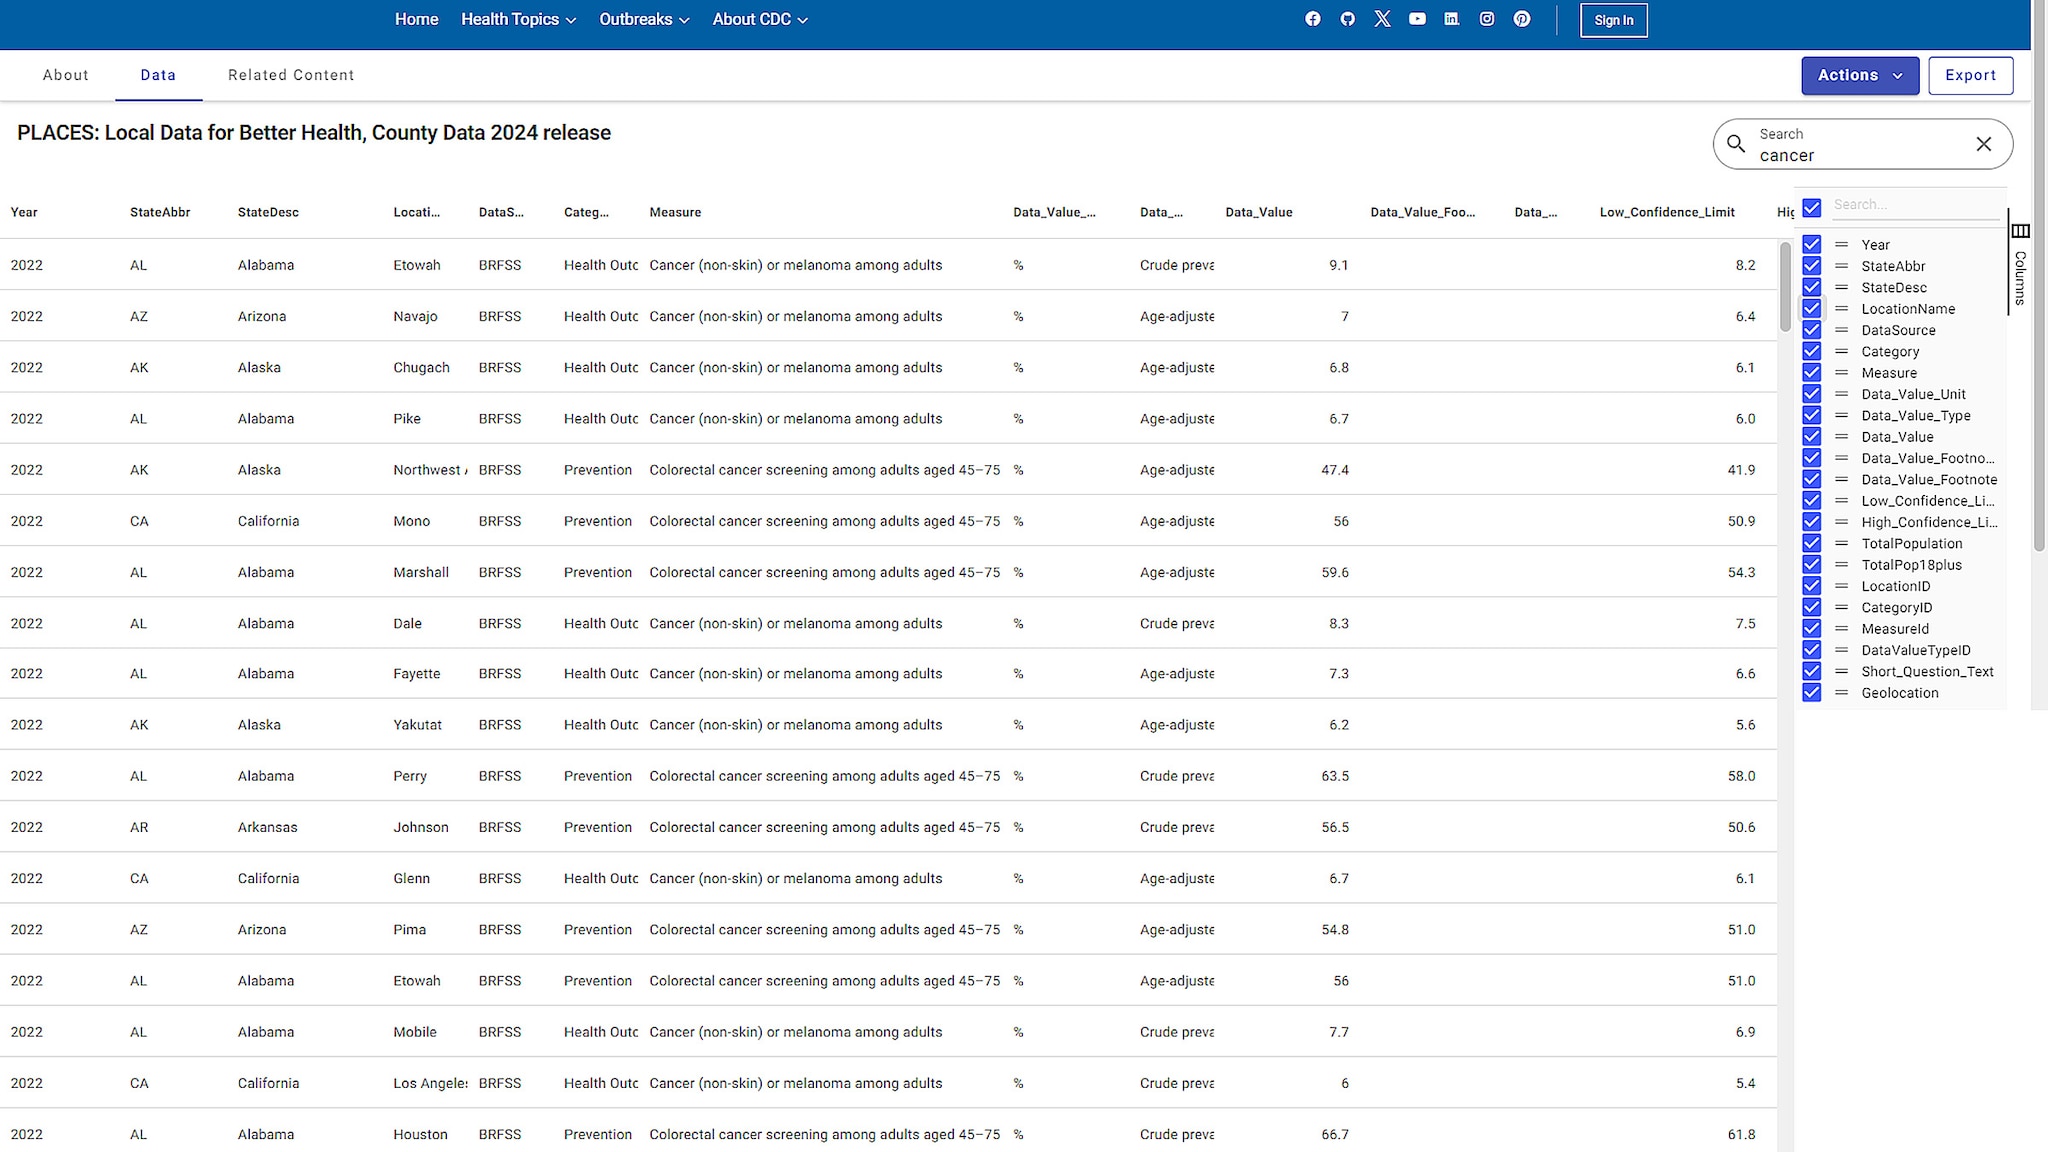
Adjust columns displayed in the table
You can adjust what columns are displayed in the table view by checking or unchecking the column headings.
Action Buttons
Query data
You can filter data by geographic location and/or measures by clicking the Query data option in the Actions drop-down menu.
- Your query result can be exported and saved online if you have signed up for an account with data.cdc.gov.
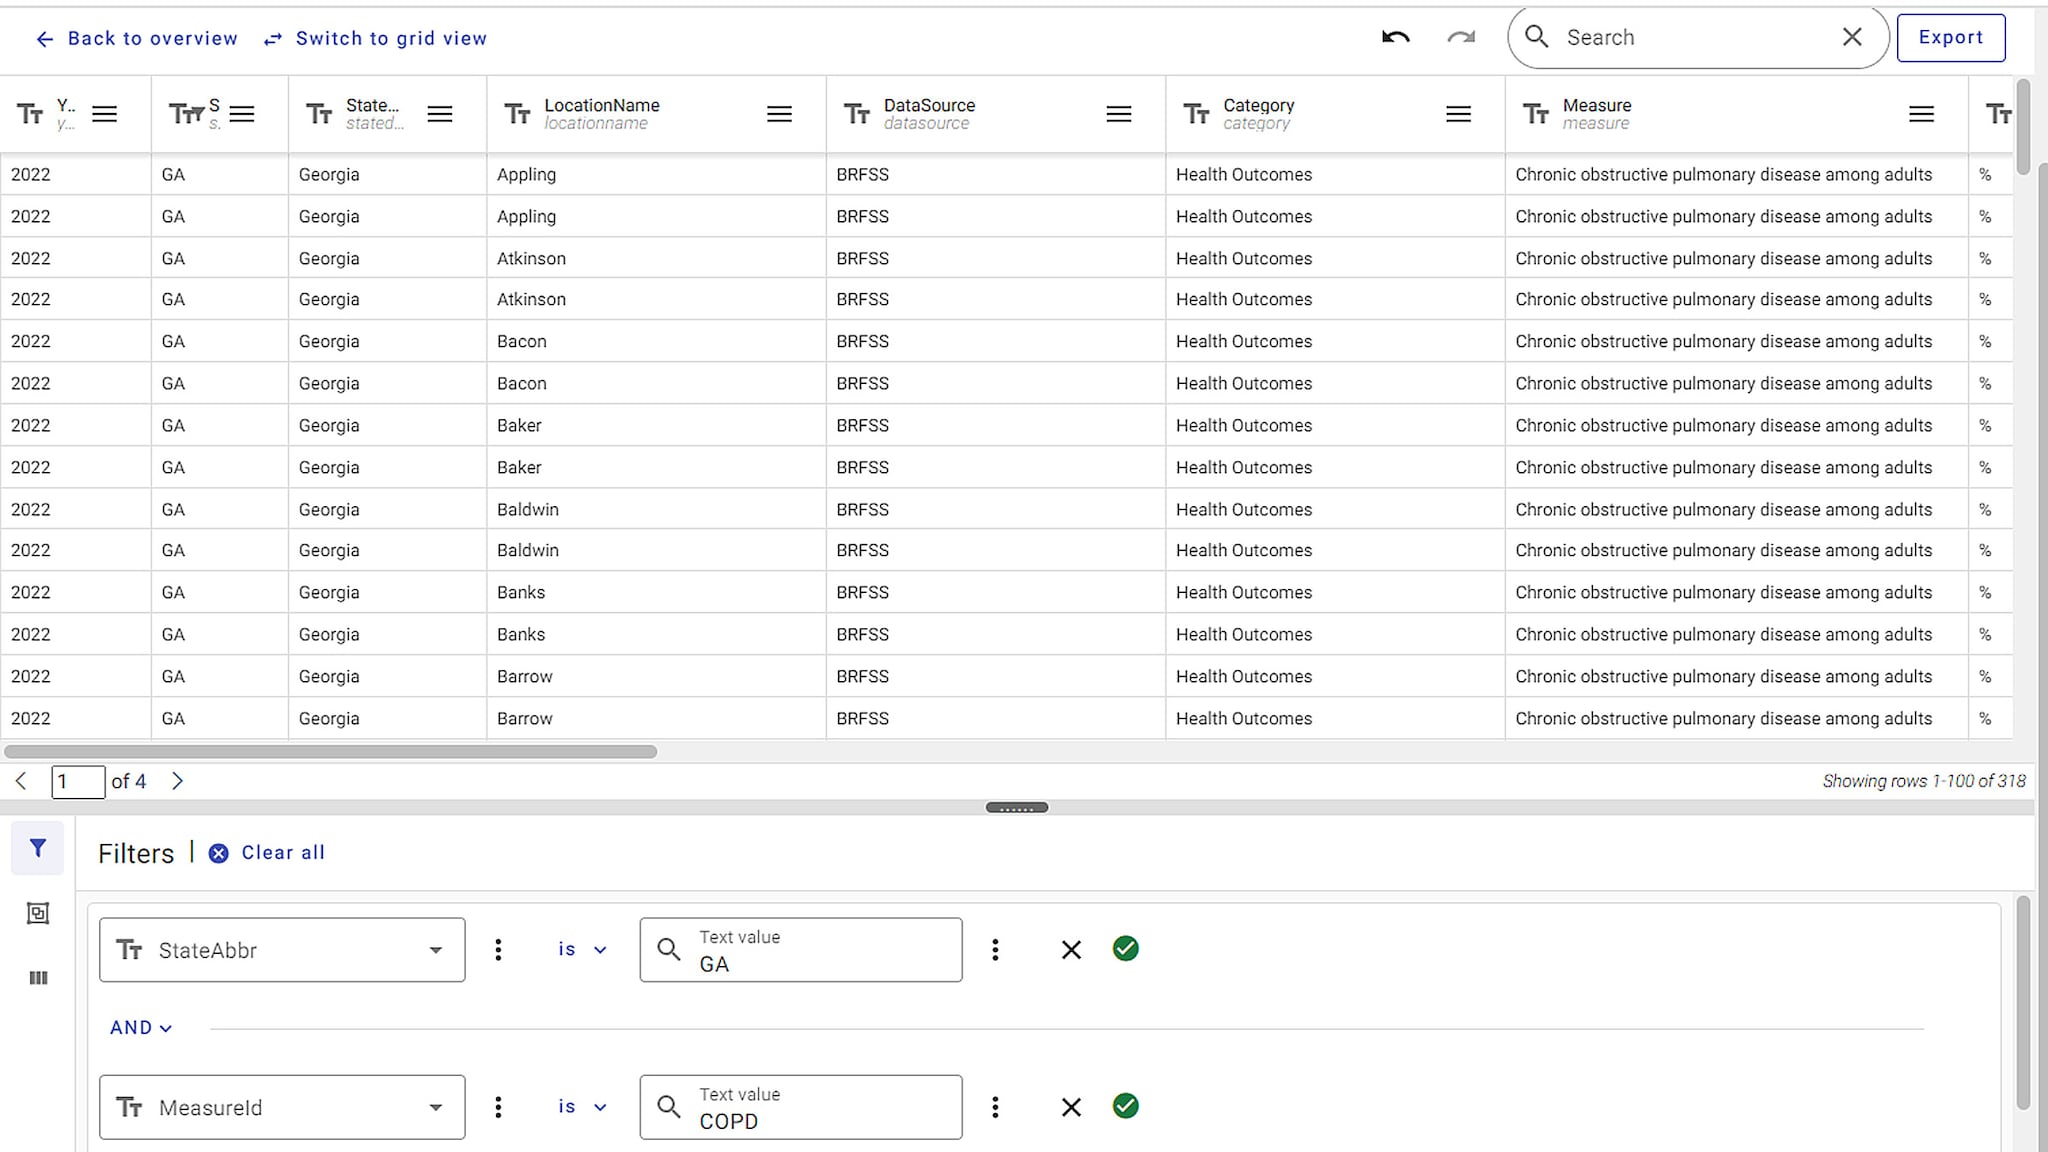
Note: The same approach can be used with the place (filter by state, place, and measures), census tract (filter by state, county, census tract, and measures), and ZCTA (filter by ZCTA and measures) datasets. You can download filtered data or create an account, sign in and save as a view and embed on a website.
For the GIS-friendly format data, each row is one geographic unit (e.g., county, place, census tract, or ZCTA) with all measures.
- See the screenshot below for county GIS-friendly data view.
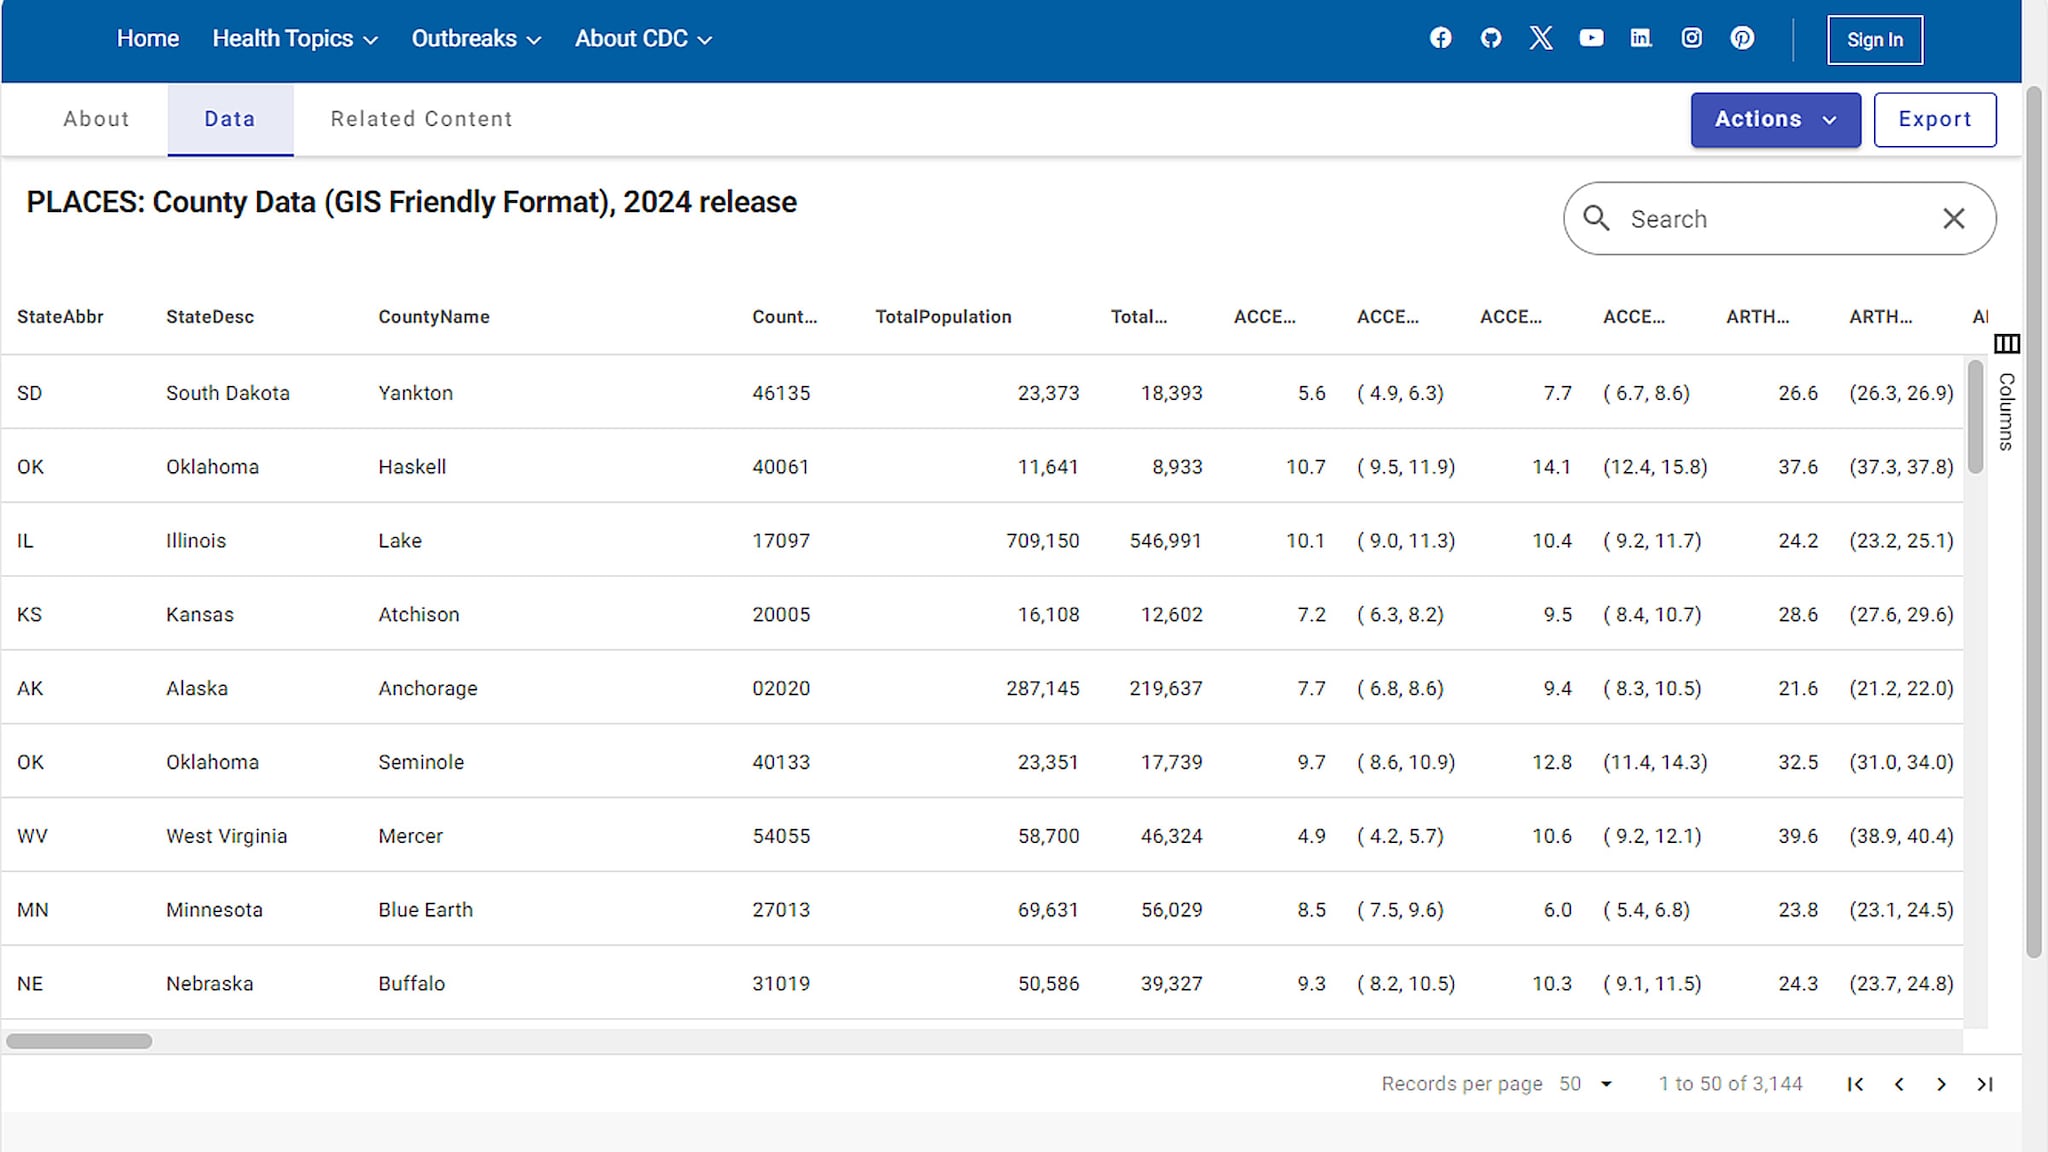
The filter for GIS-friendly format can only be applied to geographic units. For example, download data for:
- All counties/a county in a state.
- All places/a place in a state.
- All census tracts/a tract in a state or a county.
- A ZCTA or multiple ZCTAs.
Visualize
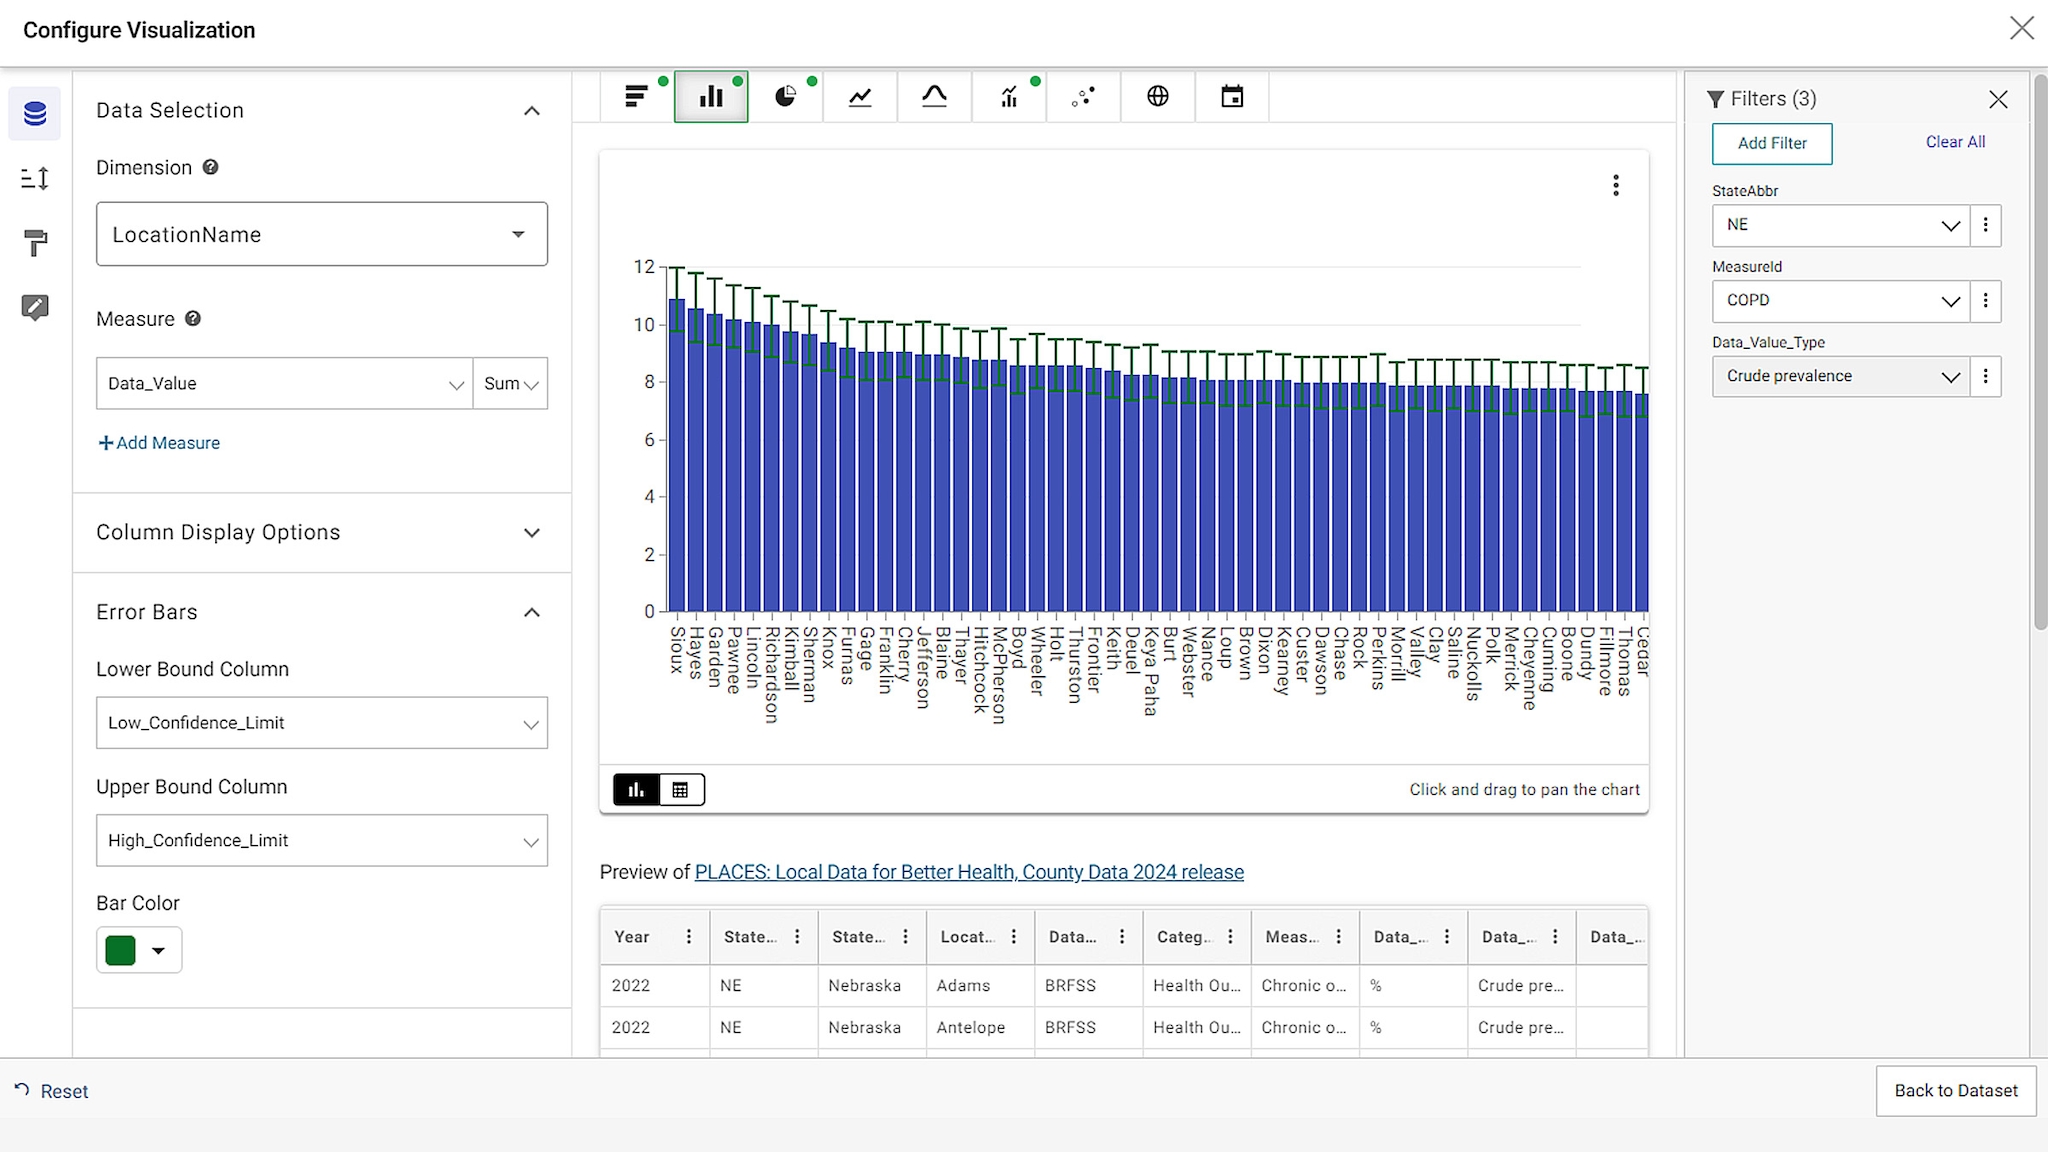
You can make a chart or a map using the visualize feature.
- You can select a chart type using the buttons along the top of the screen.
- Configure it by using options on the left side of the chart.
- Apply filters to it using the options on the right side of the chart.
Note: Not all chart types can be used for PLACES data.
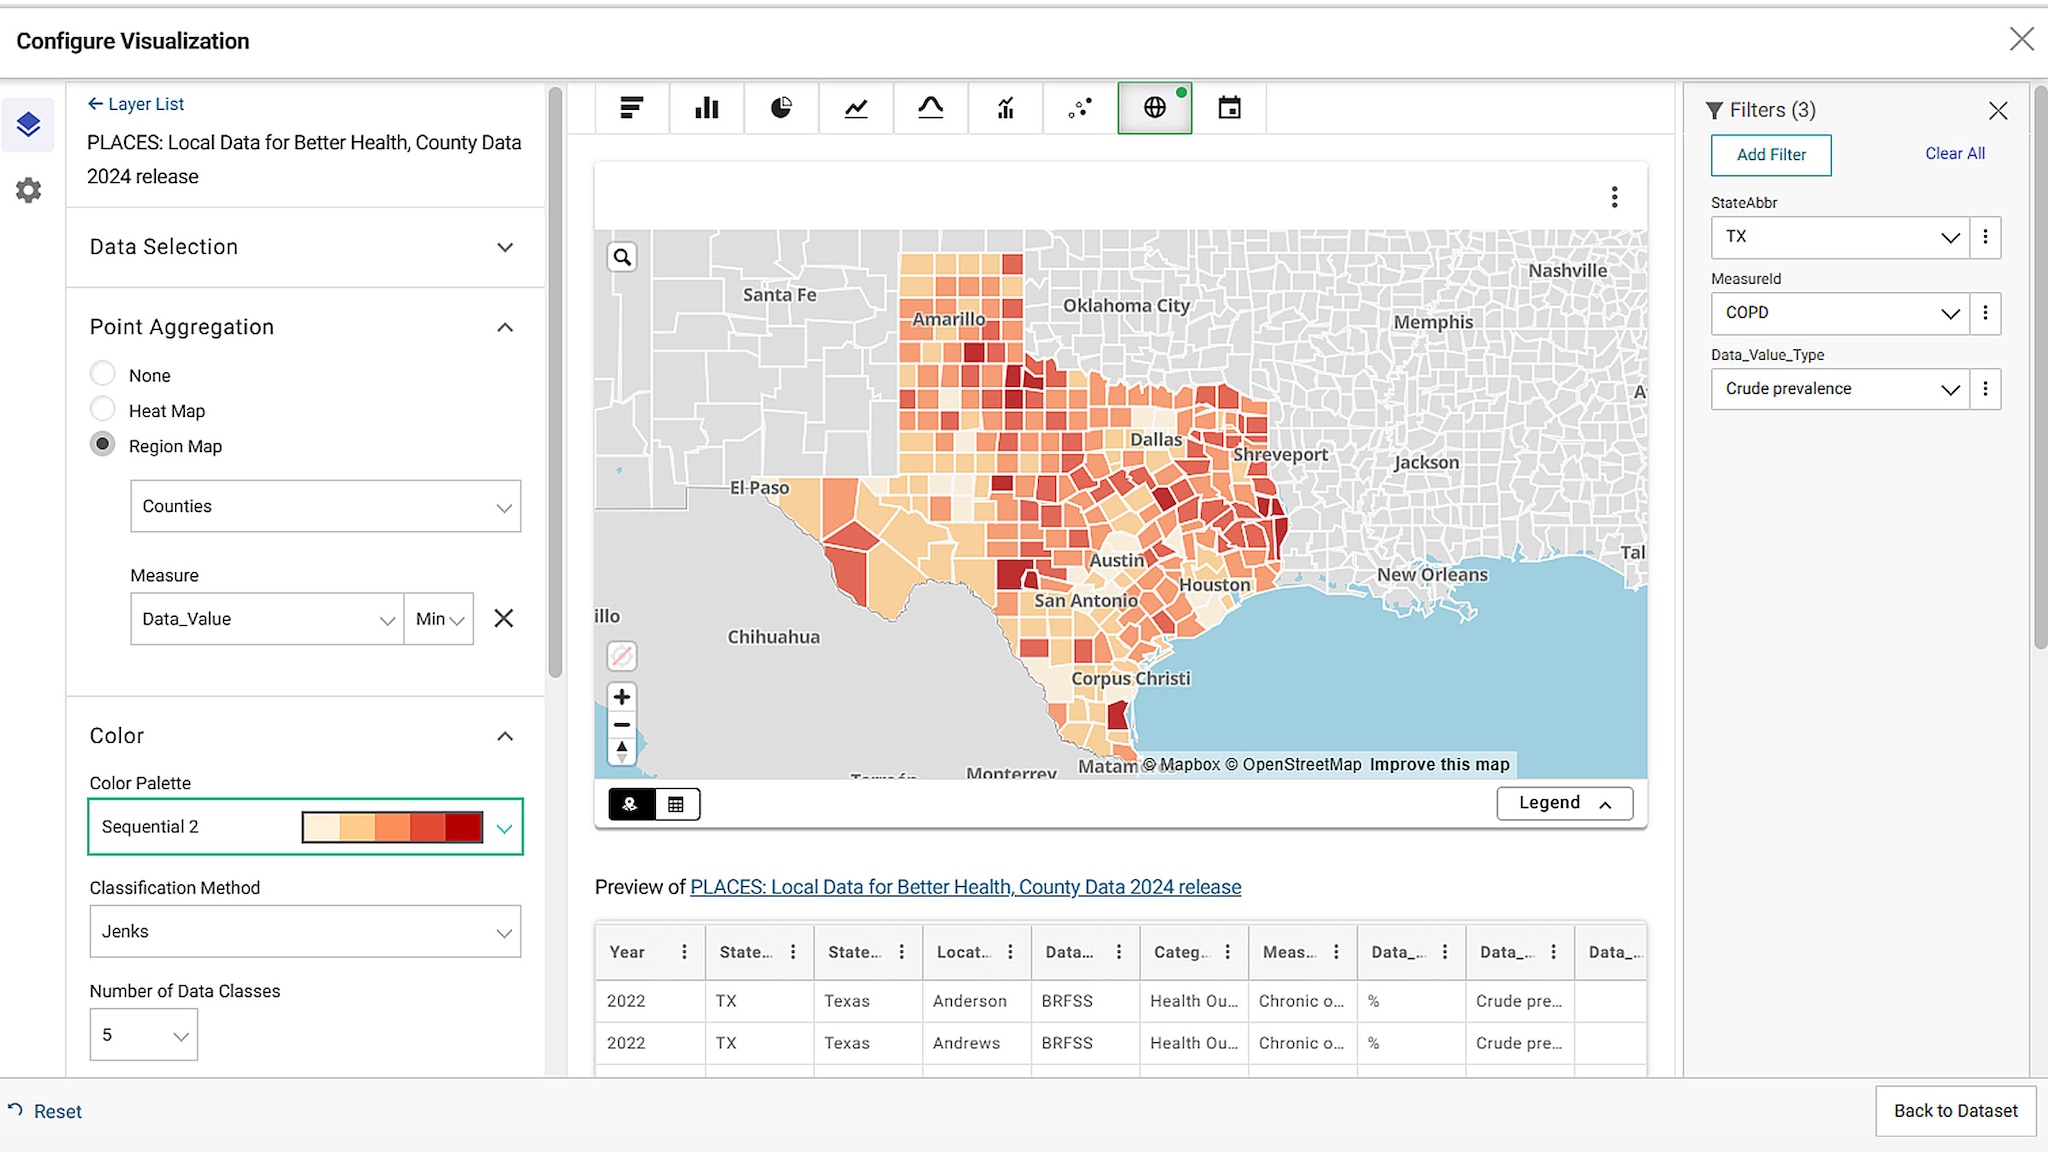
Below is an example of a map created to show crude prevalence by Texas counties.
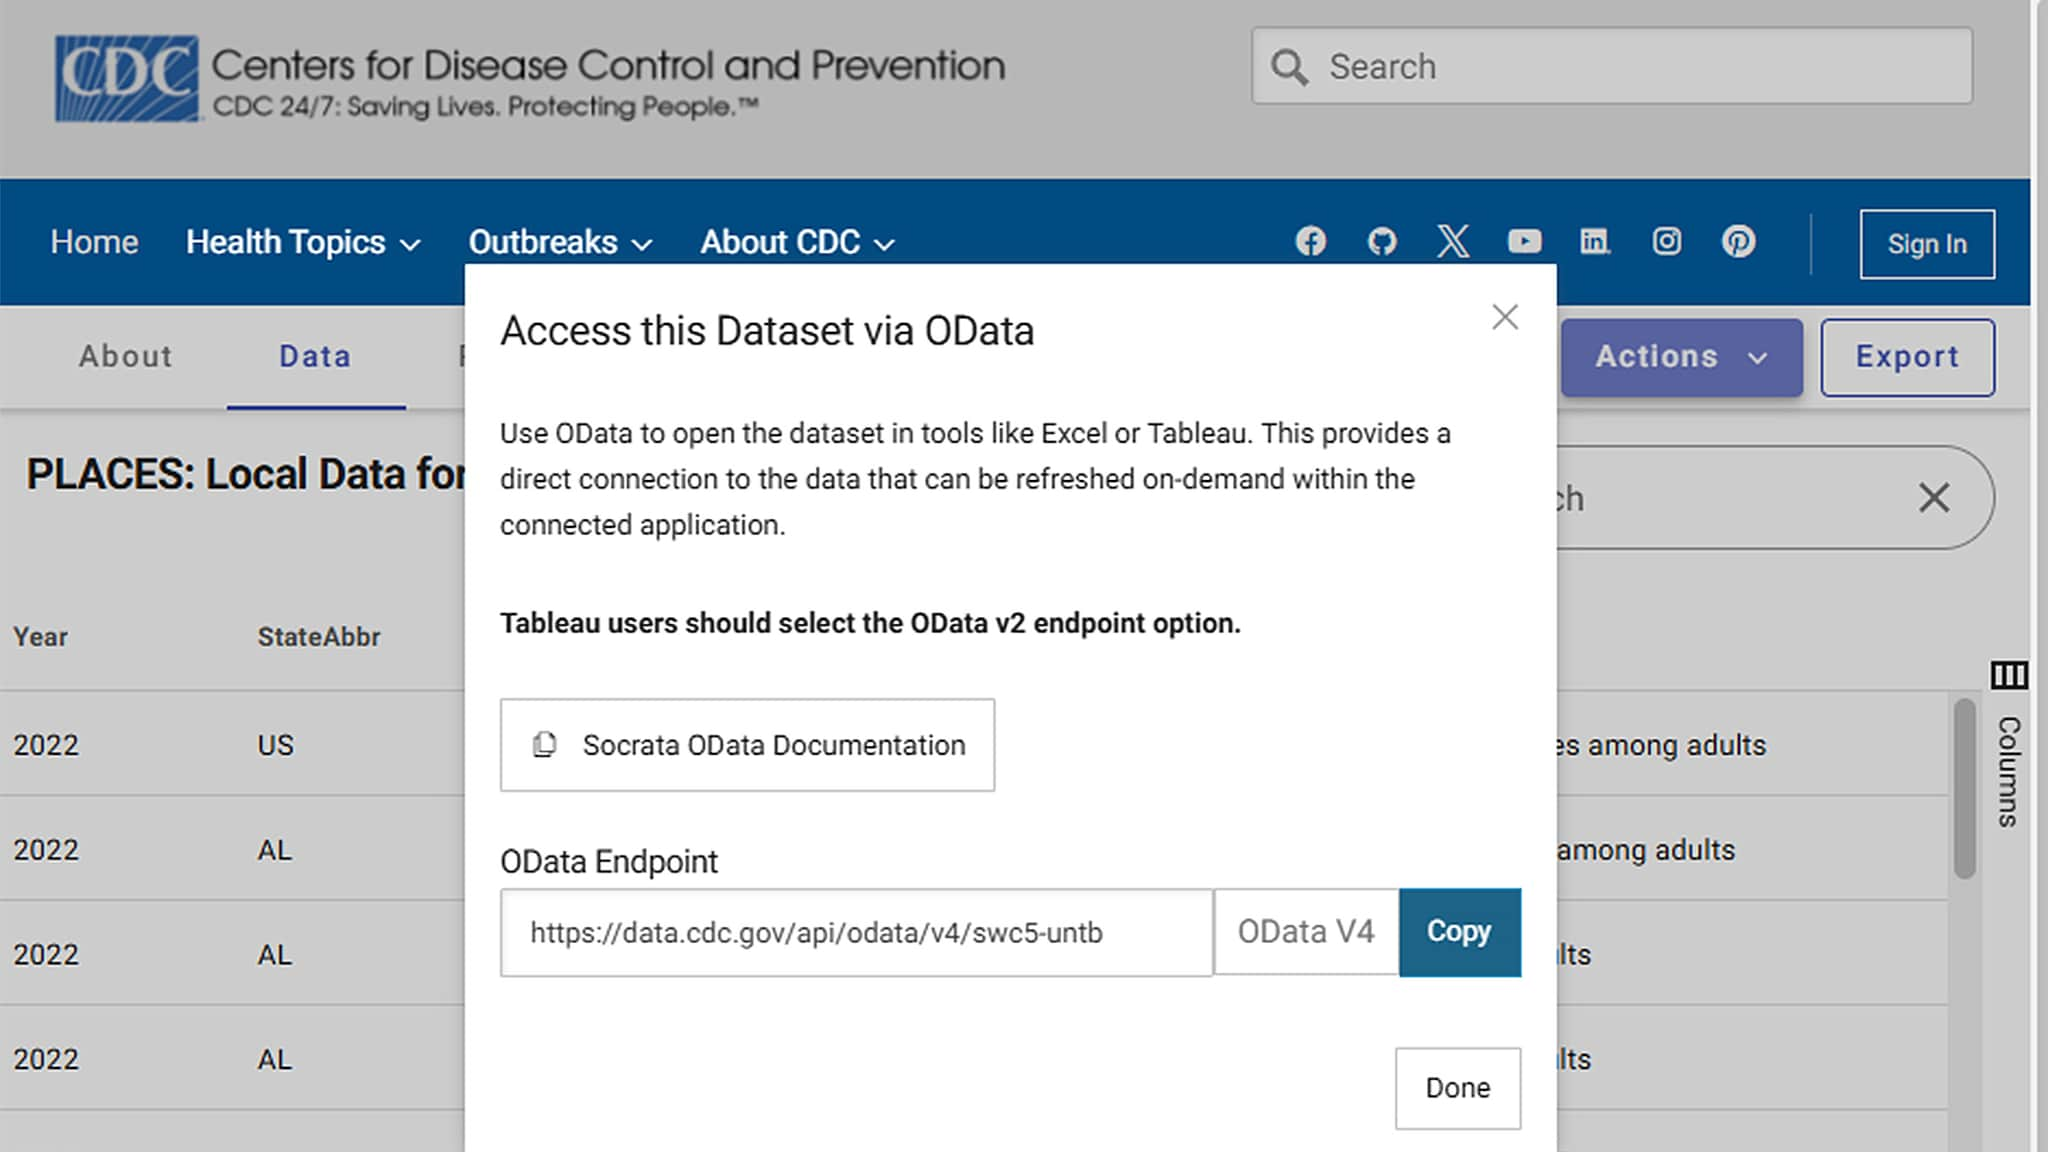
Access via OData
To access the data in Excel, Power BI, or Tableau, select Access via oData from the Action drop-down menu.
- You can copy the oData Endpoint URL to the software to add the dataset as a data source.
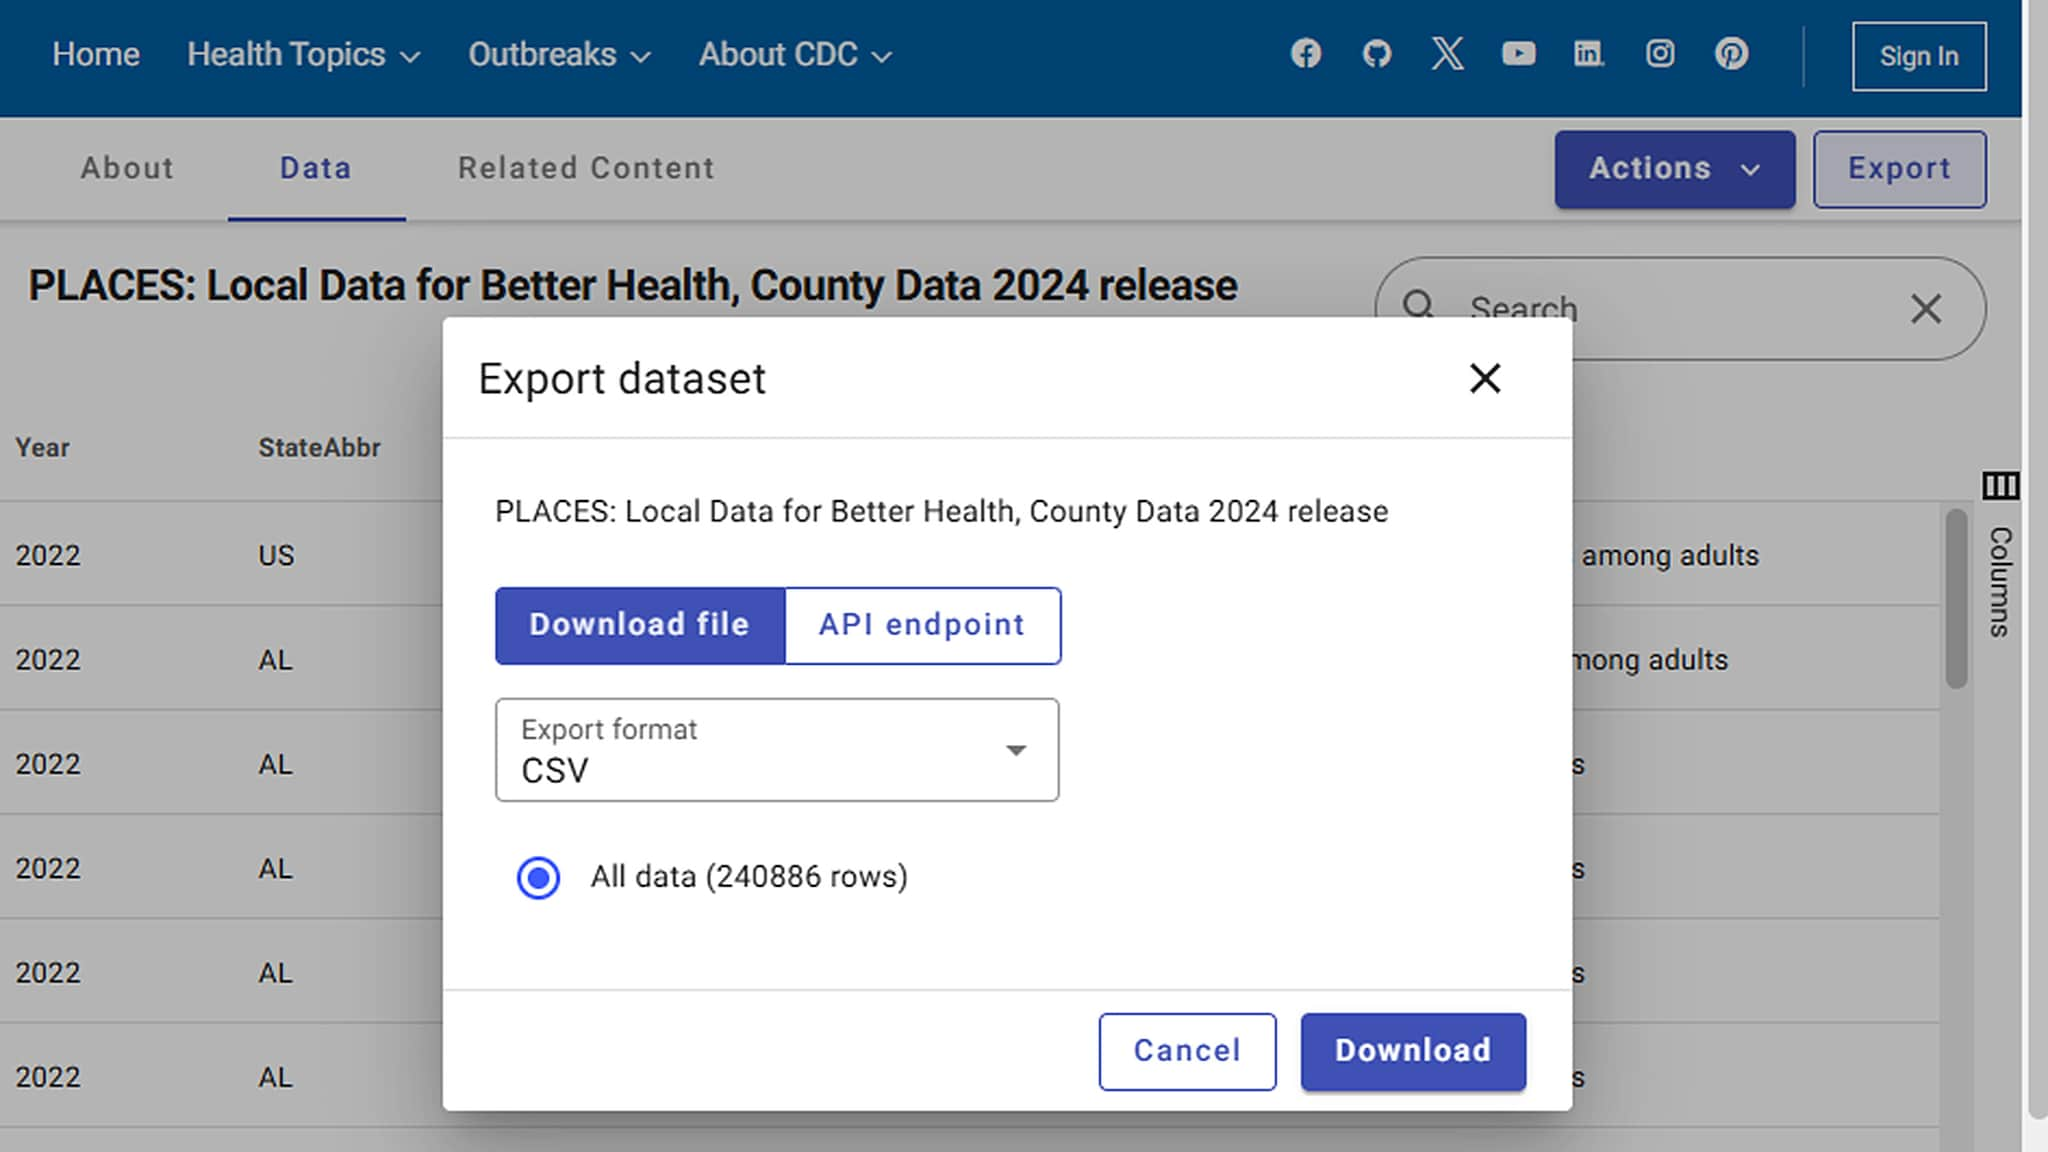
Export button
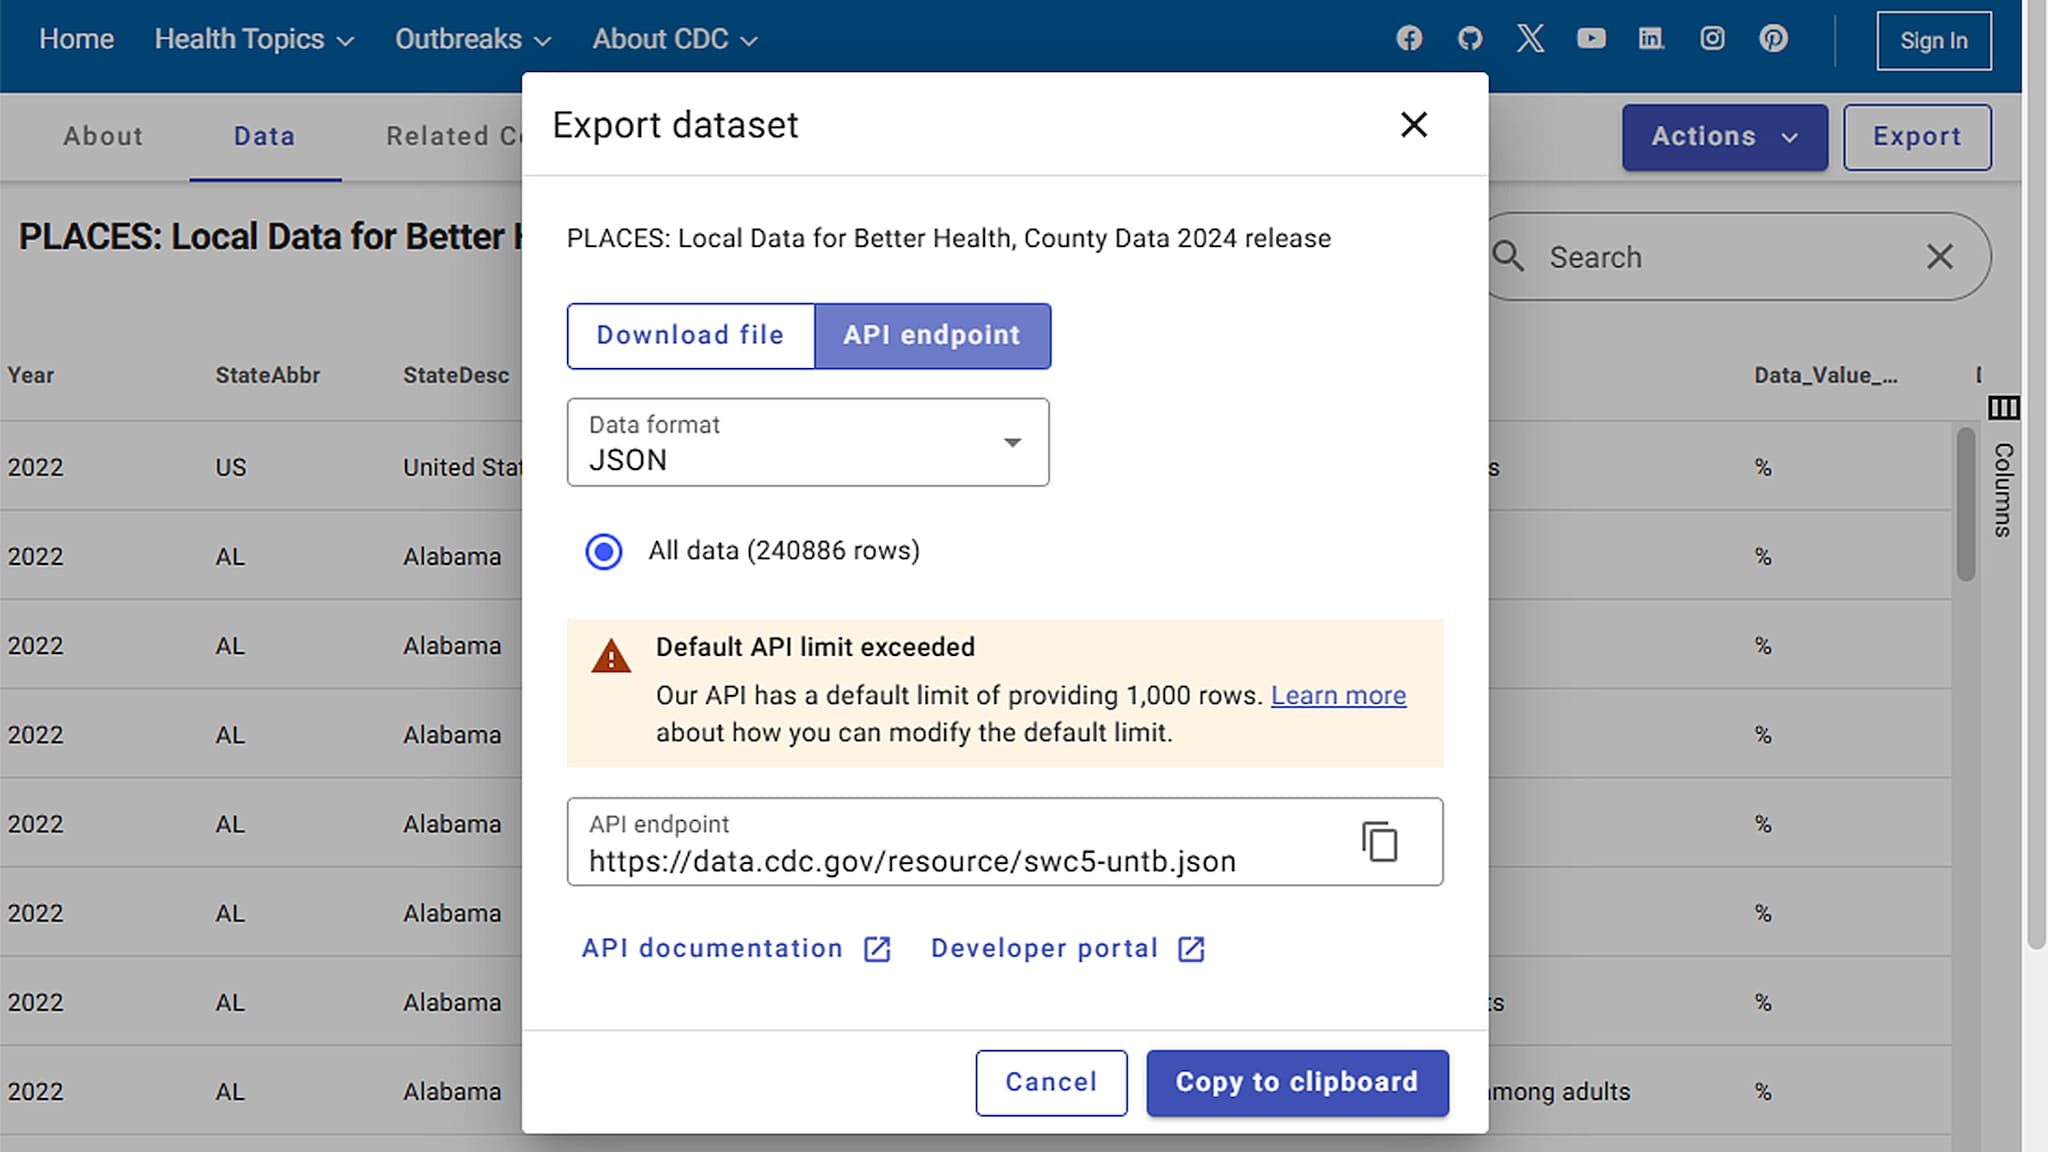
The Export button allows you to save and export your data. Clicking this button will display a pop-up menu with two options:
- Download file.
- API endpoint.
Choose one, then select your desired data format from the dropdown menu that appears.
Sign Up For An Account:
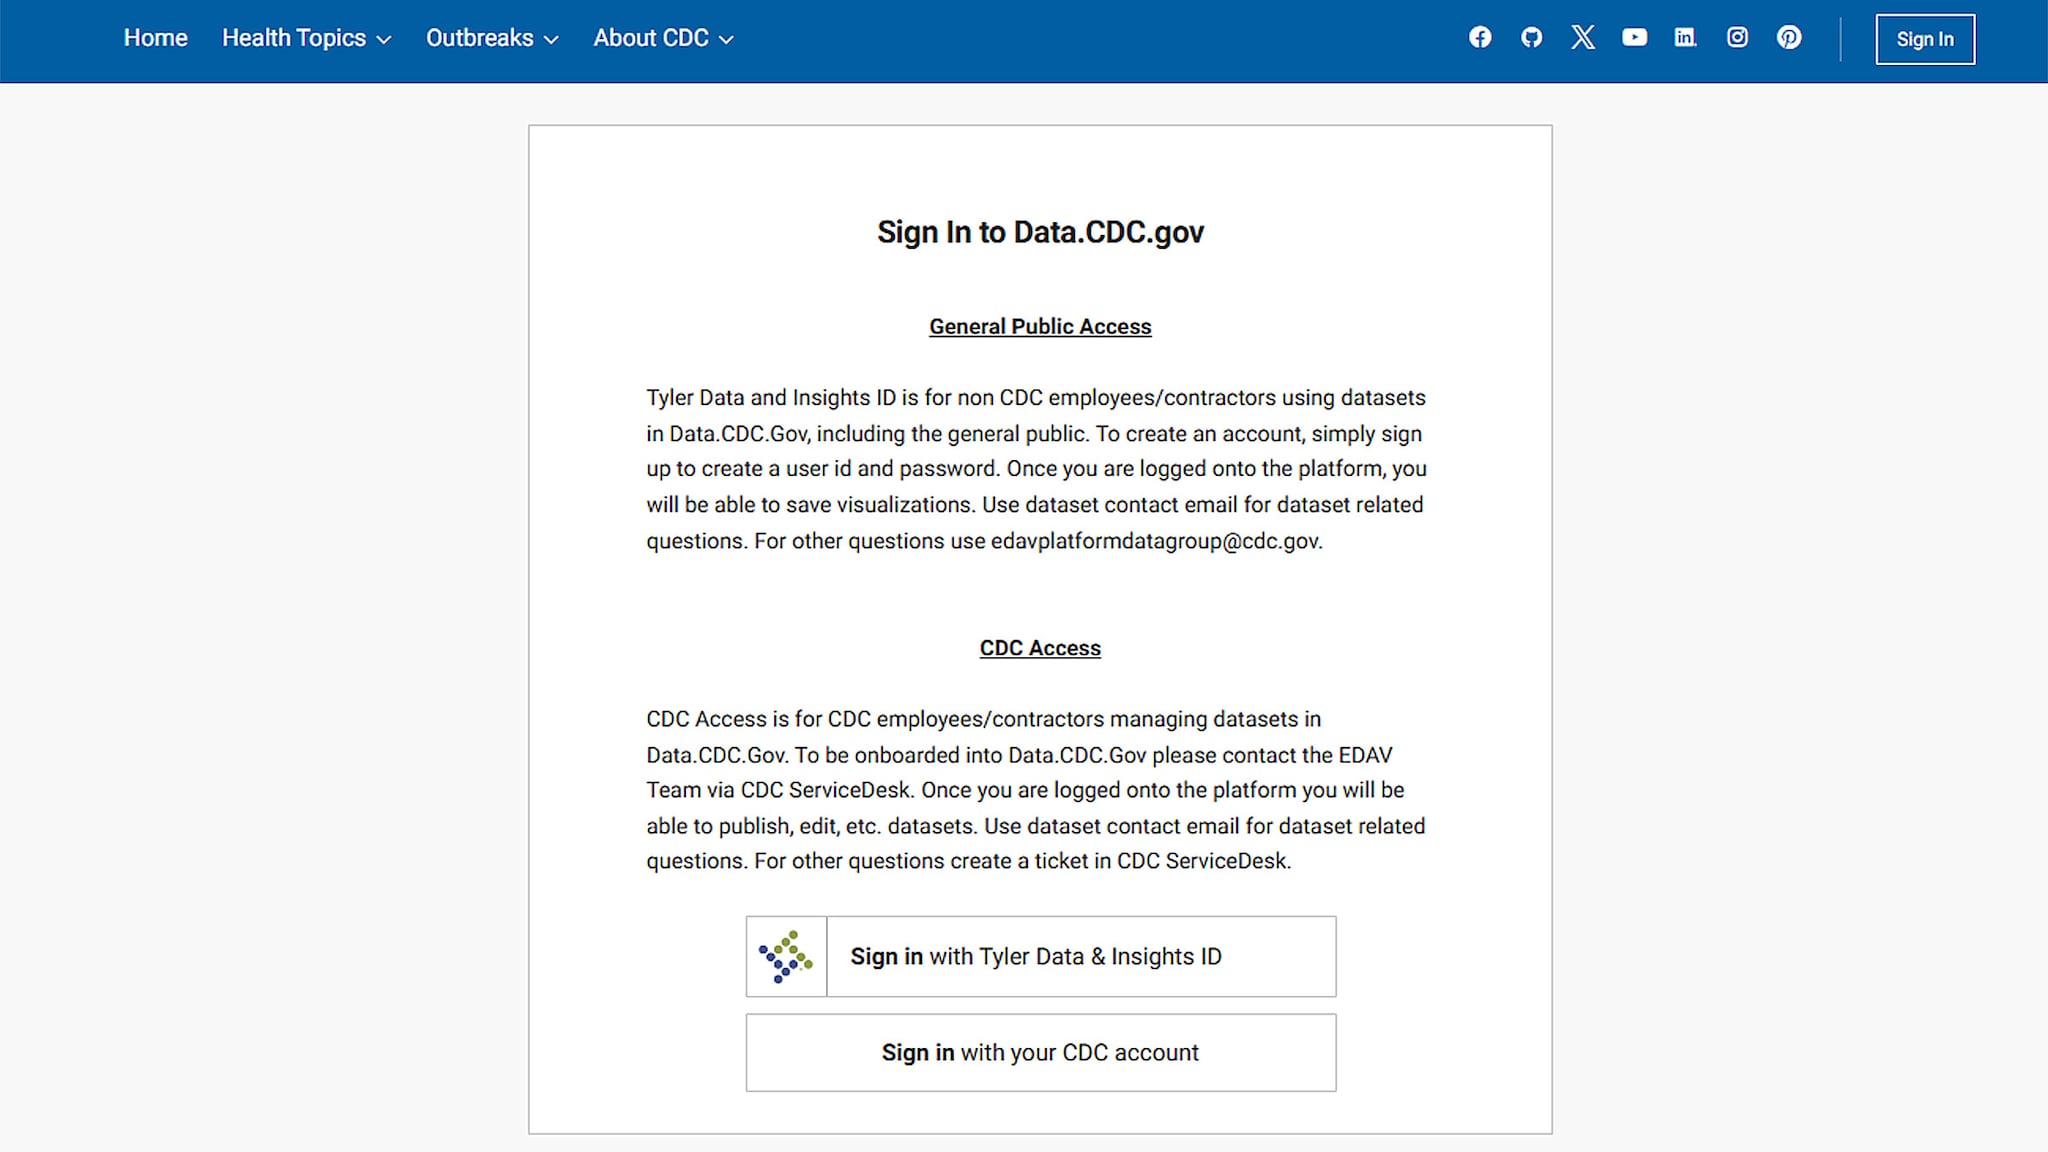
Signing up for an account in data.cdc.gov allows you to save filtered views and visualizations to embed a view or visualization on your website.
If you don't have an account with CDC:
- When the Sign In to data.cdc.gov window appears, click Sign in with Tayler Data & Insights ID.
- On the next screen, click the Sign Up link at the bottom right of the window.
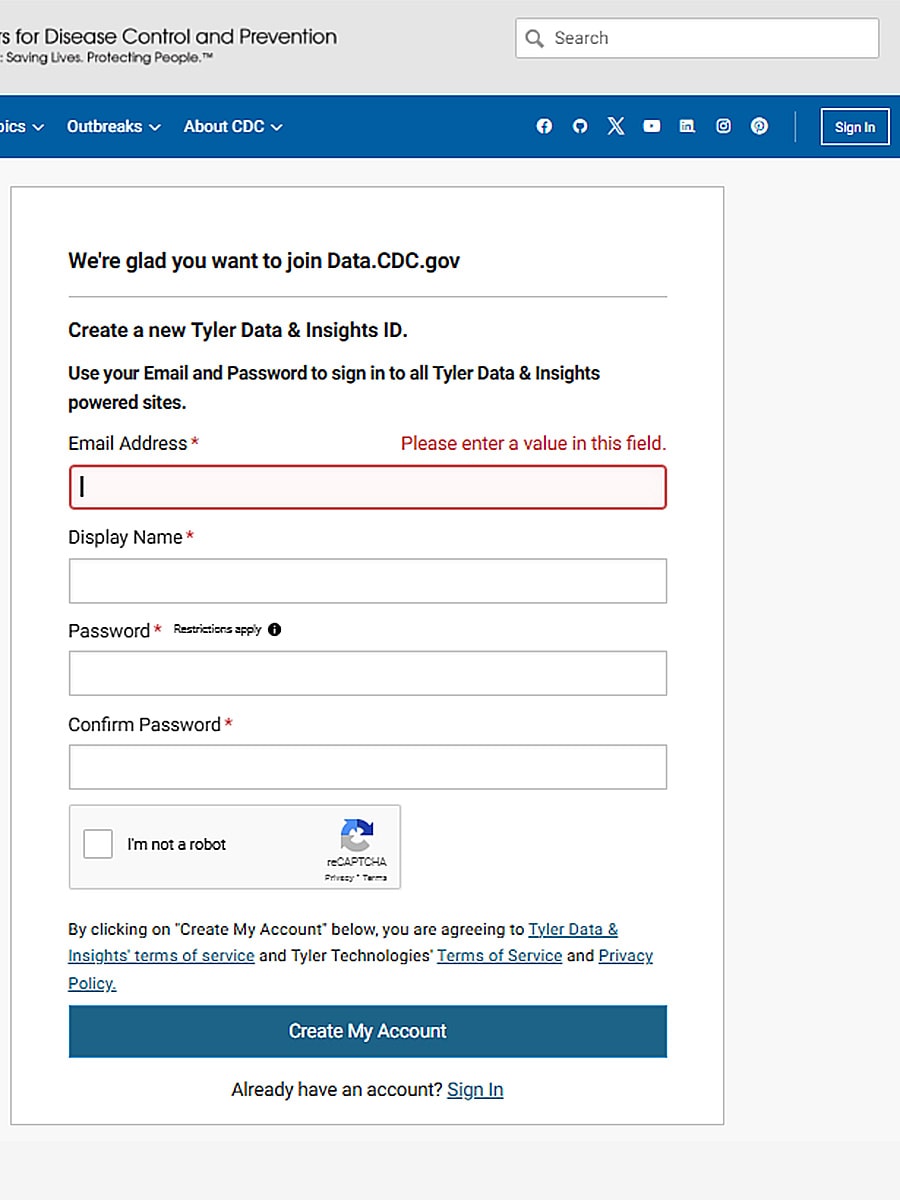
Fill out the form below to create a Tyler Data & Insights ID account.
Access Data Using SAS, Stata, R, Python, Etc.
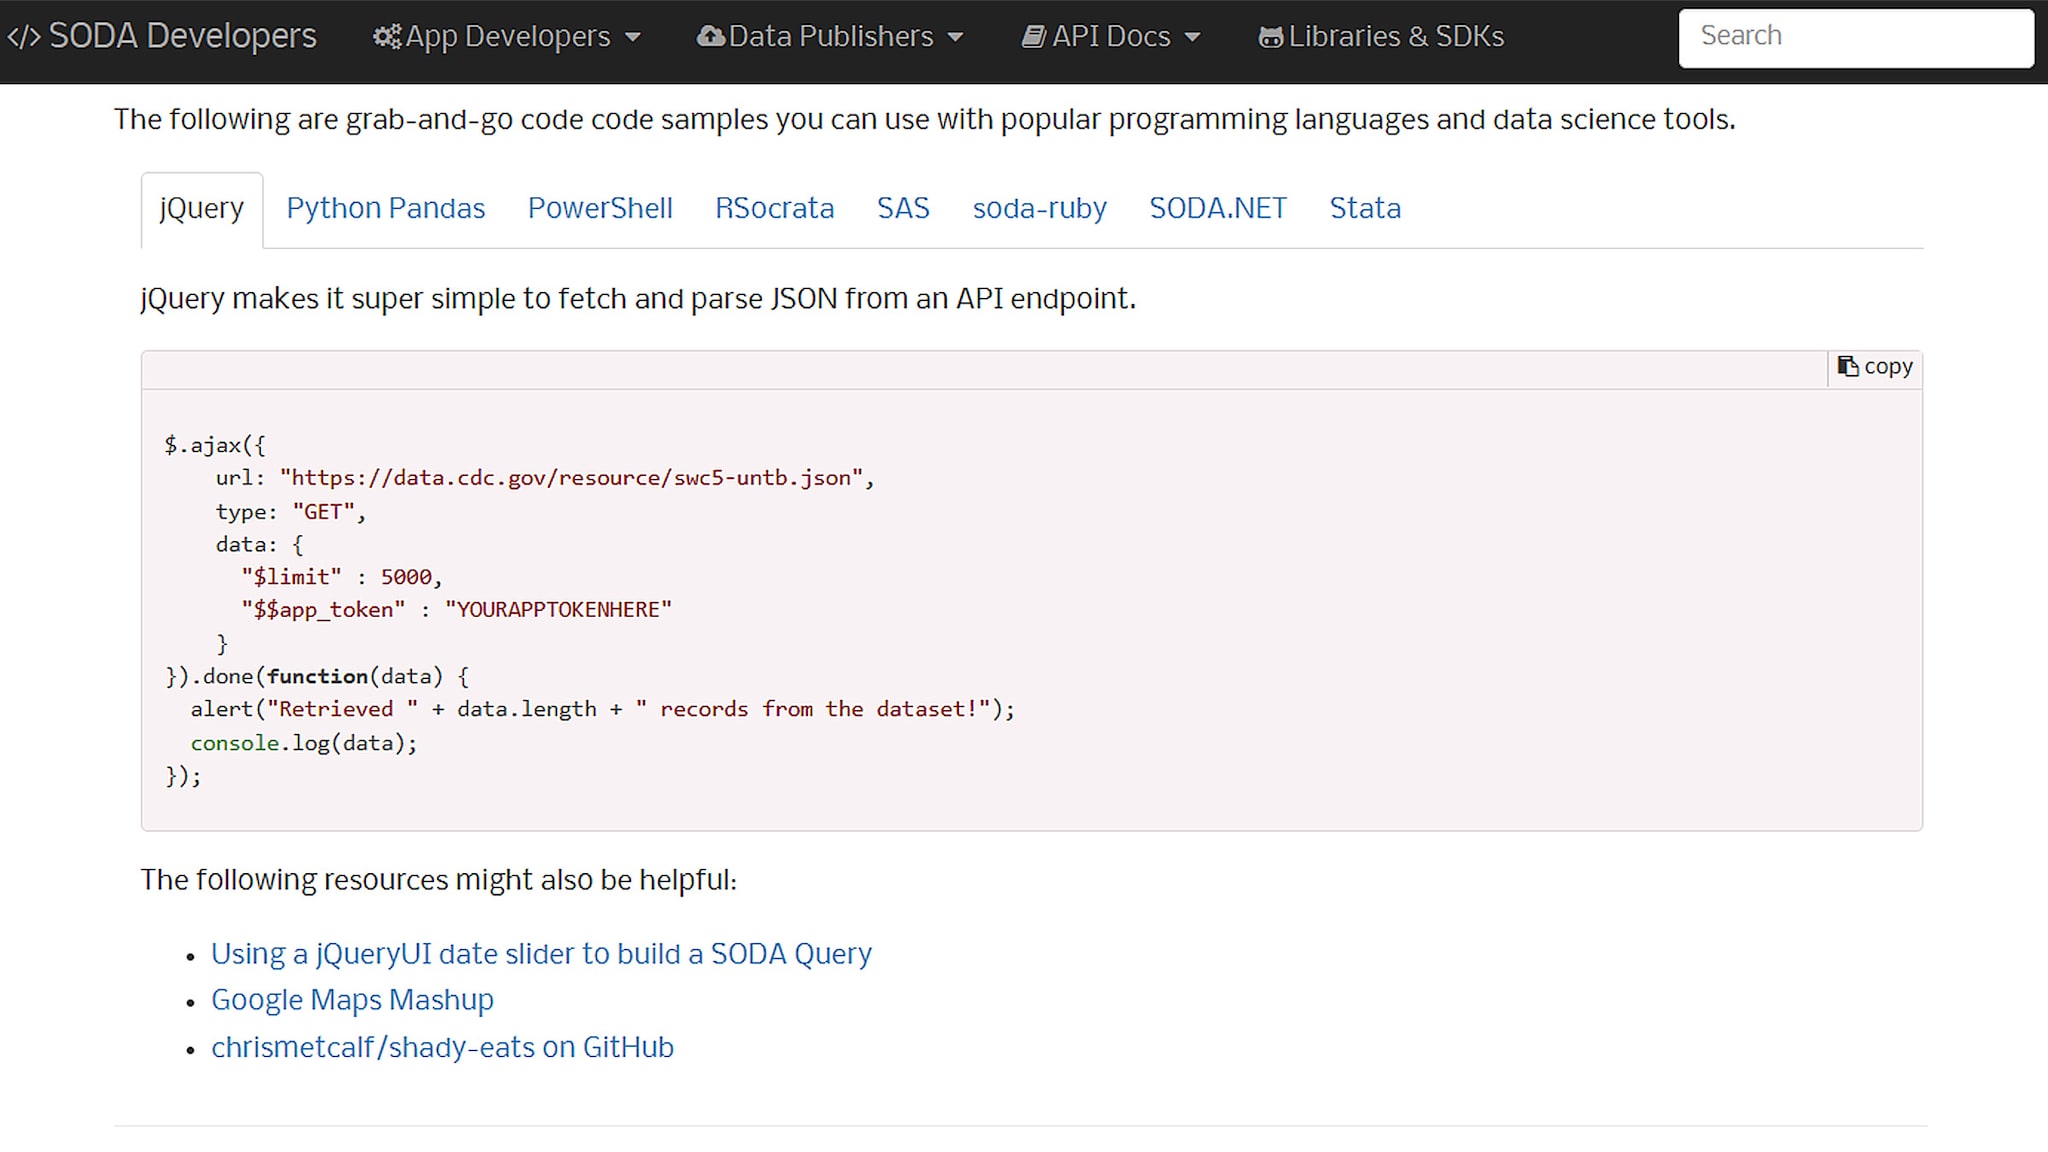
The datasets can be accessed using many popular programming languages.
This developer guide provides detailed documentation on the Socrata Open Data API.
- The code snippets section of the guide is great for learning to work with datasets using code.
More help:
SAS: https://dev.socrata.com/blog/2015/11/10/analyzing-open-data-with-sas.html
R: https://github.com/Chicago/RSocrata
Python: https://github.com/xmunoz/sodapy
