Key points
- People and animals are getting sick from harmful algal blooms (HABs) across the United States.
- Fifteen states voluntarily reported 372 HAB events, 95 human illnesses, and at least 102,071 animal illnesses.
- Nearly half (45%) of human illnesses were among children and teens younger than 18 years old.
- HABs can have major impacts on wildlife and ecosystems. A single HAB event in 2022 affected at least 100,000 fish and other marine animals.
Background
Harmful algal blooms (HABs) result from the rapid growth of algae or cyanobacteria (also called blue-green algae) in natural waterbodies and can harm people, animals, or the environment. HAB events of public health concern are primarily caused by microalgae called diatoms and dinoflagellates; cyanobacteria; and the toxins these organisms produce. HAB events, which can be intensified by nutrient pollution and warmer water temperature, can have public health, environmental, and socio-economic impacts.
HABs are a One Health issue—they affect the health of people, animals, and our shared environment. One Health is a collaborative and multi-sectoral approach that involves engagement across disciplines including public health, animal health, and environmental health. Using a One Health approach, CDC collects data about HAB events and associated human or animal illnesses through the One Health Harmful Algal Bloom System (OHHABS) to inform public health prevention efforts.
Within the context of OHHABS, the term HAB event describes the identification of a bloom or the detection of HAB toxins in water or food with or without a visual bloom. Human illnesses are reported individually. Animal illnesses are reported as single illnesses or in groups, such as flocks of birds. The reporting system links HAB event data with human or animal illness data. OHHABS uses standard definitions to classify HAB events as suspected or confirmed and human or animal illnesses as suspected, probable, or confirmed.
OHHABS is available for voluntary reporting by public health agencies and their designated environmental health or animal health partners in the United States, District of Columbia, Federated States of Micronesia, Guam, Marshall Islands, Northern Mariana Islands, Palau, Puerto Rico, and U.S. Virgin Islands. Public health agencies use standard forms to report HAB events, human illnesses, and animal illnesses to OHHABS. Each report must include information about the HAB event, but public health agencies do not need to submit all three types of forms to participate.
The data OHHABS collects about HAB events include general information (e.g., observation date), geographic information, water body characteristics (e.g., salinity), observational characteristics (e.g., water color, scum), and laboratory testing results. Data OHHABS collects about illnesses include general demographic characteristics, exposure information, signs and symptoms, medical care, and health outcomes. OHHABS is a dynamic electronic reporting system; data within individual reports are subject to change over time. Data included in this report are from a specific point in time.
Methods
This summary describes data from OHHABS for events occurring between January 1, 2022 and December 31, 2022. CDC received reports by December 31, 2023 and reviewed them using standardized data quality checks. CDC downloaded the final dataset on May 1, 2024. CDC used SAS (version 9.4; SAS Institute) to conduct descriptive analyses to characterize HAB events and associated human or animal illnesses.
Due to rounding, numbers presented throughout this summary may not add up precisely to the totals provided and percentages may not precisely reflect the absolute figures.
Reports that included water testing results showing toxins or cyanobacteria at concentrations greater than zero were considered positive HAB detections. Positive detections are included in the summarized environmental testing data. Reports showing concentrations of zero, or that did not report a concentration, are not included in this analysis.
If group animal reports were missing the number of individuals affected, the number was set to two for inclusion in descriptive analyses. If group animal reports indicated deaths occurred but did not provide the number of individuals that died, the number of deaths was set to missing as this could not be extrapolated from available information.
Public health agencies classified HAB events as suspected or confirmed and illnesses as suspected, probable, or confirmed (2018 OHHABS case and event definitions). Animals within group animal reports were classified according to the overall classification (e.g., if a group of 10 animals was classified as "probable," then each animal was subsequently defined as a probable illness).
CDC classified reported signs and symptoms primarily based on the organ system affected. "Generalized" refers to constitutional signs and symptoms such as headache, fever, or lethargy in humans and weakness, lethargy, or anorexia in animals. Some signs and symptoms classified as neurologic may present in other systems (e.g., ophthalmologic). CDC periodically reviews signs and symptoms reported in OHHABS to assign classifications to newly entered values.
Findings
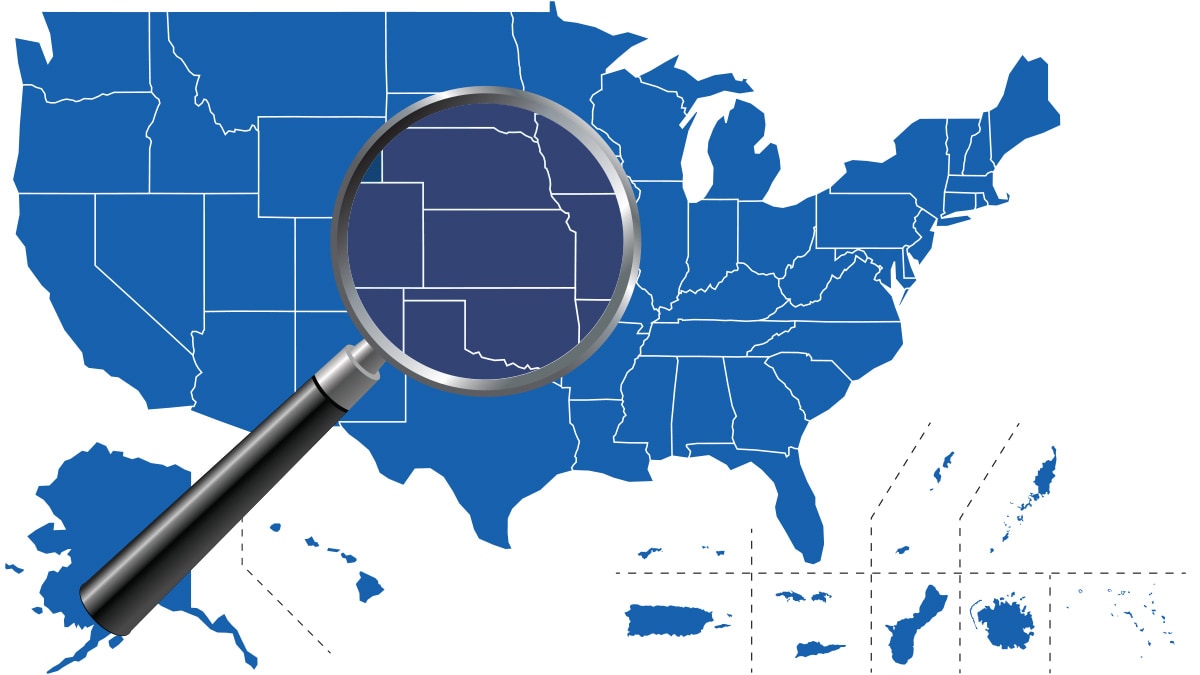
During 2022, 372 HAB events were reported by 15 states: Arizona, California, Kansas, Maryland, Michigan, Minnesota, Ohio, Pennsylvania, Tennessee, Texas, Utah, Virginia, Washington, Wisconsin, and Wyoming (Figure 1). These HAB events resulted in 95 human illnesses and at least 102,071 animal illnesses. Fourteen groups of animals were reported, ranging from 2-100,000 individuals (Figure 2).
Reported HAB events occurred predominantly in summer months, peaking in July (109, 29%) (Figure 3). Most HAB events were classified as confirmed (317, 85%) (Figure 4). Human illnesses occurred primarily in July (33, 35%) (Figure 3). Animal illnesses occurred primarily in August (101,542, 99%). The animal illnesses include two large wildlife illness events in California. The first event affected at least 100,000 marine wildlife (including fish and other shellfish), killing 10,000 animals. The second killed at least 1,500 marine wildlife (including white sturgeon, other fish, and shellfish) (Figure 3). Most illnesses were classified as probable, including 75% (71) of human illnesses and 99% (102,034) of animal illnesses (Figure 4).
Data
Overall
Figure 1: States reporting HAB events for 2022
15 states reported to OHHABS for 2022.
Figure 2: Reported HAB events with associated human and animal illnesses, 2022
372 HAB events resulted in 95 human illnesses and at least 102,071 animal illnesses in 2022. 117 animal illnesses were reported on single illness forms. 101,954 animal illnesses were reported on 14 group illness forms.
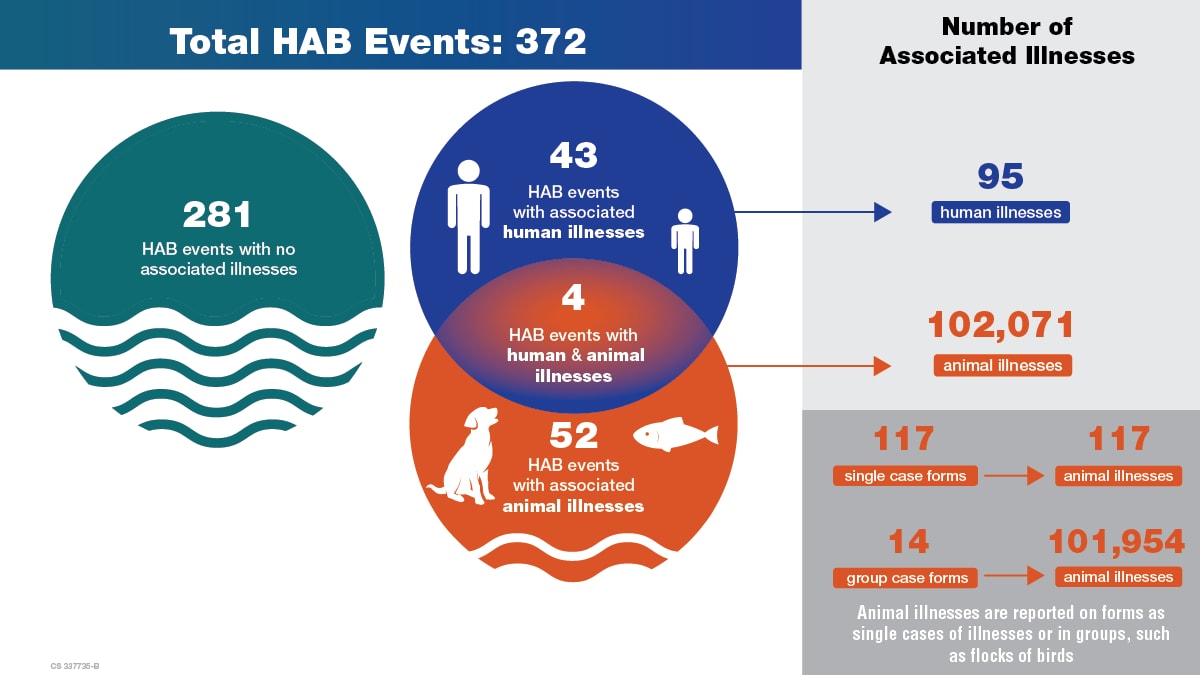
Figure 3: Reported HAB events and illnesses by month, 2022
Most reported HAB events and illnesses in 2022 occurred during the summer months.
*Three HAB events did not have a reported month.
**Includes 2 large wildlife illness events in August that together affected at least 101,500 animals
***Excludes 2 large wildlife illness events in August that together affected at least 101,500 animals
Figure 4. Proportion of reported HAB events and associated human and animal illnesses by classification, 2022
In 2022, 85% (317) of HAB events were classified as confirmed, 75% (71) of human illnesses as probable, and 99% (102,034) of animal illnesses as probable.
*HAB events can only be classified as "suspected" or "confirmed."
**Includes two large wildlife illness events that together affected at least 101,500 animals
***Excludes two large wildlife illness events that together affected at least 101,500 animals
HAB Events
Most (342, 92%) of the 372 HAB events occurred in fresh water (Figure 5a), primarily in lakes and reservoirs (300, 88%) (Figure 5b). Observers of the freshwater HABs most frequently noted green water color (71, 21%). However, one or more observations of clear water were reported during 33 (10%) of these HAB events (Figure 6). Scum or algal matter was observed in 224 (94%) of 238 HAB events that included information on scum presence or absence.
Out of the 340 reports that provided information on environmental testing, 280 (82%) confirmed testing was performed. Monitoring (275, 98%) and citizen complaints (54, 19%) were the most frequently reported reasons for conducting environmental testing for algal toxins or species (Figure 7). Of the 372 HAB event reports, 295 (79%) included environmental testing results with positive detections (greater than zero) of toxins or cyanobacteria. Almost all of these were related to freshwater HAB events (275, 93%). Among these 295 reports, toxins were most frequently detected (228, 77%) (Figure 8). Of those toxins, microcystins (206, 90%) were identified the most (Figure 9a). Multiple toxins were reported for 35 (15%) HAB events. Aphanizomenon was the most identified genus during environmental testing, detected in 38 (29%) of 129 HAB events (Figure 9b).
Figure 5a: Reported HAB events by water salinity, 2022
Most of the 372 HAB events during 2022 occurred in fresh water (342, 92%).
*One brackish event was included in salt water salinity data.
Figure 5b: Reported freshwater HAB events by water type, 2022
Most (300, 88%) of the 342 freshwater HAB events during 2022 were in lakes, reservoirs, or impoundments.
*Other includes freshwater water types that were reported less than 2% of the time: hot springs, canals, and other unspecified water types.
Figure 6: Reported water color for freshwater HAB events, 2022
Of the 342 freshwater HAB events with water color data, most were reported as being green (71, 21%) in color.
*Multiple water colors could be selected.
**Other includes all colors reported less than 3% of the time: blue, gray, aqua, milky-white, rust, pink, normal, red, and other unspecified water colors.
Figure 7: Reasons for environmental testing of HAB events, 2022
In 2022, the primary reason for environmental testing was water quality monitoring (275, 98%).
*Multiple reasons for environmental testing of HAB events could be selected
Figure 8: Environmental testing findings during HAB events, 2022
Cyanobacteria, toxins, or both were tested for and detected in 295 (79%) of the 372 reported HAB events. Toxins were identified most often, in 228 (77%) of the 295 HAB events with testing data.
*Multiple options for environmental testing could be selected. Reports might include findings of toxins, organisms, or both.
Figure 9a. Identified toxins during environmental testing of HAB events, 2022
Among the 228 HAB events with toxins identified during environmental testing, microcystins (206, 90%) were found most often.
*Multiple options for toxin could be selected. Multiple toxins were detected in 35 (15%) HAB events.
Figure 9b. Identified genera during environmental testing of HAB events, 2022
Aphanizomenon was the most identified genus during environmental testing, detected in 38 (29%) of 129 HAB events.
*Multiple options for genus/order could be selected.
Human illnesses
Of 95 human illnesses reported to OHHABS for 2022, 43 (45%) illnesses occurred in people under age 18, and 40 (42%) illnesses occurred in adults aged 18-45 years (Figure 10). People who became ill were exposed to HABs predominately at parks (45, 47%) and non-specified locations (27, 28%). Of the 86 people who reported route of exposure, 84 (98%) reported water, 1 (1%) reported air, and 1 (1%) reported food as a source of exposure. Of the 95 ill people reported, 76 (80%) sought care, 68 (72%) reported calling a poison control center, and 18 (19%) visited a healthcare provider (Table 1). No human deaths were reported.
Numerous signs and symptoms were reported from the 95 human illnesses; the most commonly reported types were dermatologic (47, 49%), gastrointestinal (44, 46%), and generalized (41, 43%) (Figure 11). Overall, rash (31, 33%), pruritus (itchy skin) (22, 23%), and fever (21, 22%) were the most commonly reported signs and symptoms (Table 2). Median time to illness onset was 3.5 hours (0.02-96; n=56) and median illness duration was 24 hours (0.03-528; n=48). Forty-five (47%) of the 95 ill people still exhibited signs or symptoms at the time of interview. (Table 1).
Figure 10: Percentage of HAB-associated human illnesses by age group, 2022
Almost half (43, 45%) of the 95 reported illnesses during 2022 occurred among people under the age of 18 years, followed by adults 18-45 years (40, 42%).
Figure 11: Signs and symptoms of HAB-associated human illnesses, 2022
The most frequently reported types of signs and symptoms by the 95 ill people were dermatologic (47, 50%), gastrointestinal (44, 46%), and generalized (41, 43%) during 2022.
*Multiple options of human signs and symptoms could be selected.
Table 1. Medical care for HAB-associated human illnesses, 2022
Of the 95 ill people, 76 (80%) sought care from at least one source.
| Any health-seeking behavior | Number | (%) |
|---|---|---|
| Any health-seeking behavior | 76 | (80) |
| Call to a poison control center | 68 | (72) |
| Visit to healthcare provider | 18 | (19) |
| Visit to emergency department | 1 | (1) |
| Received first aid care | 14 | (15) |
| Experiencing symptoms at time of interview | 45 | (47) |
| *Multiple options of health-seeking behavior could be selected. | ||
Table 2. Signs and symptoms reported by people with HAB-associated illnesses, 2022
Rash (31, 33%), pruritus (itchy skin) (22, 23%), and fever (21, 22%) were the most commonly reported signs and symptoms by the 95 ill people.
| Classification | Sign or Symptom | Number | (%) |
|---|---|---|---|
| Cardiopulmonary | 15 | (16) | |
| Chest pain | 1 | (1) | |
| Chest tightness | 2 | (2) | |
| Cough | 13 | (14) | |
| Dyspnea (shortness of breath) | 1 | (1) | |
| Respiratory (nonspecific) | 1 | (1) | |
| Respratory symptoms (nonspecific) | 1 | (1) | |
| Shortness of breath | 1 | (1) | |
| Dermatologic | 47 | (50) | |
| Dermatologic (nonspecific) | 2 | (2) | |
| Erythema (redness) | 3 | (3) | |
| Irritated skin | 5 | (5) | |
| Pruritus (itchy skin) | 22 | (23) | |
| Rash | 31 | (33) | |
| Skin blisters | 8 | (8) | |
| Skin burning/pain | 2 | (2) | |
| Urticaria (hives) | 5 | (5) | |
| Ear, Nose, Throat | 26 | (27) | |
| Ears, ache or pain | 3 | (3) | |
| Nasal, congestion (rhinitis) | 7 | (7) | |
| Throat pain | 5 | (5) | |
| Throat, irritation | 3 | (3) | |
| Throat, sore | 12 | (13) | |
| Gastrointestinal | 44 | (46) | |
| Abdominal cramps | 4 | (4) | |
| Abdominal pain (tenderness) | 8 | (8) | |
| Cramping | 1 | (1) | |
| Diarrhea | 20 | (21) | |
| Gastrointestinal (nonspecific) | 5 | (5) | |
| Nausea | 16 | (17) | |
| Vomiting | 20 | (21) | |
| Generalized | 41 | (43) | |
| Anorexia (loss of appetite) | 3 | (3) | |
| Body ache | 3 | (3) | |
| Chills | 1 | (1) | |
| Dehydration | 1 | (1) | |
| Fatigue | 9 | (9) | |
| Fever | 21 | (22) | |
| Flu-like symptoms | 1 | (1) | |
| Headache | 16 | (17) | |
| Lethargy (lack of energy, tiredness) | 2 | (2) | |
| Myalgia (general achiness, pain) | 1 | (1) | |
| Genitourinary | 1 | (1) | |
| Hematuria (blood in urine) | 1 | (1) | |
| Musculoskeletal | 5 | (5) | |
| Arthralgia (joint pain) | 1 | (1) | |
| Muscle fatigue | 2 | (2) | |
| Muscle pain | 2 | (2) | |
| Musculoskeletal (nonspecifc) | 1 | (1) | |
| Neurologic | 5 | (5) | |
| Confusion | 1 | (1) | |
| Dizziness | 4 | (4) | |
| Memory loss | 1 | (1) | |
| Numbness | 1 | (1) | |
| Parasthesia (tingling sensation) | 1 | (1) | |
| Seizures | 1 | (1) | |
| Weakness | 2 | (2) | |
| Ophthalmologic | 6 | (6) | |
| Eyes, conjuctivitis (pinkeye) | 2 | (2) | |
| Eyes, irritation | 6 | (6) |
Animal illnesses
At least 102,071 animal illnesses were reported to OHHABS for 2022, including 20 domestic pet illnesses and 102,051 wildlife illnesses. Two large marine wildlife illness events that affected fish and other marine animals accounted for most of the animal illnesses; the first event affected at least 100,000 animals and the second affected at least 1,500 animals. Most animal illnesses were classified as probable, including 70% (14) of the 20 domestic pet illnesses and 99% (102,020) of the 102,051 wildlife illnesses (Figure 12). Among 20 domestic pet illnesses and 102,051 wildlife illnesses, the animals most affected were dogs (20, 100%) and fish (101,921, 99.9%), respectively (Figure 13a and Figure 13b). Veterinary care was provided to 95 animals, including 9 (9%) dogs, and 86 (91%) marine mammals such as sea lions and fur seals.
Data describing signs of illness were available for 81 animals (20 dogs and 61 wildlife). For the 20 dog illnesses, the most commonly observed sign categories were gastrointestinal (16, 80%), generalized (13, 65%), and neurologic (10, 50%) (Figure 14a). Vomiting (13, 65%) and lethargy (8, 40%) were the most commonly observed signs in dogs (Table 3a). For the 61 wildlife illnesses, the most commonly observed sign categories were neurologic (55, 90%) and cardiopulmonary (6, 10%) (Figure 14b). The most commonly observed signs in wildlife were ataxia (52, 85%) and labored breathing (6, 10%) (Table 3b). The median time to illness onset was 1.25 hours (0.25–24) for the 14 animals with available information, and the median duration of illness was 2 hours (0.08–72) for 10 dogs with available information. In total, 12,011 (12%) of the animals died. Most of the animal deaths occurred during two large marine wildlife illness events (11,500, 96%).
Figure 12: Proportion of HAB-associated animal illnesses by animal category by classification, 2022
Most animal illnesses reported for 2022 were classified as probable.
* Includes two large wildlife illness events that together affected at least 101,500 animals
**Excludes two large wildlife illness events that together affected at least 101,500 animals
Figure 13a: Reported animal types of HAB-associated animal illnesses, 2022 – including two large marine wildlife mortality events
Most (99%) animal illnesses reported for 2022 were associated with two mortality events affecting at least 101,921 fish and other marine wildlife. All (20, 100%) of the domestic pet illnesses occurred in dogs.
Figure 13b. Reported animal types of HAB-associated animal illnesses, 2022– excluding two large marine wildlife mortality events
When excluding two large wildlife illness events, fish (421, 76%) were still the most reported type of animal that became ill during 2022.
Figure 14a: Signs in HAB-associated domestic pet illnesses, 2022
Gastrointestinal (16, 80%), generalized (13, 65%), and neurologic (10, 50%) signs were the most frequently reported signs for the 20 dog illnesses during 2022.
*Multiple options for animal signs could be selected.
Figure 14b: Signs in HAB-associated wildlife illnesses, 2022
For the 61 wildlife illnesses (fish, birds, mammals), neurologic (55, 90%) and cardiopulmonary (6, 10%) signs were reported during 2022.
*Multiple options for animal signs could be selected.
Table 3a: Signs reported for HAB-associated domestic pet illnesses, 2022
Vomiting (13, 65%), lethargy (8, 40%), and seizures/convulsions (7, 35%) were the most commonly observed signs in the 20 reported dog illnesses.
| Category | Classification | Sign | Frequency | (%)* | |
|---|---|---|---|---|---|
| Domestic pet (dog) | Cardiopulmonary | 2 | (10) | n=20 | |
| Cough | 1 | (5) | |||
| Labored breathing | 1 | (5) | |||
| Dermatologic | 2 | (10) | |||
| Licking paws/toes | 2 | (10) | |||
| Gastrointestinal | 16 | (80) | |||
| Diarrhea | 4 | (20) | |||
| Drooling/Salivation | 4 | (20) | |||
| Jaundice | 1 | (5) | |||
| Lip Licking/Gagging | 1 | (5) | |||
| Vomiting | 13 | (65) | |||
| Generalized | 13 | (65) | |||
| Anorexia (loss of appetite) | 3 | (15) | |||
| Collapse (unable to stand) | 2 | (10) | |||
| Dehydration (refusing water) | 1 | (5) | |||
| Foaming at the mouth | 3 | (15) | |||
| Lethargy | 8 | (40) | |||
| Stumbling | 1 | (5) | |||
| Neurologic | 10 | (50) | |||
| Ataxia (stumbling, loss of balance) | 4 | (20) | |||
| Behavior change | 2 | (10) | |||
| Seizure/Convulsions | 7 | (35) | |||
| Tremors | 1 | (5) | |||
| Ophthalmologic | 1 | (5) | |||
| Eye discharge | 1 | (5) |
*Percentage may add up more to 100 due to rounding
Table 3b: Signs reported for HAB-associated wildlife animal illnesses, 2022
Ataxia (stumbling, loss of balance) (52, 85%) and labored breathing (6, 10%) were the most commonly observed signs in the 61 wildlife illnesses.
| Category | Classification | Sign | Frequency | (%) | |
|---|---|---|---|---|---|
| Wildlife | Cardiopulmonary | 6 | (10) | n=61 | |
| Labored breathing | 6 | (10) | |||
| Neurologic | 55 | (90) | |||
| Ataxia (stumbling, loss of balance) | 52 | (85) | |||
| Behavior change | 2 | (3) | |||
| Seizure/Convulsions | 1 | (2) |
Limitations
Data reported in OHHABS for 2022 are not representative of HAB events or illness occurring in the United States because reporting is voluntary and not all states currently report to this system. States may not report information for HAB events, human illnesses, or animal illnesses due to variability in surveillance capacity, surveillance program scope, or limitations to the environmental or health data available for HAB events. Environmental testing might be limited to availability of testing for one or more toxins. Additionally, the total number of individual animals described in this report underrepresents the total affected or that died during these events. This is because some group animal reports did not provide these numbers or indicated that the number was an underestimate. Summarized data therefore underrepresent HAB events and illnesses that occurred within or across states. The effects of the COVID-19 pandemic on surveillance of HAB events (e.g., bloom detection and monitoring) and illnesses (e.g., exposure to HABs, healthcare seeking behavior) are not known.
Conclusion
Fifteen states reported to OHHABS for 2022. The 2022 data show that HAB events and associated illnesses occur throughout the United States. HAB event and illness reporting primarily characterized environmental data, exposures, and outcomes associated with blooms of cyanobacteria in fresh water. Affected people primarily reported dermatologic, gastrointestinal, and generalized signs and symptoms. Affected animals—specifically dogs—presented with gastrointestinal, generalized, and neurologic signs. Two large wildlife mortality events that together affected at least 101,500 marine animals demonstrates the potential for HAB events to have significant consequences for wildlife and ecosystems. Data from environmental sampling, human illnesses, and animal illnesses highlight the diversity of HAB species, toxins, and health effects associated with HAB events. A One Health approach to surveillance increases the scientific understanding and data available to characterize HAB events and inform illness prevention efforts.
Acknowledgements
CDC would like to thank state and local waterborne disease coordinators, epidemiologists, environmental health practitioners, laboratorians, toxicologists, and animal health practitioners, as well as other partners who were involved in investigating or reporting these data to OHHABS. CDC would like to acknowledge Hannah Lawinger for performing data validation.