
Engineering Controls Database
Guidelines for the Control and Monitoring of Methane Gas on Continuous Mining Operations –Techniques for Measuring Airflow – Anemometers
|
The introduction of conventional mining methods, which increased the rate of mining, was an important step in the mechanization of mining. The intermittent nature of the conventional mining process halted the extraction process for ore-loading and usually allowed time for methane gas to be dispersed. However, the introduction of continuous mining machines in the 1940s produced a constant flow of ore from the working face of the mine and resulted in an increase in methane levels. The number of face ignitions increased as more continuous mining machines were placed underground. Methane levels were found to be dangerously high. In some cases, methane concentrations measured 20 ft from the mining face exceeded the lower explosive limit (5% by volume) [USBM 1958]. The need for better face area ventilation was recognized to reduce the potential for explosions. |
|
|
Excessive levels of methane gas can affect the safety of the underground work force. Available methane control systems have been challenged in recent years by mining developments which include the use of continuous mining machines. Most mining accidents today generally involve only a few individuals. However, the infrequent occurrence of gas explosions puts the lives of the entire underground workforce at risk. In the past 10 years, explosions have led to 65 fatalities and 18 injuries with major explosions occurring at the Sago Mine in West Virginia in 2006 (12 fatalities and 1 injury), the Darby No. 1 Mine in Kentucky in 2006 (5 fatalities and 1 injury) and, most recently, at the Upper Big Branch Mine in West Virginia in 2010 (29 fatalities) [NIOSH 2011]. |
|
|
The U.S. Bureau of Mines (USBM) was formed in 1910 following a series of underground explosions that resulted in many fatalities and injuries [Kirk 1996]. The agency was responsible for conducting scientific research and disseminating information on the extraction, processing, use, and conservation of mineral resources. The USBM research program for mining health and safety was transferred to NIOSH in 1996. Since that time, NIOSH has established a ventilation test gallery where techniques for methane control and monitoring are evaluated under a variety of conditions that simulate airflow near the working face of a continuous mining section. Airflow patterns and methane concentrations are studied in a detailed manner that is not possible in a working underground mine. Anemometers Fresh intake air is needed at the face to dilute and remove methane emitted from the mining face. Effective ventilation requires that sufficient air be delivered to the face to dilute and remove emitted methane. Federal regulation requires that a minimum of 3,000 ft3/min must reach each working face and this quantity must be measured “… at or near the face end of the line curtain, ventilation tubing, or other ventilation control device” [30 CFR 75.325(a)(2)]. For faces with exhaust ventilation, the mean entry air velocity must be measured “…at or near the inby end of the line curtain, ventilation tubing, or other ventilation control device” [30 CFR 75.326]. A study described earlier [Taylor et al. 1999] showed that airflow quantities measured at the mouth of the blowing curtain are usually not good estimates of how much air actually reaches the face. Better estimates of face airflow could be made closer to the face if airflow monitoring equipment was available. Vane anemometers must be aligned with airflow to give accurate readings and do not work well inby the tubing or curtain where air direction is constantly changing. The use of smoke for measuring flow at the face is usually not possible due to flow turbulence. Ultrasonic Anemometers Ultrasonic anemometers are used for collecting surface meteorological data. Accurate readings can be taken in areas where flow is turbulent and velocities are either high or low. One-, two-, and three-axis anemometers were obtained for use in the ventilation test gallery. Sensor heads for the three anemometers are shown in Figure 1. 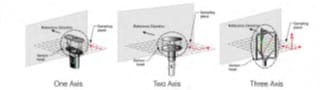 The one-axis anemometer measures flow velocity in the direction of the instrument’s orientation. The two-axis instrument measures flow velocity in the UV plane with a magnitude in the direction of flow equal to the square root of the sum of the squares of the velocity components. The three-axis instrument is also used to measure flow in the UV plane. In addition, the magnitude of the w vector, which is perpendicular to the UV plane, is recorded. Low Air Velocity Measurements The anemometer manufacturer states that instrument resolution is approximately 2 ft/min. NIOSH designed and built a low air velocity apparatus (LAVA) (Figure 2) specifically for testing instrument accuracy at air velocities as low as 2 ft/min [Hall and Timko 2005]. 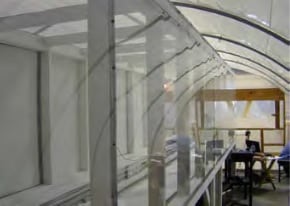 Airflow monitoring instruments are normally evaluated in a wind tunnel where airflow speed and direction can be precisely controlled. Most wind tunnels are designed to direct air over the test instruments at known and constant speeds and cannot be used for velocities less than 30 ft/min. With the LAVA, the instrument moves at a known constant speed through a tunnel in which air is not moving. The LAVA tunnel is 26 ft long, 4 ft wide, and 4 ft high and sealed with plastic to minimize flow in and out of the tunnel. A cart moves along a straight track that runs the length of the tunnel. A synchronous motor operated with a programmable controller moves the cart, designed to hold a one-axis ultrasonic anemometer, along the track at a constant speed. The cart speed, therefore, is equal to the speed of the air passing over the anemometer. Cart speeds were varied from 2 to 20 ft/min. Test results showed: • At 20 ft/min all anemometer readings were within ±25% of the true velocity. • At 10 ft/min, 47% of the readings were within ±25% of the true velocity. • At 5 ft/min, 46% of the readings were within ±25% of the true velocity. • At 2 ft/min, 35% of the readings were within ±25% of the true velocity. Tests in the LAVA were conducted only with the one-axis anemometer. All ultrasonic anemometers use the same type sensors and should provide similar accuracy for low air velocity measurements. Comparing Instrument Airflow Readings in the Ventilation Test Gallery Two identical three-axis anemometers (labeled A and B) were placed behind the curtain in the ventilation test gallery (Figure 3) and exposed to the same airflows [Taylor et al. 2002, 2003]. The objective was to determine the variation in readings between the two instruments. 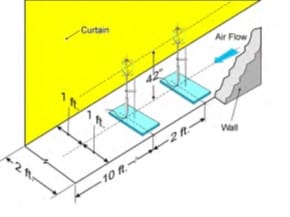 Velocities behind the curtain ranged from 100 to 700 ft/min. Flow velocities were adjusted by opening or shutting the regulator doors. A round bubble gauge was used to position the anemometers vertically. The sensor heads were placed at the center of the area behind the curtain and rotated so the reference arrows on the heads were aligned with the airflow direction. For each test, airflow data were collected for 3 minutes, the instrument positions were reversed, and the tests were repeated. Figure 4 shows the average velocities measured with the two instruments. 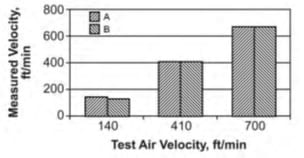 • Average readings varied by less than 5 ft/min for velocities of 410 and 700 ft/min. • Average readings varied by less than 15 ft/min when the velocity was 140 ft/min. An examination of the real time velocity data showed flow varied more for the lowest velocity. The effect of wind speed and direction outside the test gallery on ventilation inside the test gallery appeared to be greater when airflow entering the test gallery was less. Comparison of One-, Two-, and Three-Axis Anemometers Behind the Blowing Curtain In a second series of tests, one-, two-, and three-axis anemometers were individually placed at the same locations behind the curtain and exposed to the same airflows for 3 minutes. In each case, the instruments were oriented vertically with the sensor heads oriented in the direction of the airflow. • One-, two-, and three-axis anemometers gave approximately the same readings when exposed to the same airflow behind the blowing curtain. Instrument Orientation For all measurements made behind the blowing curtain, the instruments were oriented vertically with reference arrows pointed toward the face. Tests were conducted to determine how instrument orientation affects flow velocity readings [Hall and Timko 2005]. Effect of Yaw Angle Yaw angle is defined as the number of degrees an instrument is rotated in the clockwise direction from a reference direction (Figure 5). One-, two-, and three-axis anemometers were individually placed behind the curtain and exposed to an air velocity of approximately 400 ft/min. The first velocity measurement was made with the reference mark on the instrument pointed toward the face. Additional readings were taken as the instrument was rotated clockwise in 10-degree increments (Figure 6). 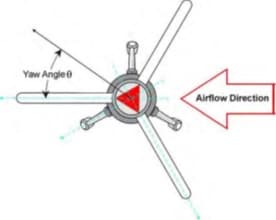 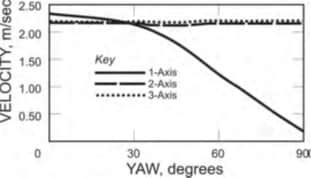 • Two- and three-axis velocity readings were unaffected by changes in yaw angle. • One-axis velocity readings decreased when the yaw angle increased above 20%. The results were similar to those obtained by Boshkov and Wayne [1995] who, using a 3-inch rotating vane anemometer (a one-axis instrument), showed that yaw angles up to 20 degrees do not affect the registered velocity. • Single-axis instruments should only be used to make flow velocity readings when flow direction is known and the instrument can be oriented in the direction of the flow. Effect of Tilt Angle Tilt angle is defined as the number of degrees an instrument is slanted into the direction of the airflow (Figure 7). Starting from a vertical position, each anemometer was incrementally tilted to angles up to 90 degrees. The results are shown in Figure 8. 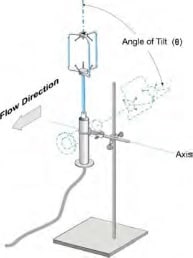 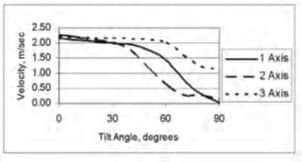 • All velocity measurements decreased with increasing tilt angle, but the patterns were different for each instrument. The differences are believed to be due to the structures of sensor heads, which affect flow patterns. For each tilt angle, the flow is partially obstructed by the physical structure of the sensor head. • All the instruments should be oriented vertically to minimize effects of tilt angle on readings. However, tilt angles less than 30 degrees will not have a significant effect on instrument readings. Flow Readings with One-, Two-, and Three- Axis Anemometers at the Mining Face Airflow direction behind the blowing curtain is relatively constant. Airflow between the curtain mouth and the face is constantly changing. A series of measurements were taken with the anemometers placed at three locations 2 ft from the face of the ventilation test gallery [Hall et al. 2007] (Figure 9). 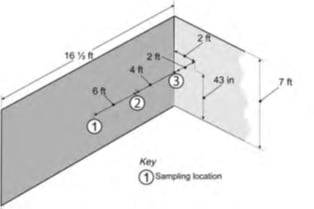 The instruments were positioned vertically and with reference arrows pointed toward the face. Air velocity measured at the mouth of the blowing curtain (35-ft setback) was maintained at 400 ft/min. The anemometers were rotated between the three sampling locations, and the tests were repeated. The average velocity readings for the three locations are shown in Figure 10. 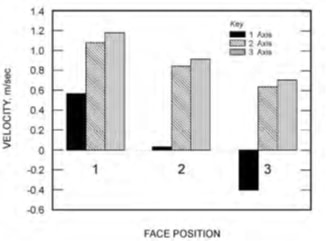 • Measurements with the one-axis instrument were much lower than readings from the two- and three-axis instruments; and at location 3 on the right side of the cutting head at the face (Figure 9), measurements with the one-axis instrument were negative (indicating flow away from the face). o Velocity differences were due to alignment of the instrument with the face. The average direction of flow varied across the face (Figure 11). On the right (return air) side of the entry where flow was directed away from the face, the velocity measured by the one-axis instrument was negative. 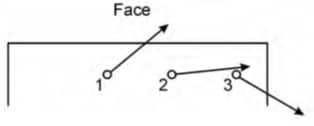 • Velocities measured with the two- and three-axis instruments were similar, but differed more than the readings taken behind the curtain. o Flow behind the curtain was primarily in a horizontal plane, but a significant vertical flow (i.e., “w” component) existed at the face which increased the velocity measured with the three-axis instrument. |
|
|
Boshkov S, Wayne MT [1995]. Errors in underground air measurements. Min Eng, Vol. 47, pp. 1047–1053. CFR. Code of Federal Regulations. Washington, DC: U.S. Government Printing Office, Office of the Federal Register. Hall EE, Timko RJ [2005]. Determining the accuracy of low velocity airflow measurements. Presented at the SME Annual Meeting, Salt Lake City, Utah, February 28–March 3, Preprint 05-80. Hall ED, Taylor CD, Chilton JE [2007]. Using ultrasonic anemometers to evaluate face ventilation conditions. Presented at the SME Annual Meeting, Denver, Colorado, February 25–28, Preprint 07-096. Kirk WS [1996]. The history of the Bureau of Mines. In: U.S. Bureau of Mines Minerals Yearbook, 1994. Washington, DC: U.S. Bureau of Mines. NIOSH [2011]. Ventilation and explosion prevention highlights. [http://www.cdc.gov/niosh/mining/highlights/programareahighlights16.html] Taylor CD, Thimons ED, Zimmer JA [1999]. Comparison of methane concentrations at a simulated coal mine face during bolting. Mine Vent. Soc. of SA 52(2):48–52. Taylor CD, Chilton JE, Mal T [2002]. Evaluating performance characteristics of machine-mounted methane monitors by measuring response time. In: de Souza E, ed. Mine ventilation: proceedings of the North American/Ninth U.S. Mine Ventilation Symposium. Lisse, The Netherlands: Swets & Zeitlinger, pp. 315-321. Taylor CD, Timko RJ, Senk MJ, Lusin A [2003]. Measurement of airflow in a simulated underground mine environment using an ultrasonic anemometer. Presented at the SME Annual Meeting, Cincinnati, OH, February 24–26, Preprint 03-065. USBM [1958]. Auxiliary ventilation of continuous miner places. By Stahl RW. Washington, DC: U.S. Bureau of Mines, Report of Investigations, No. 5414. |
|
|
coal mining continuous mining operations deep-cut mining miners |
|
|
The above control information is taken directly from the following publication: NIOSH [2010]. Information circular 9523. Guidelines for the control and monitoring of methane gas in continuous mining operations. Morgantown, WV: U.S. Department of Health and Human Services, Centers for Disease Control and Prevention, National Institute for Occupational Safety and Health, DHHS (NIOSH) Publication No. 2010-141. |