Summary of Notifiable Diseases, United States, 1997
Foreword
MMWR Summary of Notifiable Diseases, United States, 1997
This publication contains summary tables of the official
statistics
for the reported occurrence of nationally notifiable diseases in
the United
States for 1997. These statistics are collected and compiled from
reports
to the National Notifiable Diseases Surveillance System (NNDSS),
which is
operated by CDC in collaboration with the Council of State and
Territorial
Epidemiologists (CSTE). Because the dates of onset or diagnosis for
notifiable diseases are not always reported, these surveillance
data are
presented by the week they were reported to CDC by public health
officials
in state and territorial health departments. These data are
finalized and
published in the MMWR Summary of Notifiable Diseases, United States
for use
by state and local health departments; schools of medicine and
public
health; communications media; local, state, and federal agencies;
and other
agencies or persons interested in following the trends of
reportable
diseases in the United States. The annual publication of the
Summary also
documents which diseases are considered national priorities for
notification and the annual number of cases of such diseases.
The Highlights section presents information on selected
nationally
notifiable and non-notifiable diseases to provide a context in
which to
interpret surveillance and disease-trend data and to provide
further
information on the epidemiology and prevention of selected
diseases.
Part 1 contains information regarding morbidity for each of
the
diseases considered nationally notifiable during 1997. The tables
provide
the number of cases of notifiable diseases reported to CDC for
1997, as
well as the distribution of cases by month and geographic location
and by
patient's age, sex, race, and Hispanic ethnicity. The data are
final totals
as of July 25, 1998, unless otherwise noted. Because no cases of
anthrax or
yellow fever were reported in the United States during 1997, these
nationally notifiable diseases do not appear in the tables in Part
1.
Nationally notifiable diseases that are reportable in fewer than 40
states
also do not appear in these tables. In all tables, leprosy is
listed as
Hansen disease, and tickborne typhus fever is listed as Rocky
Mountain
spotted fever (RMSF).
Part 2 contains graphs and maps. These graphs and maps depict
summary
data for many of the notifiable diseases described in tabular form
in Part
Part 3 contains tables that list the number of cases of
notifiable
diseases reported to CDC since 1966. It also includes a table
enumerating
deaths associated with specified notifiable diseases reported to
the
National Center for Health Statistics, CDC during 1987-1996.
Background
As of January 1, 1997, 52 infectious diseases were designated
as
notifiable at the national level. A notifiable disease is one for
which
regular, frequent, and timely information regarding individual
cases is
considered necessary for the prevention and control of the disease.
This
section briefly summarizes the history of the reporting of
nationally
notifiable diseases in the United States.
In 1878, Congress authorized the U.S. Marine Hospital Service
(i.e.,
the forerunner of the Public Health Service {PHS}) to collect
morbidity
reports regarding cholera, smallpox, plague, and yellow fever from
U.S.
consuls overseas. The intention was to use this information to
institute
quarantine measures to prevent the introduction and spread of these
diseases into the United States. In 1879, a specific Congressional
appropriation was made for the collection and publication of
reports of
these notifiable diseases. Congress expanded the authority for
weekly
reporting and publication of these reports in 1893 to include data
from
states and municipal authorities. To increase the uniformity of the
data,
Congress enacted a law in 1902 directing the Surgeon General to
provide
forms for the collection and compilation of data and for the
publication of
reports at the national level. In 1912, state and territorial
health
authorities -- in conjunction with PHS -- recommended immediate
telegraphic
reporting of five infectious diseases and the monthly reporting, by
letter,
of 10 additional diseases. The first annual summary of The
Notifiable
Diseases in 1912 included reports of 10 diseases from 19 states,
the
District of Columbia, and Hawaii. By 1928, all states, the District
of
Columbia, Hawaii, and Puerto Rico were participating in national
reporting
of 29 specified diseases. At their annual meeting in 1950, state
and
territorial health officers authorized the Conference of State and
Territorial Epidemiologists (CSTE), whose purpose was to determine
which
diseases should be reported to PHS. In 1961, CDC assumed
responsibility for
the collection and publication of data concerning nationally
notifiable
diseases.
The list of nationally notifiable diseases is revised
periodically.
For example, a disease might be added to the list as a new pathogen
emerges, or a disease might be deleted as its incidence declines.
Public
health officials at state health departments and CDC continue to
collaborate in determining which diseases should be nationally
notifiable.
CSTE, with input from CDC, makes recommendations annually for
additions and
deletions. However, reporting of nationally notifiable diseases to
CDC by
the states is voluntary. Reporting currently is mandated (i.e., by
legislation or regulation) only at the state and local level. Thus,
the
list of diseases considered notifiable varies slightly by state.
All states
generally report the internationally quarantinable diseases (i.e.,
cholera,
plague, and yellow fever) in compliance with the World Health
Organization's International Health Regulations.
The list of 52 infectious diseases designated as notifiable at
the
national level during 1997 is as follows: Table_A
Data Sources
Provisional data concerning the reported occurrence of
notifiable
diseases are published weekly in MMWR. After each reporting year,
staff in
state health departments finalize reports of cases for that year
with local
or county health departments and reconcile the data with reports
previously
sent to CDC throughout the year. These data are compiled in final
form in
this summary. Notifiable disease reports (which are published in
the annual
MMWR Summary of Notifiable Diseases only after approval by the
appropriate
epidemiologist from each submitting state or territory) are the
authoritative and archival counts of cases. Data published in MMWR
Surveillance Summaries or other surveillance reports produced by
CDC
programs, which are useful for detailed epidemiologic analyses, may
not
agree exactly with data reported in the annual Summary of
Notifiable
Diseases because of differences in the timing of reports, the
source of the
data, and the case definitions.
Data in this summary were derived primarily from reports
transmitted
to the Division of Public Health Surveillance and Informatics,
Epidemiology
Program Office, CDC, by the 50 state, two city, and five
territorial health
departments through the National Electronic Telecommunications
System for
Surveillance (NETSS). (More information regarding NETSS and
notifiable
diseases, including case definitions for these conditions, is
available on
the Internet at http://www.cdc.gov/epo/phs.htm.) Final data for
other
diseases are from the surveillance program records of the following
CDC
programs (requests for further information regarding these data
should be
directed to the source specified):
National Center for Health Statistics (NCHS)
Office of Vital and Health Statistics Systems (deaths from
selected
notifiable diseases)
National Center for Infectious Diseases (NCID)
Division of Bacterial and Mycotic Diseases (toxic-shock
syndrome and
laboratory data regarding botulism, Escherichia coli
O157:H7,
Salmonella, and Shigella)
Division of Vector-Borne Infectious Diseases (laboratory data
regarding
arboviral encephalitis)
Division of Viral and Rickettsial Diseases (animal rabies)
National Center for HIV, STD, and TB Prevention (NCHSTP)
Division of HIV/AIDS Prevention -- Surveillance and
Epidemiology
chlamydia, gonorrhea, and syphilis)
Division of Tuberculosis Elimination (tuberculosis)
National Immunization Program (NIP)
Epidemiology and Surveillance Division (poliomyelitis)
Disease totals for the United States, unless otherwise stated,
do not
include data for American Samoa, Guam, Puerto Rico, the Virgin
Islands, or
the Commonwealth of the Northern Mariana Islands (CNMI). Disease
totals
from American Samoa were unavailable for 1997.
Population estimates for states are based on the July 1, 1997,
post-censal estimates made by the U.S. Department of Commerce,
Economics
and Statistics Administration, Bureau of the Census, Population
Division,
Population Branch, Press Release PLL91. Population estimates for
territories are 1997 estimates from the Bureau of the Census, Press
Releases CB98-54 and CB98-80.
Rates in this summary were based on data for the U.S.
total-resident
population. However, population data from states in which diseases
were not
notifiable or disease data were not available were excluded from
rate
calculations.
Interpreting Data
The data reported in this summary are useful for analyzing
disease
trends and determining relative disease burdens. However, these
data must
be interpreted in light of reporting practices. Some diseases that
cause
severe clinical illness (e.g., plague and rabies), if diagnosed by
a
clinician, are most likely reported accurately. However, persons
who have
diseases that are clinically mild and infrequently associated with
serious
consequences (e.g., salmonellosis) might not seek medical care from
a
health-care provider. Even if these less severe diseases are
diagnosed,
they are less likely to be reported. The degree of completeness of
reporting also is influenced by the diagnostic facilities
available; the
control measures in effect; the public awareness of a specific
disease; and
the interests, resources, and priorities of state and local
officials
responsible for disease control and public health surveillance.
Finally,
factors such as changes in the case definitions for public health
surveillance, the introduction of new diagnostic tests, or the
discovery of
new disease entities can cause changes in disease reporting that
are
independent of the true incidence of disease.
Public health surveillance data are published for selected
racial and
ethnic population groups because these variables can be risk
markers for
certain notifiable diseases. Risk markers can identify potential
risk
factors for investigation in future studies. Data regarding race
and
ethnicity also can be used to identify populations to target for
prevention
efforts. However, one also must use caution when drawing
conclusions from
reported data relating to race and ethnicity. Among certain races
and
ethnicities, there are likely to be differential patterns of access
to
health care, interest in seeking health care, and detection of
disease that
would lead to data not representative of disease incidence in these
populations. In addition, not all data concerning race and
ethnicity are
collected uniformly for all diseases. For example, the Division of
HIV/AIDS
Prevention -- Surveillance and Epidemiology and the Division of
Sexually
Transmitted Diseases Prevention in the National Center for HIV,
STD, and TB
Prevention (NCHSTP) collect information regarding race and
ethnicity using
a single variable. A person's racial and ethnic background is
reported as
either American Indian/Alaska Native, Asian/Pacific Islander, Black
non-Hispanic, White non-Hispanic, or Hispanic. Additionally,
although the
recommended standard for classifying a person's race or ethnicity
is based
on self-reporting, this procedure might not always be followed.
Highlights for 1997
The Highlights section presents information on the public
health
importance of selected nationally notifiable and non-notifiable
diseases,
including a) domestic and international disease outbreaks; b)
active
surveillance findings; c) changes in data reporting practices; d)
the
impact of prevention programs; e) the emergence of antimicrobial
resistance; and f) changes in immunization policies. This
information is
intended to provide a context in which to interpret surveillance
and
disease-trend data and to provide further information on the
epidemiology
and prevention of selected diseases.
Highlights for Selected Nationally Notifiable Diseases
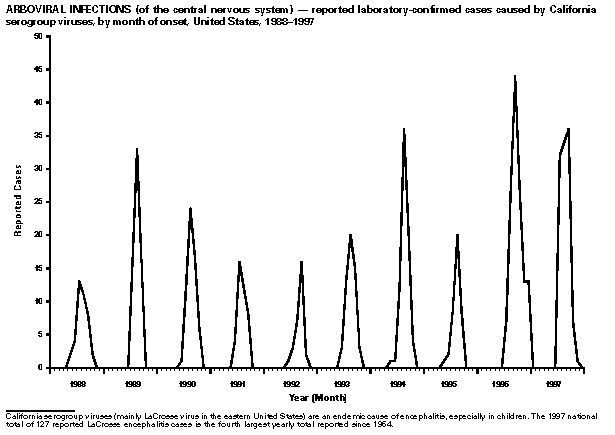
Arboviral Encephalitis
The 1997 national total of 127 confirmed or probable California
serogroup viral encephalitis cases (all of which were La Crosse
encephalitis cases) is the fourth largest yearly total of such
cases
reported since 1964. The 73 case reports from West Virginia (57% of
the
national total) represent that state's largest total and an
increase of 11%
over its 1996 total. Much of the increase in reports from West
Virginia may
be attributable to this state's recent implementation of an active
surveillance system for this disease. La Crosse encephalitis is
endemic in
the eastern United States, where it is associated with exposure to
deciduous forests and Aedes triseriatus (the eastern treehole
mosquito). A
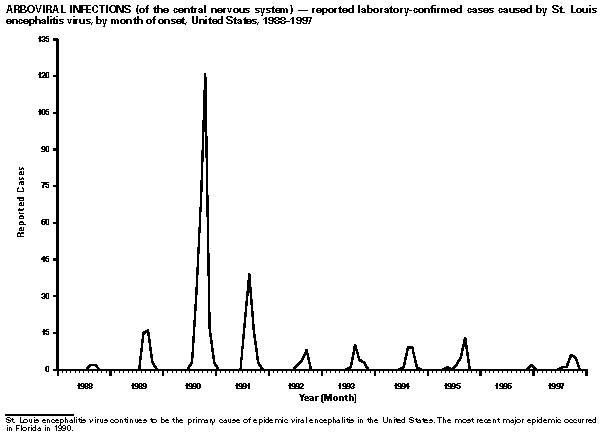
summertime/autumnal outbreak of St. Louis encephalitis in central
Florida
accounted for nine of the 13 cases reported nationally in 1997. The
last
major epidemic of St. Louis encephalitis in the United States (223
cases
and 11 deaths) occurred in Florida in 1990. St. Louis encephalitis
affects
persons in portions of both the eastern and western United States.
In
Florida, the primary mosquito vector of St. Louis encephalitis
virus is
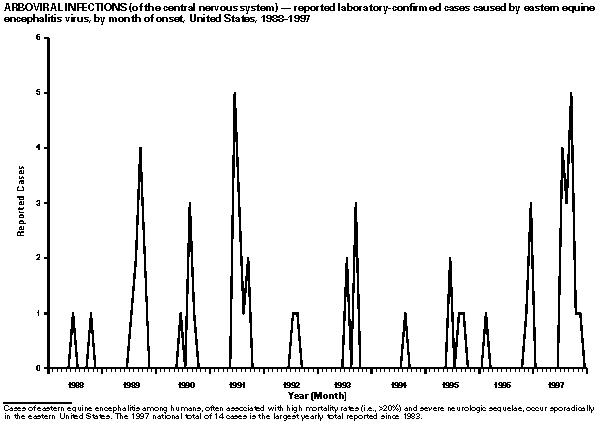
Culex nigripalpus. Fourteen cases of eastern equine encephalitis
among
humans were reported in 1997 from the South (12 cases), New England
(one
case), and the Upper Midwest (one case). Eastern equine
encephalitis virus
is typically transmitted to humans by various Aedes mosquito
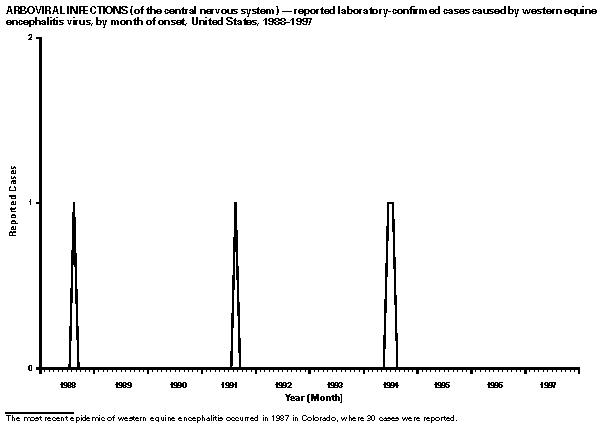
species. No
cases of western equine encephalitis among humans have been
reported
nationally since 1994. The primary mosquito vector of western
equine
encephalitis virus in the western United States is Culex tarsalis.
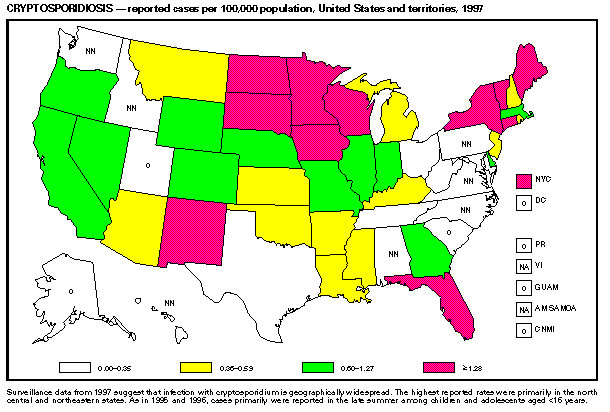
Cryptosporidium
National reporting for cryptosporidiosis began in 1995 with
2,972 cases
reported from 27 states. During 1996, as cryptosporidiosis became a
reportable disease in an increased number of states, 2,426 cases
were
reported from 42 states. In 1997, a total of 2,566 cases were
reported from
45 states. Because the diagnosis of cryptosporidiosis is often not
considered, and because laboratories do not routinely test for
Cryptosporidium infection, cryptosporidiosis continues to be
underdiagnosed
and underreported.
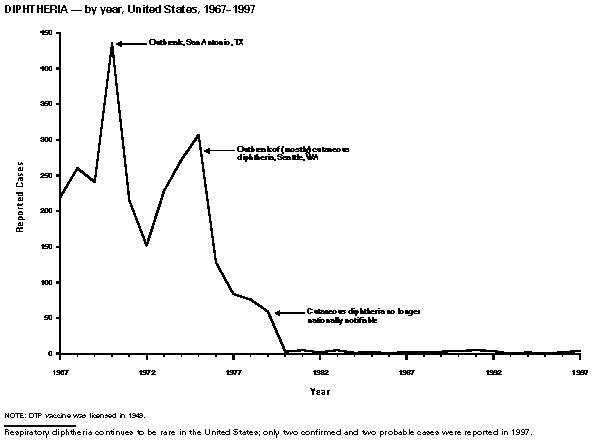
Diphtheria
Four cases of diphtheria were reported in the United States in
1997;
two persons, both with localized mild illness, had
culture-confirmed
diphtheria. One confirmed case was caused by infection with a
toxigenic
strain of Corynebacterium diphtheriae, and was reported from a
known
endemic focus in South Dakota (MMWR 1997;46:506-10); one case
caused by
nontoxigenic C. diphtheriae was reported from Oregon. Two probable
cases
were reported from Nevada. Both case-patients had acute membranous
pharyngitis; oropharyngeal specimens were positive for diphtheria
toxin by
polymerase chain reaction, but bacterial cultures of these
specimens were
negative.
In 1997, more than 7,000 cases of diphtheria were reported in
an
ongoing diphtheria epidemic in the New Independent States of the
former
Soviet Union. No importations were reported in the United States.
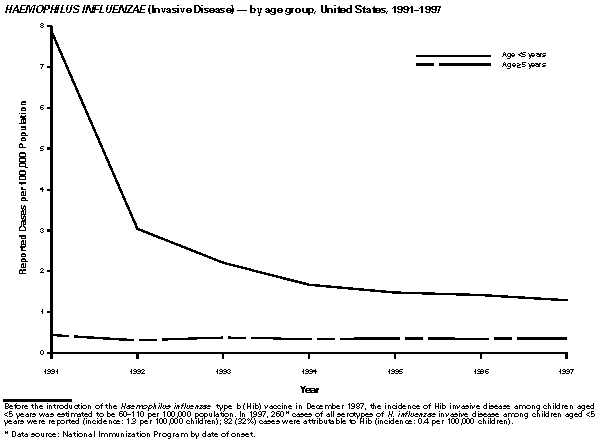
Haemophilus Influenzae (Invasive Disease)
In 1997, a total of 260 cases of Haemophilus influenzae (Hi)
invasive
disease among children aged less than 5 years were reported. (Data
were
provided by the National Immunization Program and were based on
date of
onset, not MMWR week.) An estimated 20,000 cases of Haemophilus
influenzae
type b (Hib) invasive disease among children occurred annually
prior to Hib
vaccine licensure in 1987. (JAMA 1993;269:221-6) The dramatic
decline is
attributed to the widespread administration of the Hib vaccine to
preschool-aged children. Of the 260 cases, 201 (77%) isolates were
serotyped, and 82 (41%) of the isolates for which serotype was
known were
type b. Of the 82 cases of Hib invasive disease reported in
children aged
less than 5 years, 42 (51%) were aged less than 6 months, which is
too
young to have completed a three-dose primary Hib vaccination.
However, 27
(68%) of the 40 children who were old enough (aged greater than or
equal to
6 months) to have completed a three-dose primary series before they
developed Hib invasive disease were incompletely vaccinated or
their
vaccination status was unknown. These cases might have been
prevented with
age-appropriate vaccination.
Hantavirus Pulmonary Syndrome
In 1997, a total of 21 cases of Hantavirus pulmonary syndrome
(HPS)
were reported. HPS is a pan-American viral zoonosis caused by Sin
Nombre
virus and other New World hantaviruses, which in the United States,
include
Bayou virus, Black Creek Canal virus, and New York-1 virus. The
identified
rodent reservoirs for Sin Nombre, New York-1, Black Creek Canal,
and Bayou
viruses are, respectively, Peromyscus maniculatus (deer mouse),
Peromyscus
leucopus (white-footed mouse), Sigmodon hispidus (cotton rat), and
Oryzomys
palustris (rice rat). Cases of HPS have been found in the
continental
United States, Canada, Argentina, Brazil, Chile, Paraguay, and
Uruguay. As
of March 31, 1998, national surveillance for HPS has identified 179
confirmed cases in 29 states (case-fatality ratio = 44.7%).
Hemolytic Uremic Syndrome
Post-diarrheal hemolytic uremic syndrome (HUS) is a
life-threatening
illness characterized by hemolytic anemia, thrombocytopenia, and
renal
injury. Nearly all cases in the United States are caused by
infection with
Shiga toxin-producing Escherichia coli, with serotype O157:H7 being
predominant. In 1997, the second year of national reporting, 20
states
reported 93 cases of post-diarrheal HUS to CDC. By comparison, 18
states
reported 104 cases in 1996. The median age of patients was 4 years
(range:
1-89 years), with females accounting for 62% of patients overall.
Illness
was seasonal, with 50% of cases occurring during July through
September.
Hepatitis A
In 1996, the Advisory Committee on Immunization Practices
(ACIP) issued
recommendations for the prevention of hepatitis A through active or
passive
immunization (MMWR 1996;45{No. RR-15}). The report provides
recommendations
for use of the hepatitis A vaccines (i.e., HAVRIX , manufactured by
SmithKline Beecham Biologicals, and VAQTA , manufactured by Merck &
Company, Inc.). For communities with high rates of hepatitis A and
periodic
outbreaks (peak rates: 700 reported cases per 100,000 population),
routine
vaccination of children aged 2 years and catch-up vaccination of
older
children is recommended. To control outbreaks in communities with
intermediate rates of hepatitis A (i.e., 50-200 reported cases per
100,000
population), vaccination programs targeting subpopulations with the
highest
rates of disease may be considered. In these communities, ongoing
routine
vaccination of young children should be implemented to prevent
future
outbreaks.
Hepatitis C
Hepatitis C virus (HCV) infection is the most common bloodborne
infection in the United States. Based on data from the CDC Sentinel
Counties Study of Viral Hepatitis, it is estimated that as many as
180,000
new HCV infections occurred each year during the 1980s. Since 1989,
the
annual number of new infections has declined by 80%. However, in
1996, data
from the third National Health and Nutrition Examination Survey,
conducted
from 1988 through 1994, indicated that approximately 4 million
Americans
(1.8%) are infected with HCV. Many of these chronically infected
persons
might not be aware of their infection or be clinically ill, because
symptoms of hepatitis C-related chronic liver disease might not
develop for
10-20 years after infection. However, such persons can infect
others and
are at risk for chronic liver disease or other HCV-related chronic
diseases. Cirrhosis develops in 10%-20% of persons with HCV-related
chronic
hepatitis during the first two decades after infection, and
8,000-12,000
persons die from HCV-related chronic liver disease each year. CDC
recently
published new guidelines for HCV prevention and control (MMWR
1998;47{No.
RR-19}).
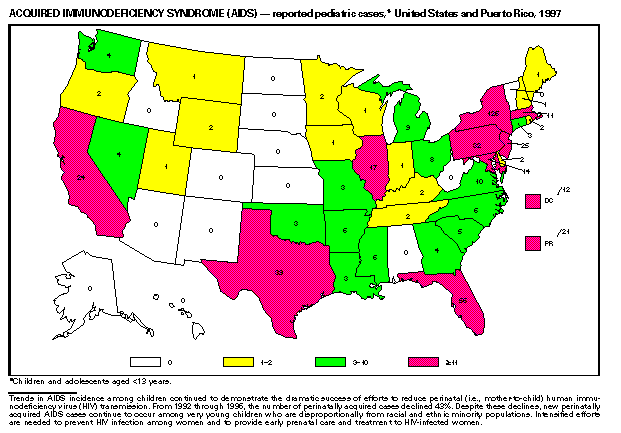
HIV Infection in Children and Infants
In 1997, reports based on AIDS surveillance data indicated
substantial
declines in perinatally acquired AIDS, reflecting declining
perinatal HIV
transmission. HIV surveillance data indicated that the increasing
use of
zidovudine was temporally associated with this substantial decline
in
perinatally acquired AIDS (MMWR 1997;46:1086-92). These data
demonstrate
success in nationwide efforts to implement Public Health Service
guidelines
for use of zidovudine to reduce perinatal HIV transmission (MMWR
1994;43{No. RR-11}); MMWR 1998;47{No. RR-2}) and routine, voluntary
prenatal HIV testing (MMWR 1995;44{No. RR-7}). States that conduct
surveillance of perinatally exposed and infected children can
evaluate the
impact of the guidelines more completely and document resources
needed to
care for perinatally exposed infants. In 1997, a total of 30 states
conducted surveillance of HIV infection in children, reporting 258
HIV-infected children who had not progressed to AIDS and 200
children who
had AIDS. These states also received 2,238 new reports of
perinatally
exposed children who required follow up with health-care providers
to
determine their HIV infection status.
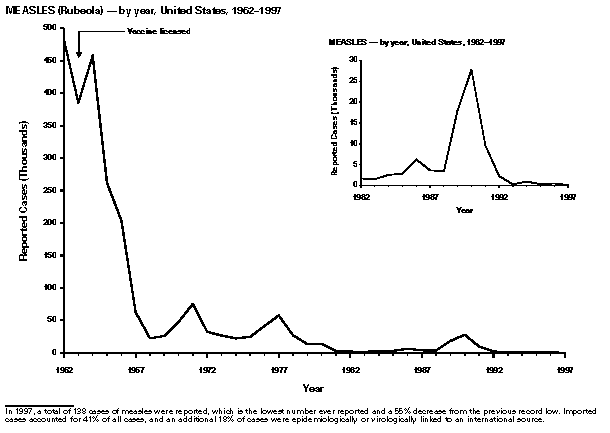
Measles
A total of 138 laboratory-confirmed cases of measles were
reported to
CDC in 1997, which is the lowest number of measles cases reported
in one
year and is less than half the previous record low. Of the 138
cases
reported, 57 (41%) were international importations, and exposure to
these
cases resulted in 17 (12%) additional cases. Thus, 74 (54%) cases
were
associated with importation. An additional seven cases had
virologic
evidence suggesting an imported measles virus. Fifty-four (41%)
measles
patients were aged less than 5 years, 39 (28%) were aged 5-19
years, and
42 (30%) were aged greater than or equal to 20 years. Thirty-two
patients
(23%) reported having been vaccinated; seven (5%) received two
doses. A
total of 13 outbreaks were reported, with the largest involving
eight
cases. In 1997, no confirmed measles cases were reported from 21
states,
and fewer than five cases were reported from 20 states and the
District of
Columbia.
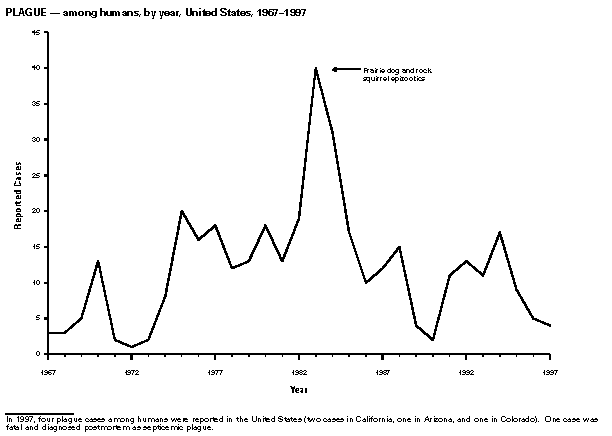
Plague
In 1997, four plague cases among humans were reported in the
United
States (two cases in California, one in Arizona, and one in
Colorado). One
case was fatal and, like two fatal cases that occurred in 1996,
septicemic
plague was diagnosed postmortem. Each of these cases, which
occurred in
plague-endemic areas, illustrates the need for health-care
providers to
maintain a high level of awareness about the risks of human plague.
Of the
350 cases reported in the United States from 1970 through 1997,
approximately 80% were reported from the southwestern states of New
Mexico,
Arizona, and Colorado; 9% were reported from California; and nine
other
western states reported limited numbers of cases. Plague also
occurs in
animal populations in four other western states that have not
reported
cases among humans, including Kansas, where Yersinia
pestis-infected
prairie dog fleas were identified in 1997. This is the first report
of
plague in an animal in Kansas since 1950; however, a nearby county
in
Oklahoma experienced one case among a person in 1991, and other
Great
Plains states have reported epizootic activity in recent years
(MMWR
1994;43:242-6). Internationally, outbreaks of rat-associated plague
occurred in the port city of Mahajanga, Madagascar from 1995
through 1997.
These are the first port-related outbreaks to be reported from that
country
in decades. Researchers reported the first case of
multidrug-resistant Y.
pestis in 1997. This isolate, which was obtained in 1995 from a
case in
Madagascar, contained a plasmid that conferred resistance to
antibiotics
commonly prescribed for plague treatment or prophylaxis (e.g.,
streptomycin, chloramphenicol, and tetracycline) (N Engl J Med
1997;337:677-80, 702-4).
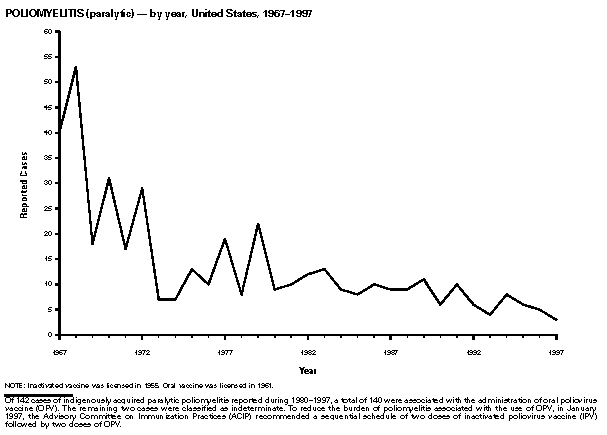
Poliomyelitis
In 1997, the Advisory Committee on Immunization Practices
(ACIP)
recommended a change in routine childhood vaccination policy for
polio in
the United States. The previously recommended schedule of four
doses of
attenuated oral poliovirus vaccine (OPV) was changed to a
sequential
schedule of two doses of inactivated poliovirus vaccine (IPV)
followed by
two doses of OPV for routine vaccination of children. Since 1980, a
total
of 147 cases have been reported, of which 139 were associated with
the use
of OPV. The last imported case was reported in 1993.
Streptococcal Disease, Invasive, Group A
According to reports from active surveillance programs in five
states
(i.e., California, Connecticut, Georgia, Minnesota, and Oregon),
the
incidence of invasive group A streptococcal disease during 1997 was
4.1
cases/100,000 population; disease incidence ranged from 2.2 to 5.1
cases/100,000 population among the surveillance areas.
Streptococcal toxic
shock syndrome and necrotizing fasciitis accounted for
approximately 6.9%
and 7.7% of invasive cases, respectively. Overall case-fatality
among
patients with invasive group A streptococcal disease was 13%;
case-fatality
rates were higher among patients with streptococcal toxic shock
syndrome
and necrotizing fasciitis (43% and 21%, respectively). Risk factors
for
invasive group A streptococcal disease include elderly age, HIV
infection,
diabetes, cancer, alcohol abuse, and varicella infection.
Streptococcus pneumoniae, Drug-Resistant
The proportion of drug-resistant Streptococcus pneumoniae
isolates
continues to increase, according to reports from active
surveillance
programs in seven states (i.e., California, Connecticut, Georgia,
Maryland,
Minnesota, Oregon, and Tennessee). During 1997, approximately 26%
of
pneumococcal isolates obtained from sterile sites were no longer
susceptible to penicillin (mean inhibitory concentration {MIC}
greater
than or equal to 0.1 ug/mL). In 1997, the proportion of all
isolates with
high-level penicillin resistance (MIC greater than or equal to 2
ug/mL),
increased from 12% in 1996 to 14.4%; a total of 7.2% of isolates
had MICs
greater than or equal to 4 ug/mL compared with 5.4% in 1996. The
resistant
proportion varied widely by geographic region. To limit the
contribution of
unnecessary antimicrobial use to the spread of drug-resistant S.
pneumoniae, CDC and the American Academy of Pediatrics issued
recommendations for judicious use of antimicrobial agents for
upper-respiratory-tract infections among children (Pediatrics
1998;101{suppl}). Educational materials concerning the principles
of
judicious antimicrobial use can be obtained by calling the National
Center
for Infectious Diseases at (404) 639-4702 for an order form.
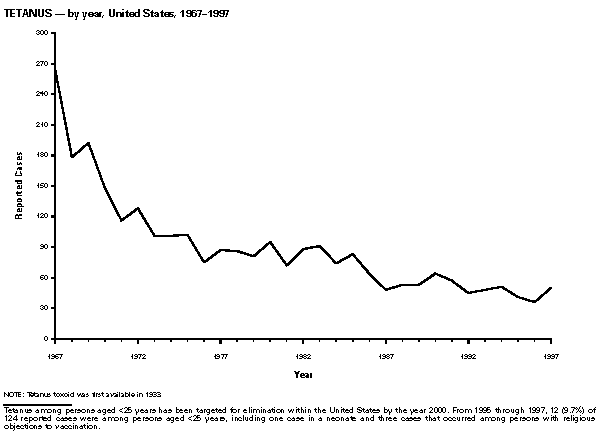
Tetanus
Fifty cases of tetanus were reported in 1997. During 1995-1997,
an
average annual incidence of 41 cases were reported, the lowest ever
reported since national tetanus surveillance began in 1947. The
average
annual incidence of 0.15 cases per million population represents a
slight
decline from the incidence of 0.2 cases per million population
reported
during 1991-1994.
Highlights for Selected Non-Notifiable Diseases
Cyclosporiasis
In 1997, several outbreaks of cyclosporiasis associated with
various
types of fresh produce (e.g., raspberries, mesclun lettuce, and
basil)
occurred in the United States. In the largest outbreak, which was
associated with consumption of fresh raspberries, 41 clusters with
a total
of 762 cases (25% were laboratory confirmed) were reported by 13
states,
the District of Columbia, and one province in Canada.
Dengue
Fifty-six laboratory-positive cases of dengue were imported
into the
United States in 1997 and diagnosed at the CDC Dengue Branch. This
number
represents a 30% increase from the number of laboratory-confirmed
cases
reported in 1996 (n=43). Similarly, the total number of dengue and
dengue
hemorrhagic fever (DHF) cases reported by Pan American Health
Organization
member countries in 1997 (n=364,945) was 46% higher than the 1996
total
(n=250,707). Autochthonous dengue cases (n=3) were documented in
south
Texas again in 1997, underscoring the risk of dengue transmission
in
southern gulf coast states where mosquito vectors occur. After a
15-year
absence, dengue cases were reported from Cuba in 1997. The
municipality of
Santiago de Cuba experienced an outbreak with 2,946
laboratory-diagnosed
cases and 205 DHF cases, which resulted in 12 deaths.
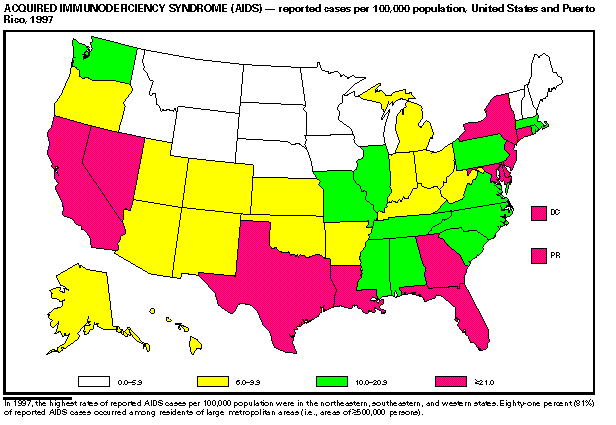
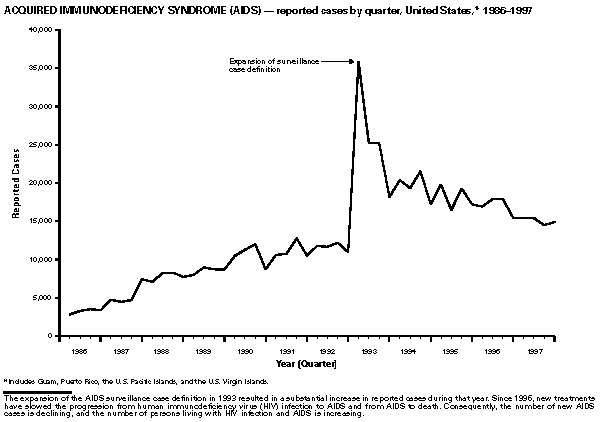
HIV Infection in Adults
In June 1997, HIV-infection reporting for adults (i.e., persons
aged
greater than or equal to 13 years) was added to the list of
nationally
notifiable diseases at a Council of State and Territorial
Epidemiologists
(CSTE) meeting. During 1997, reports based on acquired
immunodeficiency
syndrome (AIDS) surveillance data highlighted substantial declines
in AIDS
incidence and deaths. As a result of improvements in treatment and
care of
persons infected with the human immunodeficiency virus (HIV),
surveillance
of AIDS alone no longer accurately reflects the magnitude or
direction of
the epidemic. Data concerning persons in whom HIV infection is
diagnosed
before AIDS is diagnosed are needed to determine populations that
could
benefit from prevention and treatment services. CSTE recommends
that all
states and territories implement confidential HIV infection
reporting based
on methods that provide accurate and representative data for all
persons
confidentially diagnosed with HIV infection.
Influenza A (H5N1)
In May 1997, the first known case of disease among humans
caused by
influenza A (H5N1) virus occurred in a previously healthy
3-year-old child
in Hong Kong; this child died from his illness. An additional 17
cases
(including five deaths) were detected in November and December
1997. All
cases occurred coincident with outbreaks of highly pathogenic avian
influenza A (H5N1) virus among poultry. At the end of December,
Hong Kong
authorities initiated the slaughter of all chickens in Hong Kong
and, since
then, no additional cases of influenza A (H5N1) virus have been
detected
among humans despite enhanced surveillance. The pandemic potential
of
influenza A (H5N1) viruses remains unknown. No cases of H5N1
infection were
reported in the United States.
Tularemia
Tularemia was removed from the nationally notifiable disease
list in
1995. However, as of January 1998, a total of 36 states maintained
tularemia as a notifiable condition. Based on a telephone survey of
state
departments of health conducted from 1995 through 1997, a total of
313
cases of tularemia were reported by 43 states (119 cases in 1995,
89 cases
in 1996, and 105 cases in 1997). Of these, 155 (49%) were reported
from
Missouri, Oklahoma, Kansas, and Arkansas.
Vancomycin-Resistant Enterococci (VRE)
The magnitude and impact of vancomycin-resistant enterococci
(VRE) in
the United States are demonstrated by CDC's National Nosocomial
Infections
Surveillance (NNIS) system, which includes more than 275 U.S.
hospitals.
Additional data are available on the Internet at
http://www.cdc.gov/ncidod/hip/Surveill/surveill.htm. During
1989-1997, the
percentage of enterococci resistant to vancomycin isolated from
patients in
intensive care units with nosocomial infections increased from 0.4%
to
23.2% (Table Table_B). The percentage of VRE isolated from
patients in
noncritical care units with nosocomial infections increased from
0.3% to
15.4%.
PART 1: Summaries of Notifiable Diseases in the United States
EXPLANATION OF SYMBOLS USED IN TABLES, GRAPHS, AND MAPS
Data not available..............................................NA
Report of disease is not required
in that jurisdiction
(not notifiable) .............................................NN
No reported cases ............................................. --
Table_C NOTIFIABLE DISEASES -- Summary of reported cases, by
month,
United States, 1997
Table_D1 NOTIFIABLE DISEASES -- Reported cases, by geographic
division
and area, United States, 1997
Table_D2 NOTIFIABLE DISEASES -- Reported cases, by geographic
division
and area, United States, 1997 (continued)
Table_D3 NOTIFIABLE DISEASES -- Reported cases, by geographic
division
and area, United States, 1997 (continued)
Table_D4 NOTIFIABLE DISEASES -- Reported cases, by geographic
division
and area, United States, 1997 (continued)
Table_D5 NOTIFIABLE DISEASES -- Reported cases, by geographic
division
and area, United States, 1997 (continued)
Table_D6 NOTIFIABLE DISEASES -- Reported cases, by geographic
division
and area, United States, 1997 (continued)
Table_E NOTIFIABLE DISEASES -- Summary of reported cases, by
age
group, United States, 1997
Table_F NOTIFIABLE DISEASES -- Summary of reported cases, by
sex,
United States, 1997
Table_G NOTIFIABLE DISEASES -- Summary of reported cases, by
race,
United States, 1997
Table_H NOTIFIABLE DISEASES -- Summary of reported cases, by
ethnicity,
United States, 1997
PART 2: Graphs and Maps for Selected Notifiable Diseases in the
United
States
EXPLANATION OF SYMBOLS USED IN TABLES, GRAPHS, AND MAPS
Data not available..............................................NA
Report of disease is not required
in that jurisdiction
(not notifiable) .............................................NN
pediatric cases, United States and Puerto Rico,
1997
Figure_4 ARBOVIRAL INFECTIONS (of the central nervous
system) --
reported laboratory- confirmed cases caused by
California
serogroup viruses, by month of onset, United
States, 1988-
1997
Figure_5 ARBOVIRAL INFECTIONS (of the central nervous
system) --
reported laboratory- confirmed cases caused by
eastern
equine encephalitis virus, by month of onset,
United
States, 1988-1997
Figure_6 ARBOVIRAL INFECTIONS (of the central nervous
system) --
reported laboratory- confirmed cases caused by St.
Louis
encephalitis virus, by month of onset, United
States, 1988-
1997
Figure_7 ARBOVIRAL INFECTIONS (of the central nervous
system) --
reported laboratory- confirmed cases caused by
western
equine encephalitis virus, by month of onset,
United
States, 1988-1997
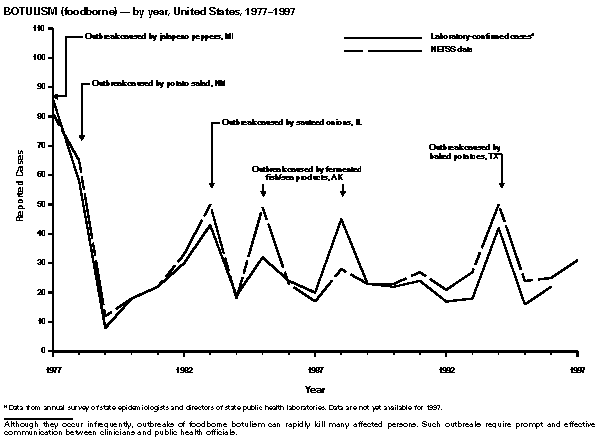
Figure_8 BOTULISM (foodborne) -- by year, United States,
1977-1997
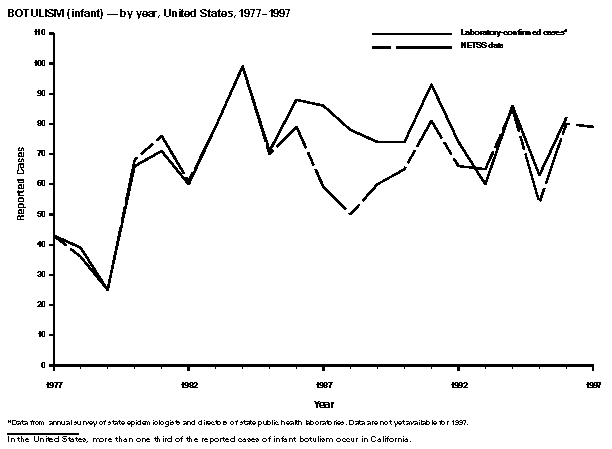
Figure_9 BOTULISM (infant) -- by year, United States,
1977-1997
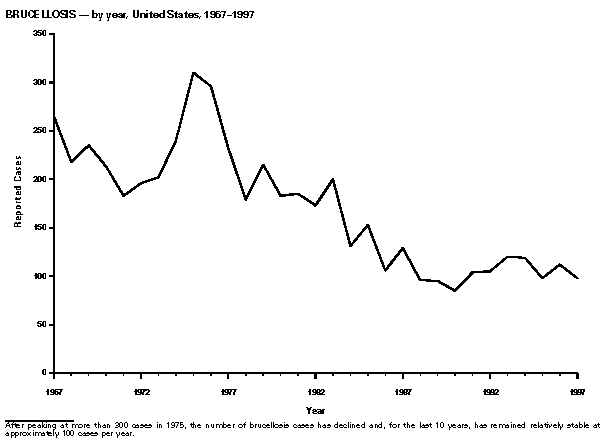
Figure_10 BRUCELLOSIS -- by year, United States, 1967-1997
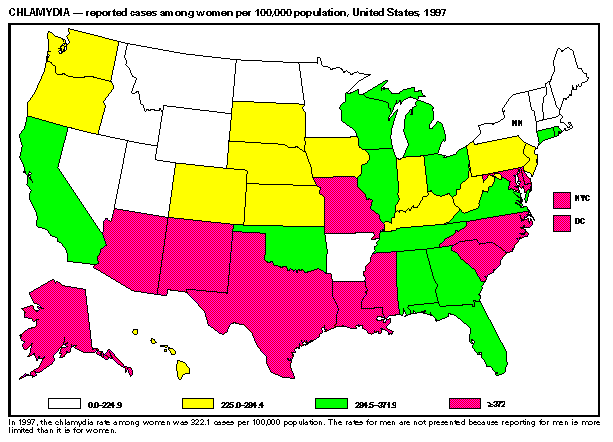
Figure_11 CHLAMYDIA -- reported cases among women per 100,000
population, United States, 1997
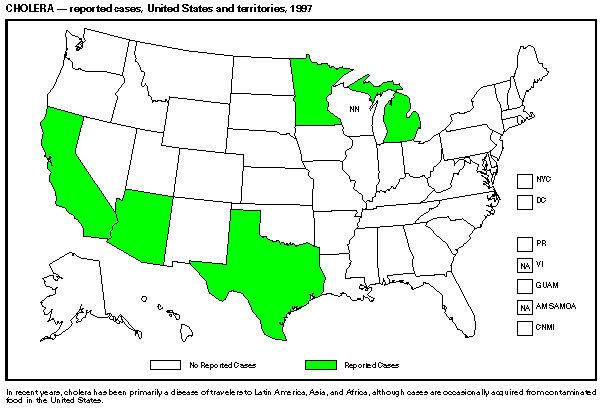
Figure_12 CHOLERA -- reported cases, United States and
territories,
1997
Figure_13 CRYPTOSPORIDIOSIS -- reported cases per 100,000
population,
United States and territories, 1997
Figure_14 DIPHTHERIA -- by year, United States, 1967-1997
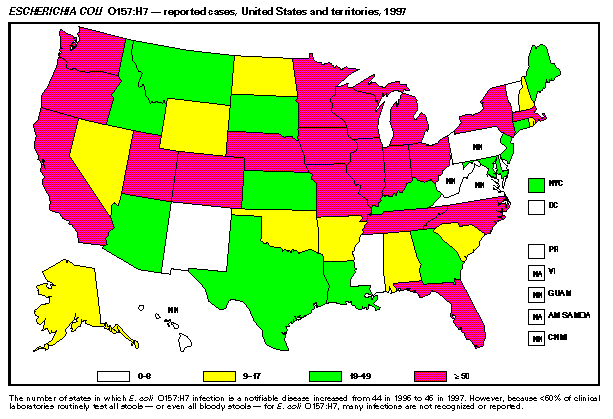
Figure_15 ESCHERICHIA COLI O157:H7 -- reported cases, United
States
and territories, 1997
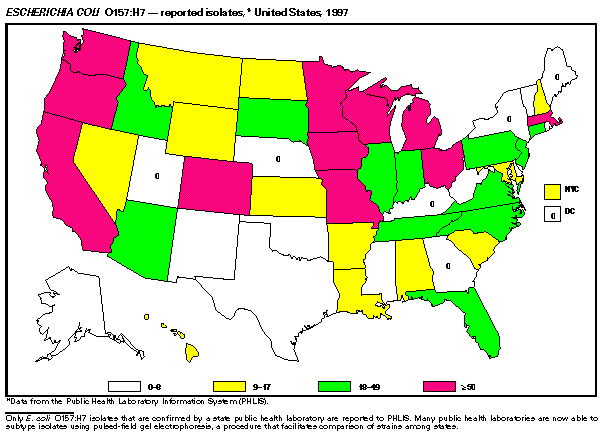
Figure_16 ESCHERICHIA COLI O157:H7 -- reported isolates,
United
States, 1997
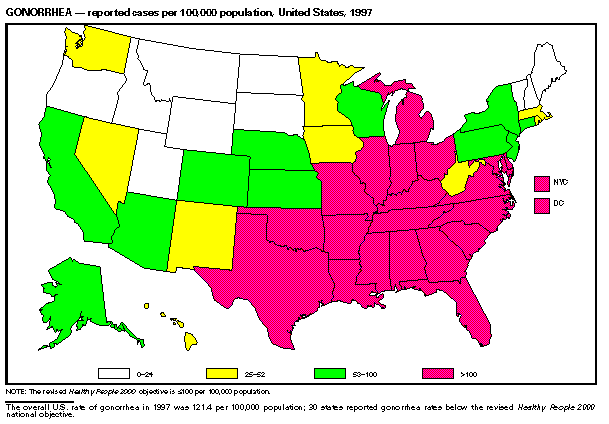
Figure_17 GONORRHEA -- reported cases per 100,000 population,
United
States, 1997
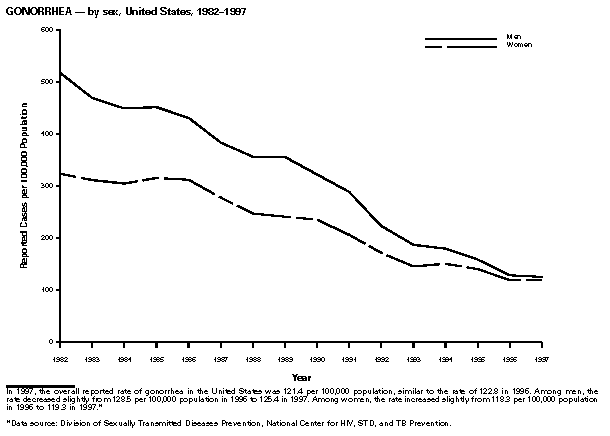
Figure_18 GONORRHEA -- by sex, United States, 1982-1997
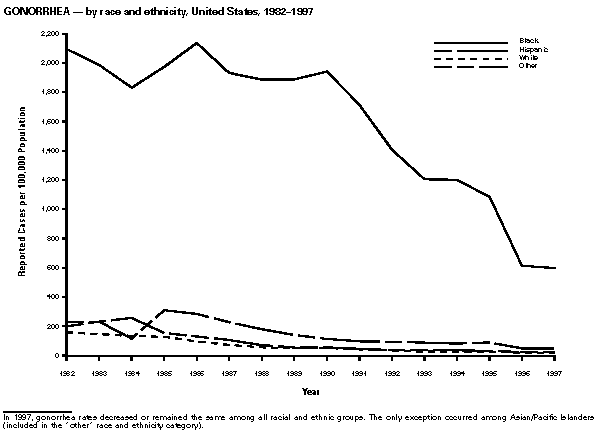
Figure_19 GONORRHEA -- by race and ethnicity, United States,
1982-
1997
Figure_20 HAEMOPHILUS INFLUENZAE (Invasive Disease) -- by age
group,
United States, 1991-1997
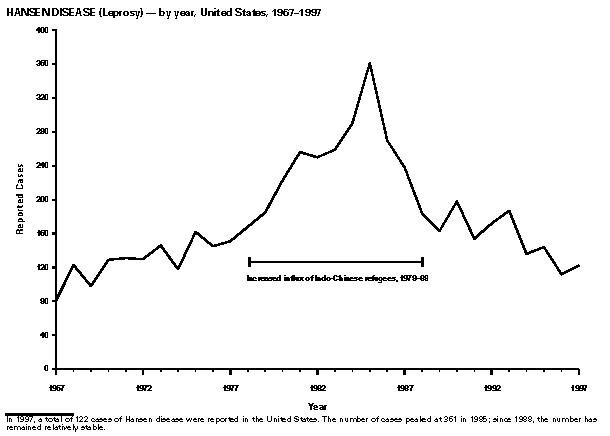
Figure_21 HANSEN DISEASE (Leprosy) -- by year, United States,
1967-
1997
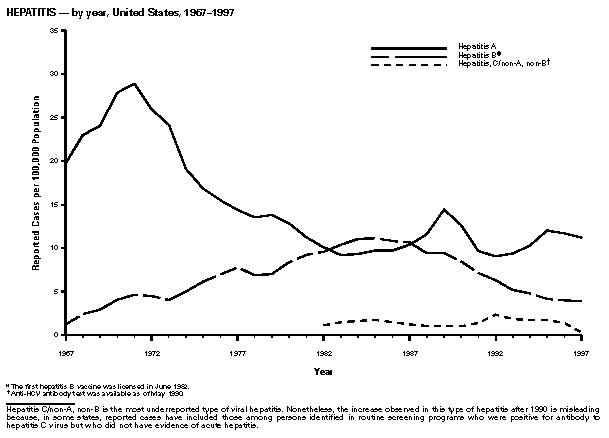
Figure_22 HEPATITIS -- by year, United States, 1967-1997
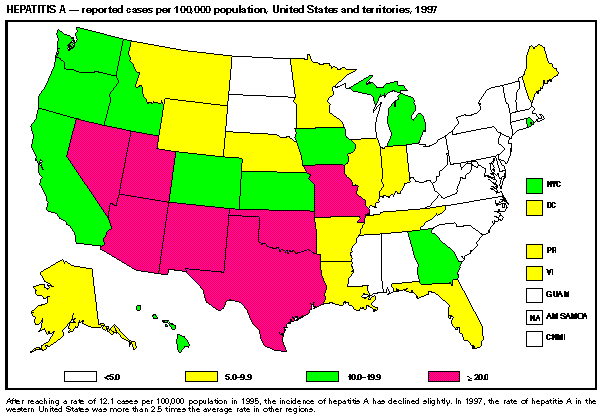
Figure_23 HEPATITIS A -- reported cases per 100,000
population,
United States and territories, 1997
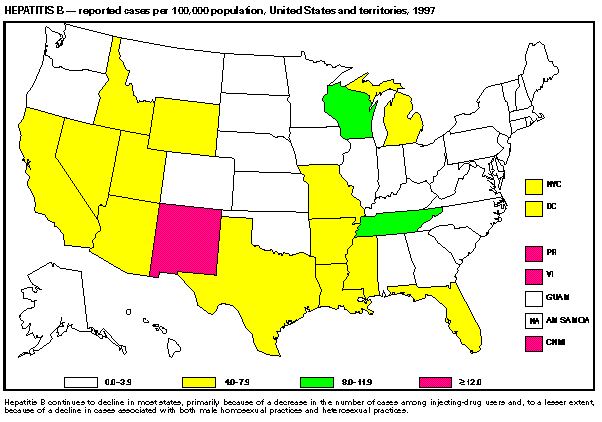
Figure_24 HEPATITIS B -- reported cases per 100,000
population,
United States and territories, 1997
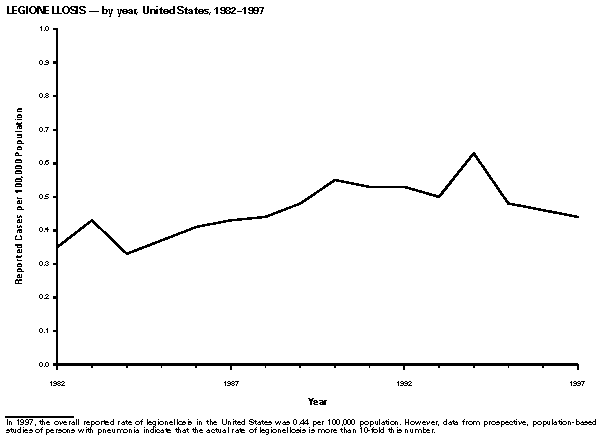
Figure_25 LEGIONELLOSIS -- by year, United States, 1982-1997
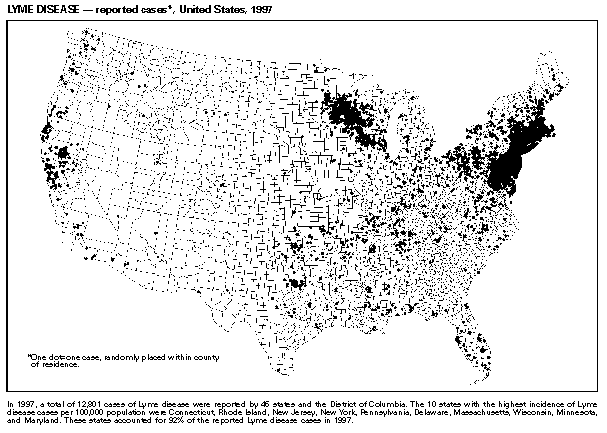
Figure_26 LYME DISEASE -- reported cases, United States, 1997
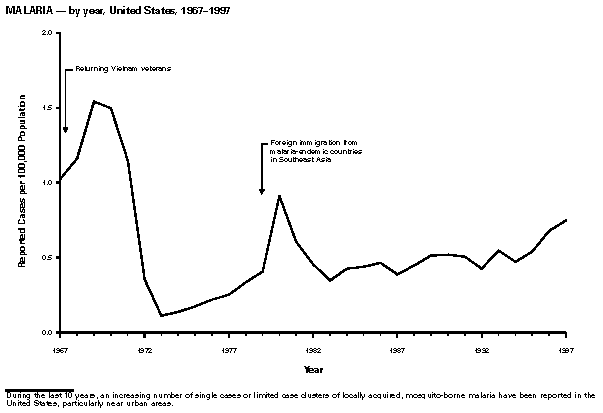
Figure_27 MALARIA -- by year, United States, 1967-1997
Figure_28 MEASLES (Rubeola) -- by year, United States,
1962-1997
Figure_29 MENINGOCOCCAL DISEASE -- by year, United States,
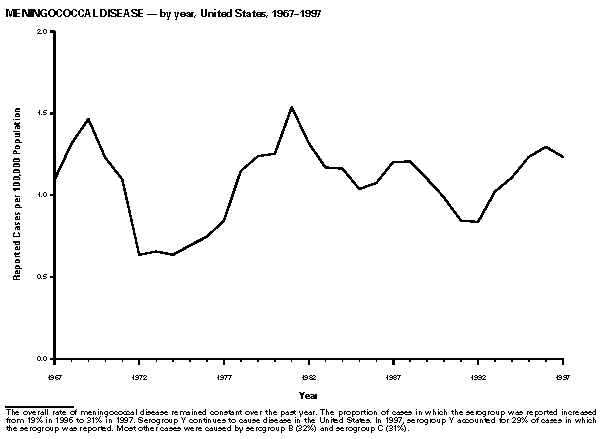
1967-1997
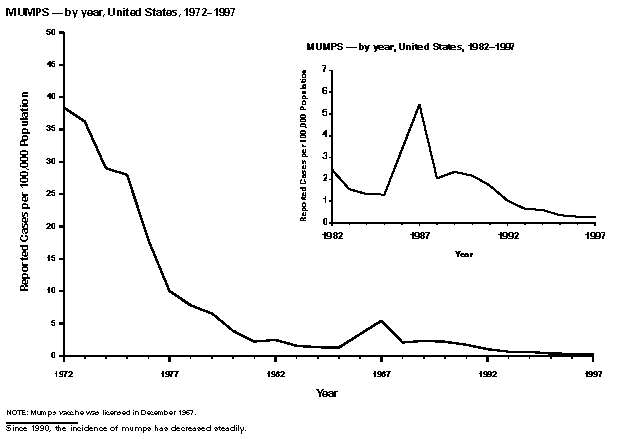
Figure_30 MUMPS -- by year, United States, 1972-1997
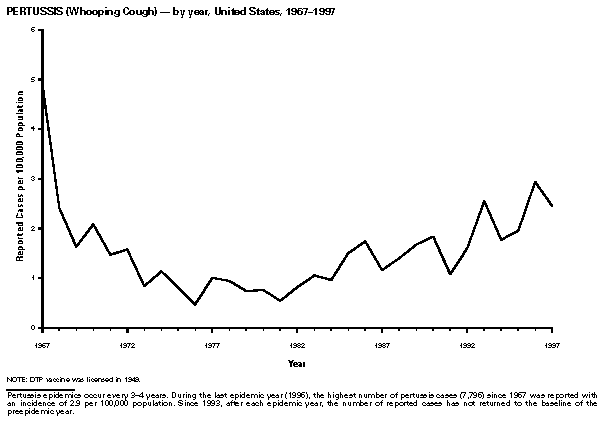
Figure_31 PERTUSSIS (Whooping Cough) -- by year, United
States, 1967-
1997
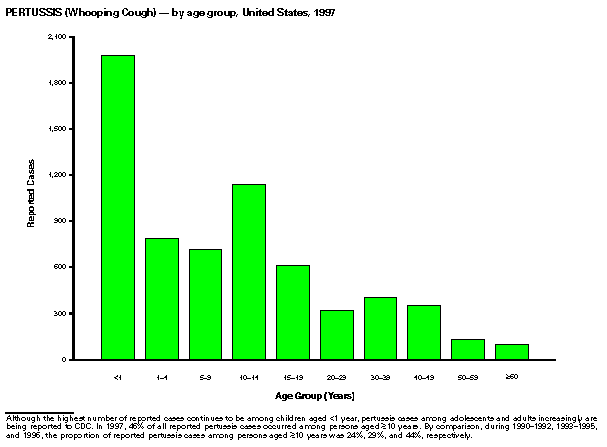
Figure_32 PERTUSSIS (Whooping Cough) -- by age group, United
States,
1997
Figure_33 PLAGUE -- among humans, by year, United States,
1967-1997
Figure_34 POLIOMYELITIS (paralytic) -- by year, United
States, 1967-
1997
Figure_35 PSITTACOSIS -- by year, United States, 1967-1997
Figure_36 RABIES -- wild and domestic animals, by year,
United States
and Puerto Rico, 1967-1997
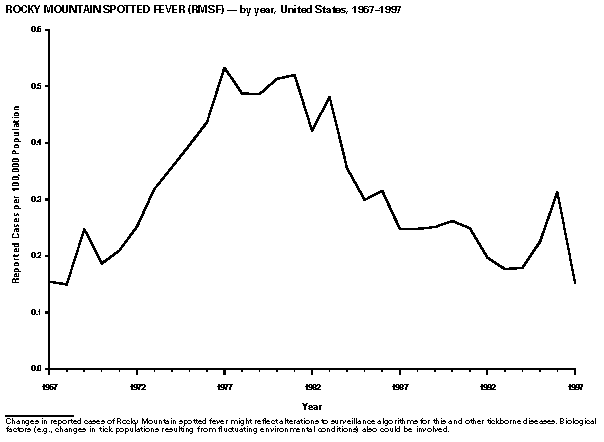
Figure_37 ROCKY MOUNTAIN SPOTTED FEVER (RMSF) -- by year,
United
States, 1967-1997
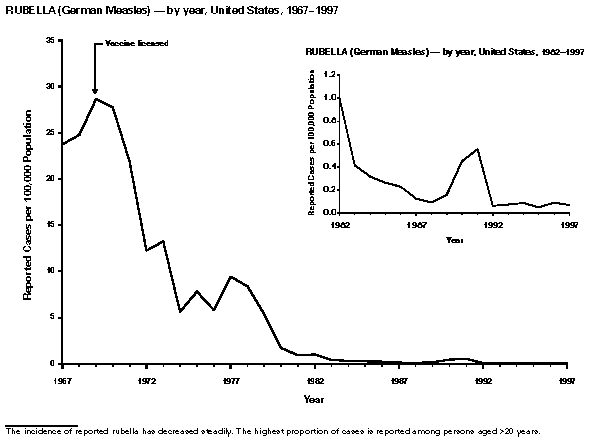
Figure_38 RUBELLA (German Measles) -- by year, United States,
1967-
1997
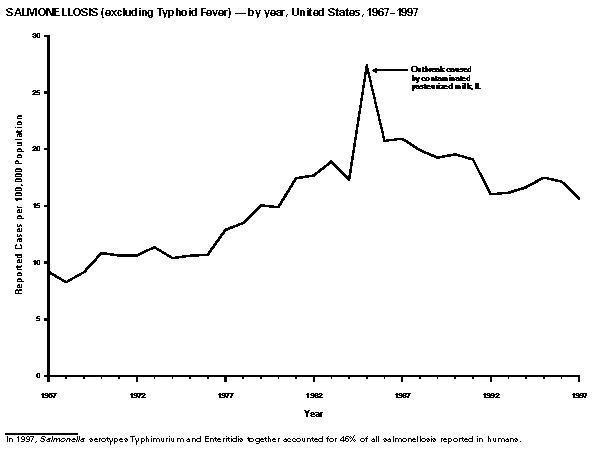
Figure_39 SALMONELLOSIS (excluding Typhoid Fever) -- by year,
United
States, 1967-1997
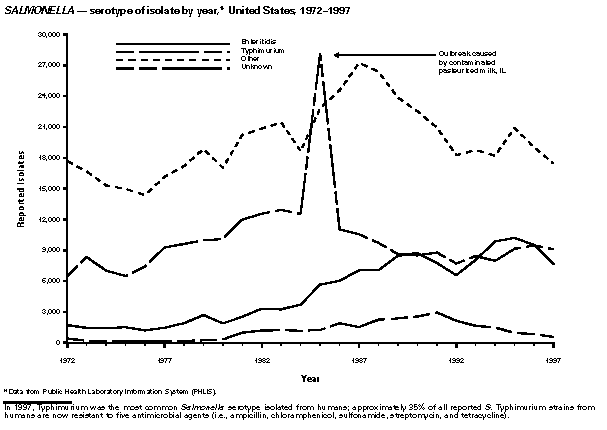
Figure_40 SALMONELLA -- serotype of isolate by year, United
States,
1972-1997
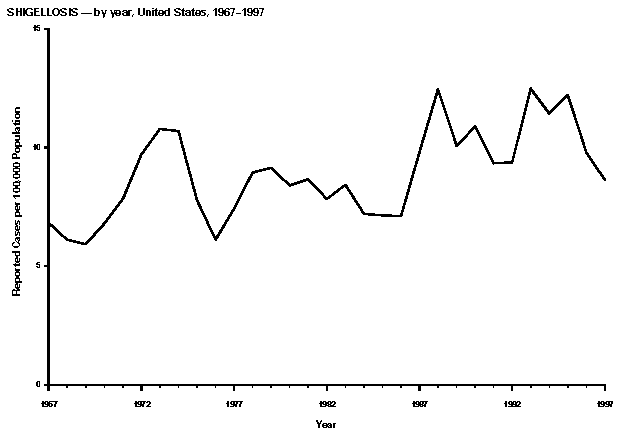
Figure_41 SHIGELLOSIS -- by year, United States, 1967-1997
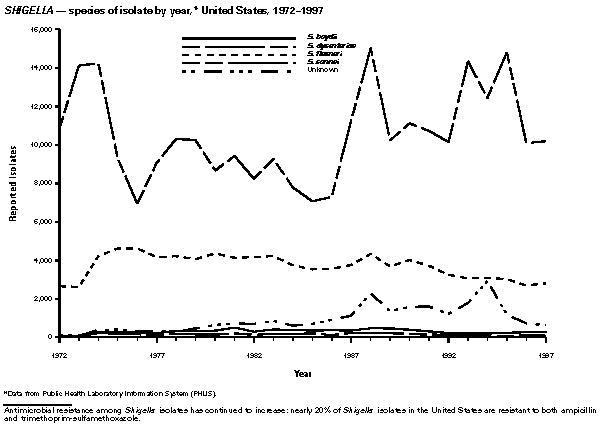
Figure_42 SHIGELLA -- species of isolate by year, United
States,
1972-1997
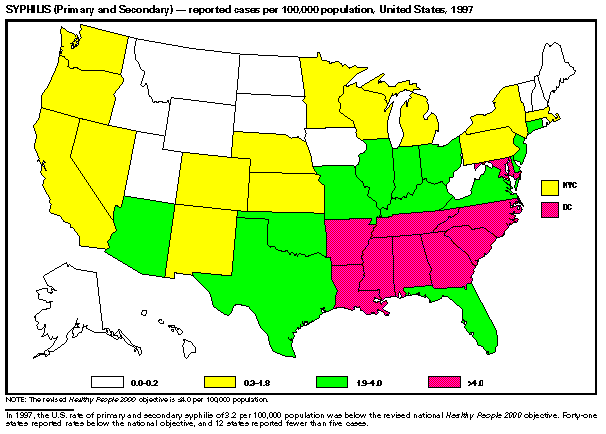
Figure_43 SYPHILIS (Primary and Secondary) -- reported cases
per
100,000 population, United States, 1997
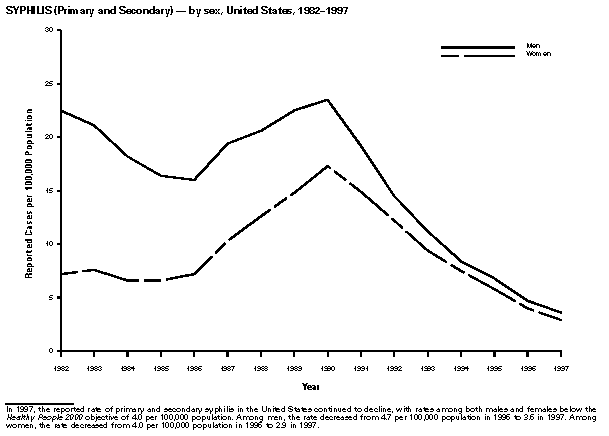
Figure_44 SYPHILIS (Primary and Secondary) -- by sex, United
States,
1982-1997
Figure_45 SYPHILIS (Primary and Secondary) -- by race and
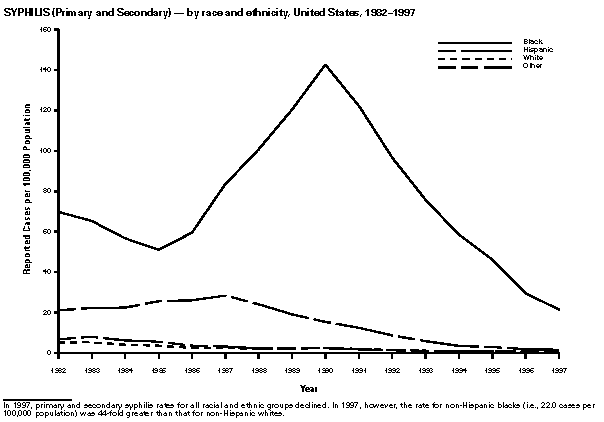
ethnicity,
United States, 1982-1997
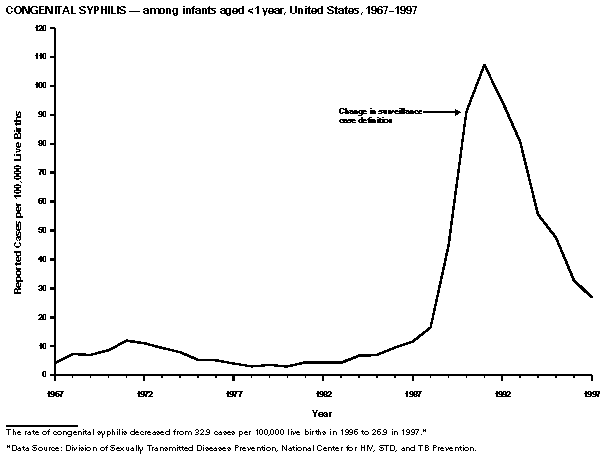
Figure_46 CONGENITAL SYPHILIS -- among infants aged <1 year, United
States, 1967-1997
Figure_47 TETANUS -- by year, United States, 1967-1997
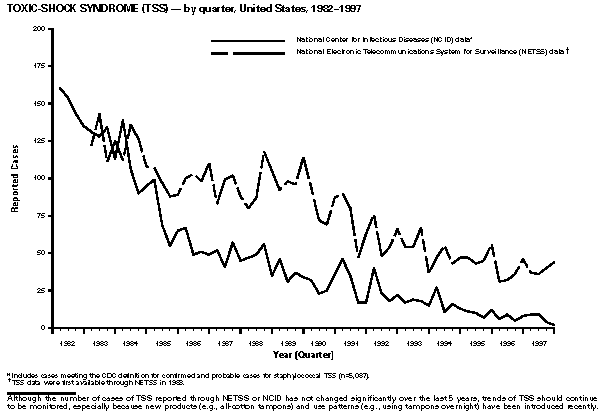
Figure_48 TOXIC-SHOCK SYNDROME (TSS) -- by quarter, United
States,
1982-1997
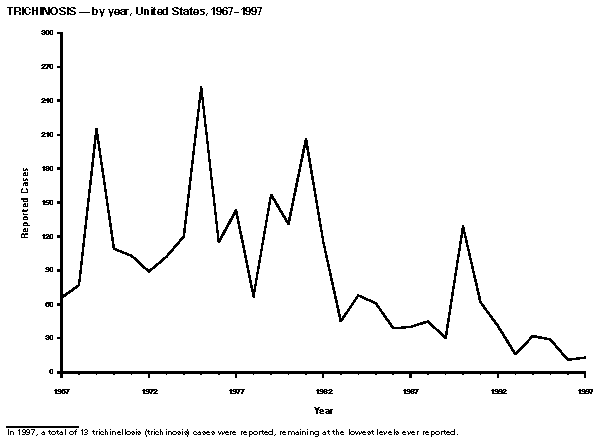
Figure_49 TRICHINOSIS -- by year, United States, 1967-1997
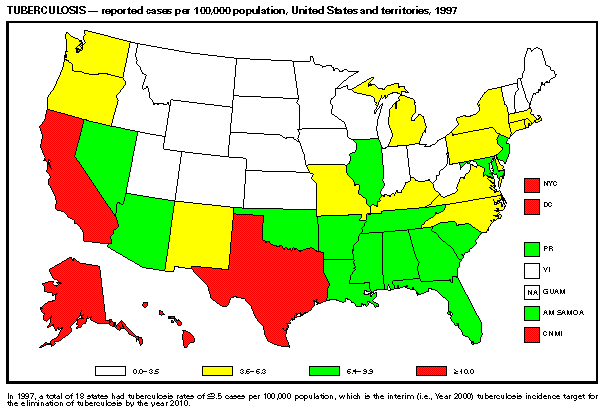
Figure_50 TUBERCULOSIS -- reported cases per 100,000
population,
United States and territories, 1997
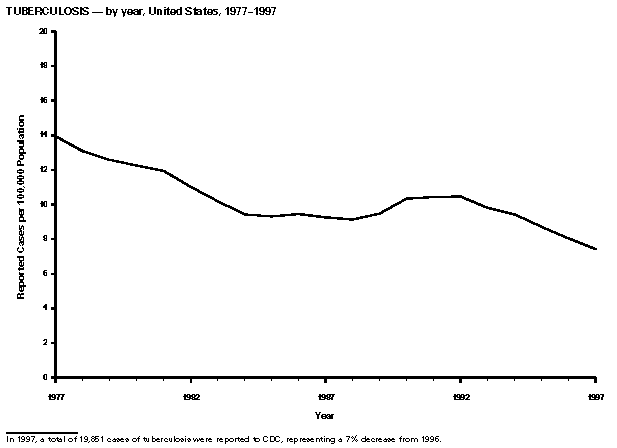
Figure_51 TUBERCULOSIS -- by year, United States, 1977-1997
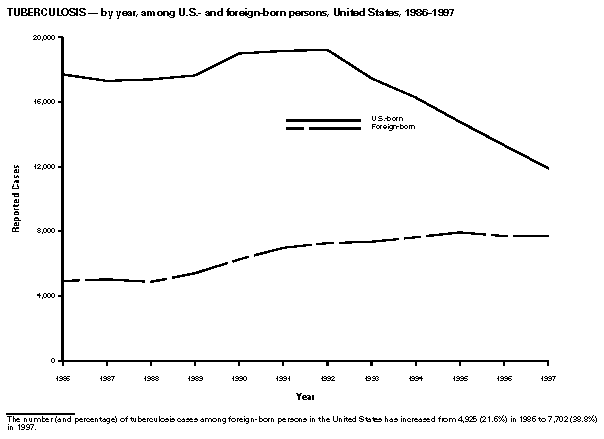
Figure_52 TUBERCULOSIS -- by year, among U.S.- and
foreign-born
persons, United States, 1986-1997
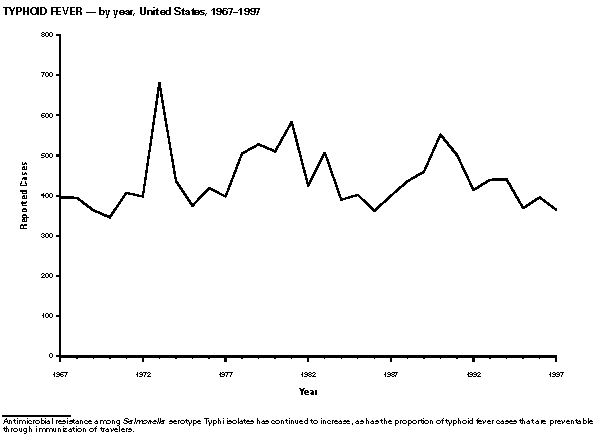
Figure_53 TYPHOID FEVER -- by year, United States, 1967-1997
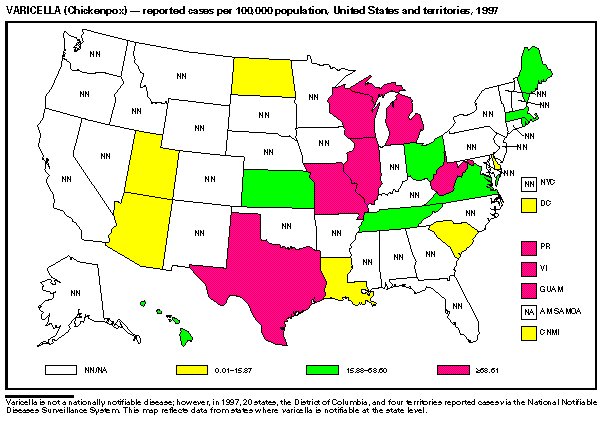
Figure_54 VARICELLA (Chickenpox) -- reported cases per 100,
000
population, United States and territories, 1997
PART 3: Historical Summary Tables
EXPLANATION OF SYMBOLS USED IN TABLES, GRAPHS, AND MAPS
No reported cases ............................................. --
Table_1 NOTIFIABLE DISEASES -- Summary of reported cases per
100,000
population, United States, 1988-1997
Table_2 NOTIFIABLE DISEASES -- Summary of reported cases,
United
States, 1990-1997
Table_3 NOTIFIABLE DISEASES -- Summary of reported cases,
United
States, 1982-1989
Table_4 NOTIFIABLE DISEASES -- Summary of reported cases,
United
States, 1974-1981
Table_5 NOTIFIABLE DISEASES -- Summary of reported cases,
United
States, 1966-1973
Table_6 NOTIFIABLE DISEASES -- Deaths from selected diseases,
United
States, 1987-1996
Bibliography
General
Niskar AS, Koo D. Differences in notifiable infectious disease
morbidity among adult women -- United States, 1992-1994. J
Womens
Health 1998;7:451-8.
CDC. Case definitions for infectious conditions under public
health
surveillance. MMWR 1997;46(No. RR-10). Available at
. Accessed
November
19, 1998.
CDC. Sexually transmitted disease surveillance, 1996. Atlanta:
US
Department of Health and Human Services, Public Health Service,
CDC,
1997.
CDC. Demographic differences in notifiable infectious disease
morbidity -- United States, 1992-1994. MMWR 1997;46:637-41.
CDC. National electronic telecommunications system for
surveillance.
Informational brochure July 1996. Available at
CDC. Notifiable disease surveillance and notifiable disease
statistics -- United States, June 1946 and June 1996. MMWR
1996;45:530-7.
Koo D, Wetterhall S. History and current status of the National
Notifiable Diseases Surveillance System. J Public Health
Management and
Practice 1996;2:4-10.
CDC. Ten leading nationally notifiable infectious diseases --
United
States, 1995. MMWR 1996;45:883-4.
Benenson AS. Control of communicable diseases in man. 16th ed.
Washington, DC: American Public Health Association, 1995.
Martin SM, Bean NH. Data management issues for emerging
diseases and
new tools for managing surveillance and laboratory data. Emerg
Infect
Dis J 1995;1:124-8.
CDC. Manual of procedures for the reporting of nationally
notifiable
diseases to CDC. Atlanta: US Department of Health and Human
Services,
Public Health Service, CDC, 1995.
Teutsch SM, Churchill RE, eds. Principles and practice of
public health
surveillance. New York: Oxford University Press, 1994.
Thacker SB, Stroup DF. Future directions for comprehensive
public
health surveillance and health information systems in the
United
States. Am J Epidemiol 1994;140:383-97.
CDC. Use of race and ethnicity in public health surveillance.
MMWR
1993;42(No. RR-10).
CDC. Mandatory reporting of infectious diseases by clinicians,
and
mandatory reporting of occupational diseases by clinicians.
MMWR
1990;39(No. RR-9).
Thacker SB, Choi K, Brachman PS. The surveillance of infectious
diseases. JAMA 1983;249:1181-5.
AIDS
CDC. Diagnosis and reporting of HIV and AIDS in states with
integrated
HIV and AIDS surveillance -- United States, January 1994-June
1997.
MMWR 1998;47:309-14.
Arboviral Infections (California serogroup viruses, eastern equine
encephalitis, St. Louis encephalitis, western equine encephalitis)
CDC. Arboviral infections of the central nervous system --
United
States, 1996-1997. MMWR 1998;47:517-22.
Szumlas DE, Apperson CS, Hartig PC, Francy DB, Karabatsos N.
Seroepidemiology of La Crosse virus infection in humans in
western
North Carolina. Am J Trop Med Hyg 1996;54:332-7.
Marfin AA, Bleed DM, Lofgren JP, et al. Epidemiologic aspects
of a St.
Louis encephalitis epidemic in Jefferson County, Arkansas,
1991. Am J
Trop Med Hyg 1993;49:30-7.
Tsai TF. Arboviral infections: general considerations for
prevention,
diagnosis, and treatment in travelers. Seminars in Pediatric
Infectious
Diseases 1992;3:62-9.
Botulism
Angulo FJ, Getz J, Taylor JP, et al. A large outbreak of
botulism: the
hazardous baked potato. J Infect Dis 1998;178:172-7.
Shapiro RL, Hatheway C, Becher J, Swerdlow DL. Botulism
surveillance
and emergency response: a public health strategy for a global
challenge. JAMA 1997;278:433-5.
Townes JM, Cieslak PR, Hatheway CL, et al. An outbreak of type
A
botulism associated with a commercial cheese sauce. Ann Intern
Med
1996;125:558-63.
Mertz KJ, Levine WC, Mosure DJ, Berman SM, Dorian KJ. Trends in
the
prevalence of chlamydial infections: the impact of
community-wide
testing. Sex Transm Dis 1997;24:169-75.
Mosure DJ, Berman S, Kleinbaum D, Halloran ME. Predictors of
Chlamydia
trachomatis infection among female adolescents: a longitudinal
analysis. Am J Epidemiol 1996;144:997-1003.
CDC. Recommendations for the prevention and management of
Chlamydia
trachomatis infections, 1993. MMWR 1993;42(No. RR-12):1-39.
Cholera
Mahon BE, Mintz ED, Greene KD, Wells JG, Tauxe RV. Reported
cholera in
the United States, 1992-1994: a reflection of global changes in
cholera
epidemiology. JAMA 1996;276:307-12.
Wachsmuth IK, Blake PA, Olsvik O, eds. Vibrio cholerae and
cholera:
molecular to global perspectives. Washington, DC: American
Society for
Microbiology, 1994.
Blake PA. Epidemiology of cholera in the Americas.
Gastroenterol Clin
North Am 1993;22:639-60.
World Health Organization. Guidelines for cholera control.
Geneva:
World Health Organization, 1993.
Juranek DD. Cryptosporidiosis: sources of infection and
guidelines for
prevention. Clin Infect Dis 1995;21(suppl 1):S57-S61. Available
at
.
Accessed
November 19, 1998.
CDC. Assessing the public health threat associated with
waterborne
cryptosporidiosis: report of a workshop. MMWR 1995;44(No.
RR-6):1-19.
Available at
.
Accessed November 19, 1998.
Cyclosporiasis
Soave R, Herwaldt BL, Relman DA. Cyclospora. Infect Dis Clin
North Am
1998;12:1-12.
CDC. Update: outbreaks of cyclosporiasis -- United States and
Canada,
1997. MMWR 1997;46:521-3.
Herwaldt BL, Ackers ML, Cyclospora Working Group. An outbreak
in 1996
of cyclosporiasis associated with imported raspberries. N Engl
J Med
1997;336:1548-56.
Dengue
Rigau-Perez JG, Gubler DJ, Vorndam AV, Clark GG. Dengue in
travelers
from the United States, 1986-1994. J Travel Med 1997;4:65-71.
Pinheiro FP, Corber SJ. Global situation of dengue and dengue
haemorrhagic fever, and its emergence in the Americas. World
Health
Stat Q 1997;50:161-9.
Diphtheria
Bisgard K, Hardy I, Popovic T, et al. Respiratory diphtheria in
the
United States, 1980-1995. Am J Public Health 1998;88:787-91
Dittmann S. Epidemic diphtheria in the Newly Independent States
of the
former USSR -- situation and lessons learned. Biologicals
1997;25:79-86.
CDC. Diphtheria acquired by U.S. citizens in the Russian
Federation and
Ukraine -- 1994. MMWR 1995;44:237,243-4
Drug-Resistant Streptococcus pneumoniae
Dowell SF. Principles of judicious use of antimicrobial agents
for
pediatric upper respiratory tract infections. Pediatrics
1998;101(suppl):S163-S184.
CDC. Prevention of pneumococcal disease: recommendations of the
Advisory Committee on Immunization Practices. MMWR 1997;46(No.
RR-8):1-24.
CDC. Defining the public health impact of drug-resistant
Streptococcus
pneumoniae: report of a working group. MMWR 1996;45(No.
RR-1):1-20.
Butler JC, Hofmann J, Cetron MS, et al. The continued emergence
of
drug-resistant Streptococcus pneumoniae in the United States:
an update
from the Centers for Disease Control and Prevention's
Pneumococcal
Sentinel Surveillance System. J Infect Dis 1996;174:986-93.
Bender JB, Hedberg CW, Besser JM, Boxrud DJ, MacDonald KL,
Osterholm
MT. Surveillance for Escherichia coli O157:H7 infections in
Minnesota
by molecular subtyping. N Engl J Med 1997;337:388-94.
Mahon BE, Griffin PM, Mead PS, Tauxe RV. Hemolytic uremic
syndrome
surveillance to monitor trends in infection with Escherichia
coli
O157:H7 and other shiga toxin-producing E. coli. Emerg Infect
Dis
1997;3:409-12.
Slutsker L, Ries AA, Greene KD, Wells JG, Hutwagner L, Griffin
PM.
Escherichia coli O157:H7 diarrhea in the United States:
clinical and
epidemiologic features. Ann Intern Med 1997;126:505-13.
Boyce TG, Pemberton AG, Wells JG, Griffin PM. Screening for
Escherichia
coli O157:H7 -- a nationwide survey of clinical laboratories. J
Clin
Microbiol 1995;33:3275-7.
Gonorrhea
Fox KK, Knapp JS, Holmes KK, et al. Antimicrobial resistance in
Neisseria gonorrhoeae in the United States, 1988-1994: the
emergence of
decreased susceptibility to the fluoroquinolones. J Infect Dis
1997;175:1396-403.
Gershman KA, Barrow JC. A tale of two sexually transmitted
diseases:
prevalences and predictors of chlamydia and gonorrhea in women
attending Colorado family planning clinics. Sex Transm Dis
1996;23:481-8.
CDC. Surveillance for gonorrhea and primary and secondary
syphilis
among adolescents -- United States, 1981-1991. MMWR 1993;42(No.
SS-3):1-11.
Group A Streptococcal Disease
The Working Group on Prevention of Invasive Group A
Streptococcal
Infections. Prevention of invasive group A streptococcal
disease among
household contacts of case-patients: is prophylaxis warranted?
JAMA
1998;279:1206-10.
CDC. Outbreak of invasive group A streptococcus associated with
varicella in a childcare center -- Boston, Mass. MMWR
1997;46:944-8.
Davies HD, McGeer A, Schwartz B, et al. A prospective,
population-based
study of invasive group A streptococcal infections, including
toxic
shock syndrome and the risk of secondary infections. N Engl J
Med
1996;335:547-54.
Working Group on Severe Streptococcal Infections. Defining the
group A
streptococcal toxic shock syndrome: rationale and consensus
definition.
JAMA 1993;269:390-1.
Haemophilus influenzae (Invasive Disease)
Bisgard KM, Kao A, Leake J, Strebel PM, Perkins BA, Wharton M.
Haemophilus influenzae invasive disease in the United States,
1994-1995: near disappearance of a child vaccine preventable
disease.
Emerg Infect Dis 1998;4:229-37
Schuchat A, Robinson K, Wenger JD, et al. Bacterial meningitis
in the
United States in 1995. New Engl J Med 1997;33:970-6.
Urwin G, Krohn JA, Deaver-Robinson K, et al. Invasive disease
due to
Haemophilus influenzae serogroup f: clinical and epidemiologic
characteristics in the H. influenzae serotype b vaccine era.
Clin
Infect Dis 1996;22:1069-76.
CDC. Recommendations for the use of Haemophilus b conjugate
vaccines
and a combined diphtheria, tetanus, pertussis, and Haemophilus
b
vaccine: recommendations of the Advisory Committee on
Immunization
Practices (ACIP). MMWR 1993;42(No. RR-13).
Hepatitis
CDC. Hepatitis surveillance report no. 56. Atlanta, GA: US
Department
of Health and Human Services, Public Health Service, CDC, 1996.
Alter MJ, Mares A, Hadler SC, Maynard JE. The effect of
underreporting
on the apparent incidence and epidemiology of acute viral
hepatitis. Am
J Epidemiol 1987;125:133-9.
Hepatitis A
Lemon SM, Shapiro CN. The value of immunization against
hepatitis A.
Infectious Agents and Disease 1994;1:38-49.
Shapiro CN, Coleman PJ, McQuillan GM, et al. Epidemiology of
hepatitis
A: seroepidemiology and risk groups in the U.S.A. Vaccine
1992;10(suppl
1):S59-S62.
Hepatitis B
Margolis HS, Alter MJ, Hadler SC. Hepatitis B: evolving
epidemiology
and implications for control. Semin Liver Dis 1991;11:84-92.
Hepatitis, C/Non-A, Non-B
CDC. Recommendations for prevention and control of hepatitis C
virus
(HCV) infection and HCV-related chronic disease. MMWR
1998;47(no.
RR-19).
Alter MJ, Mast EE, Moyer LA, Margolis HS. Hepatitis C. Infect
Dis Clin
N Am 1998;12:13-26.
Alter MJ, Margolis HS, Krawczynski K, et al. The natural
history of
community-acquired hepatitis C in the United States. N Engl J
Med
1992;327:1899-905.
Influenza A (H5N1)
Subbarao K, Klimov A, Katz J, et al. Characterization of an
avian
influenza A (H5N1) virus isolated from a child with a fatal
respiratory
illness. Science 1998;279:393-6.
Yuen KY, Chan PK, Peiris M, et al. Clinical features and rapid
viral
diagnosis of human disease associated with avian influenza A
H5N1
virus. Lancet 1998;351:467-71.
CDC. Update: isolation of avian influenza A(H5N1) viruses from
humans
Hong Kong, 1997-1998. MMWR 1998;46:1245-7.
Legionellosis
Fiore AE, Nuorti PJ, Levine OS, et al. Epidemic Legionnaires'
disease
two decades later: old sources, new diagnostic methods. Clin
Infect Dis
1998;26:426-33.
Jernigan DB, Hofmann J, Cetron MS, et al. Outbreak of
Legionnaires'
disease among cruise ship passengers exposed to a contaminated
whirlpool spa. Lancet 1996;347:494-9.
Keller DW, Hajjeh R, DeMaria A Jr, et al. Community outbreak of
Legionnaires' disease: an investigation confirming the
potential for
cooling towers to transmit legionella species. Clin Infect Dis
1996;22:257-61.
Marston BJ, Lipman HB, Breiman RF. Surveillance for
Legionnaires'
disease: risk factors for morbidity and mortality. Arch Intern
Med
1994;154:2417-22.
Lyme Disease
Dennis DT. Epidemiology, ecology, and prevention of Lyme
disease. In:
Rahn DW, Evans J, eds. Lyme disease. Philadelphia: American
College of
Physicians, 1998:7-34.
CDC. Lyme disease -- United States, 1996. MMWR 1997:46:531-5.
CDC. Recommendations for test performance and interpretation
from the
Second National Conference on Serologic Diagnosis of Lyme
disease. MMWR
1995;44:590-1.
Malaria
Lobel HO, Kozarsky PE. Update on prevention of malaria for
travelers.
JAMA 1997;278:1767-71.
Zucker JR. Changing patterns of autochthonous malaria
transmission in
the United States: a review of recent outbreaks. Emerg Infect
Dis
1996;2:37-43.
Zucker JR, Campbell CC. Malaria: principles of prevention and
treatment. Infect Dis Clin N Am 1993;7:547-67.
Measles
CDC. Measles, mumps and rubella -- vaccine use and strategies
for
elimination of measles, rubella and congenital rubella syndrome
and
control of mumps: recommendations of the Advisory Committee on
Immunization Practices. MMWR 1998;47(No. RR-7)1-48.
CDC. Measles -- United States, 1997. MMWR 1998;47:273-6.
CDC. Measles -- United States, 1996. MMWR 1997;46:242-6.
Meningococcal Disease
Rosenstein N, Levine O, Taylor JP, et al. Efficacy of
meningococcal
vaccine and barriers to vaccination. JAMA 1998;279:435-9.
Fischer M, Hedberg K, Cardosi P, et al. Tobacco smoke as a risk
factor
for meningococcal disease. Pediatr Infect Dis J 1997;16:979-83.
CDC. Control and prevention of meningococcal disease and
control and
prevention of serogroup C meningococcal disease: evaluation and
management of suspected outbreaks: recommendations of the
Advisory
Committee on Immunization Practices (ACIP). MMWR 1997;46(No.
RR-5).
CDC. Laboratory-based surveillance for meningococcal disease in
selected areas -- United States, 1989-1991. MMWR 1993;42(No.
SS-2):21-30.
Mumps
CDC. Mumps surveillance -- United States, 1988-1993. MMWR
1995;44(No.
SS-3):1-14.
Briss PA, Fehrs LJ, Parker RA, et al. Sustained transmission of
mumps
in a highly vaccinated population: assessment of primary
vaccine
failure and waning vaccine-induced immunity. J Infect Dis
1994;169:77-82.
Hersch BS, Fine PEM, Kent WK, et al. Mumps outbreak in a highly
vaccinated population. J Pediatr 1991;119:187-93.
Guris D, Bardenheier B, Brennan M, et al. Pertussis: a
re-emerging
disease among adolescents and adults in the U.S. {Abstract}.
In:
Proceedings of the International Conference on Emerging
Infectious
Diseases. Atlanta: CDC, CSTE, ASM and several others, 1998.
CDC. Manual for the surveillance of vaccine-preventable
diseases.
Atlanta: US Department of Health and Human Services, CDC, 1997.
Available at .
Accessed
November 19, 1998.
CDC. Pertussis vaccination: use of acellular pertussis vaccines
among
infants and young children: recommendations of the Advisory
Committee
on Immunization Practices (ACIP). MMWR 1997;46(No. RR-7):1-25.
Plague
Gage KL. Plague. In: Hausler WJ, Sussman M, ed. 9th ed. Topley
and
Wilson's microbiology and microbial infections, Vol. 3,
bacterial
infections. London: Arnold 1998:885-903.
CDC. Prevention of plague: recommendations of the Advisory
Committee on
Immunization Practices (ACIP). MMWR 1996;45(No. RR-14).
Poland JD, Quan TJ, Barnes AM. Plague. In: Beran GW, ed. CRC
handbook
series in zoonoses: section A -- bacterial, rickettsial and
mycotic
diseases. Boca Raton, Florida: CRC Press, Inc., 1994:93-112.
Poliomyelitis
CDC. Paralytic poliomyelitis -- United States, 1980-1994. MMWR
1997;46:79-83.
CDC. Poliomyelitis prevention in the United States:
introduction of a
sequential schedule of inactivated poliovirus vaccine followed
by oral
poliovirus vaccine-recommendations of the Advisory Committee on
Immunization Practices (ACIP). MMWR 1997;46(No. RR-3):1-25.
Prevots DR, Strebel PM. Poliomyelitis prevention in the United
States:
new recommendations for routine childhood poliovirus
vaccination place
greater reliance on inactivated poliovirus vaccine. Pediat Ann
1997:26:378-83.
Psittacosis
Moroney JF, Guevara R, Iverson C, et al. Detection of
chlamydiosis in a
shipment of pet birds, leading to recognition of an outbreak of
clinically mild psittacosis in humans. Clin Infect Dis
1998;26:1425-9.
Jorgensen DM. Gestational psittacosis in a Montana sheep
rancher. Emerg
Infect Dis 1997;3:191-4
CDC. Compendium of psittacosis (chlamydiosis) control, 1997.
MMWR
1997;46(No. RR-13):1-13.
Wong KH, Skelton SK, Daugharty H. Utility of complement
fixation and
microimmunofluorescence assays for detecting serologic
responses in
patients with clinically diagnosed psittacosis. J Clin
Microbiol
1994;32:2417-21.
Rabies
CDC. Compendium of animal rabies control, 1998. MMWR
1998;47(No. RR-9).
Krebs JW, Smith JS, Rupprecht CE, Childs JE. Rabies
surveillance in the
United States during 1996. JAVMA 1997;211:1525-39.
CDC. Rabies prevention -- United States, 1991: recommendations
of the
Immunization Practices Advisory Committee (ACIP). MMWR
1991;40(No.
RR-3):1-19.
Rocky Mountain Spotted Fever
Dalton MJ, Clarke MJ, Holman RC, et al. National surveillance
for Rocky
Mountain spotted fever, 1981-1992: epidemiologic summary and
evaluation
of risk factors for fatal outcome. Am J Trop Med Hyg
1995;52:405-13.
Salgo MP, Telzak EE, Currie B, et al. A focus of Rocky Mountain
spotted
fever within New York City. N Engl J Med 1988;318:1345-8.
Woodward TE. Rocky Mountain spotted fever: epidemiological and
early
clinical signs are keys to treatment and reduced mortality. J
Infect
Dis 1984;150:465-8.
Rubella
CDC. Rubella and congenital rubella syndrome -- United States,
1994-1997. MMWR 1997;46:350-4.
CDC. Rubella and congenital rubella syndrome -- United States,
January
1, 1991-May 7, 1994. MMWR 1994;43:391,397-401.
CDC. Rubella among crew members of commercial cruise ships.
MMWR
1997;46:1247-50.
Salmonellosis
Mahon BE, Ponka A, Hall WN, et al. An international outbreak of
Salmonella infections caused by alfalfa sprouts grown from
contaminated
seeds. J Infect Dis 1997;175:876-82.
Mermin J, Hoar B, Angulo FJ. Iguanas and Salmonella marina
infection in
children: a reflection of the incidence of reptile-associated
salmonellosis in the United States. Pediatrics 1997;99:399-402.
CDC. Outbreaks of Salmonella serotype Enteritidis infection
associated
with consumption of raw shell eggs -- United States, 1994-1995.
MMWR
1996;45:737-42.
Shigellosis
Sobel J, Cameron DN, Ismail J, et al. A prolonged outbreak of
Shigella
sonnei infections in traditionally observant Jewish communities
in
North America caused by a molecularly distinct bacterial
subtype. J
Infect Dis 1998;177:1405-8.
Mohle-Boetani JC, Stapleton M, Finger R, et al. Communitywide
shigellosis: control of an outbreak and risk factors in child
day-care
centers. Am J Public Health 1995;85:812-6.
Ries AA, Wells JG, Olivola D, et al. Epidemic Shigella
dysenteriae type
1 in Burundi: panresistance and implications for prevention. J
Infect
Dis 1994;169:1035-41.
Lee LA, Shapiro CN, Hargrett-Bean N, Tauxe RV. Hyperendemic
shigellosis
in the United States: a review of surveillance data for
1967-1988. J
Infect Dis 1991;164:894-900.
Syphilis
St. Louis ME, Farley TA, Aral SO. Untangling the persistence of
syphilis in the south. Sex Transm Dis 1996;23:1-4.
Nakashima AK, Rolfs RT, Flock ML, Kilmarx P, Greenspan JR.
Epidemiology
of syphilis in the United States, 1941-1993. Sex Transm Dis
1996;23:16-23.
CDC. Outbreak of primary and secondary syphilis -- Baltimore
City,
Maryland, 1995. MMWR 1996;45:166-9.
Syphilis, Congenital
Risser WL, Hwang LY. Problems in the current case definitions
of
congenital syphilis. J Pediatr 1996;129:499-505.
Coles BF, Hipp SS, Silberstein GS, Chen JH. Congenital syphilis
surveillance in upstate New York, 1989-1992: implications for
prevention and clinical management. J Infect Dis.
1995;171:732-5.
CDC. Surveillance for geographic and secular trends in
congenital
syphilis -- United States, 1983-1991. MMWR 1993;42(No.
SS-6):59-71.
CDC. Guidelines for the prevention and control of congenital
syphilis.
MMWR 1988;37(No. S-1):1-13.
Tetanus
CDC. Tetanus surveillance -- United States, 1995-1997. MMWR
1998;47(No.
SS-2):1-13.
Craig AS, Reed GW, Mohon RT, et al. Neonatal tetanus in the
United
States: a sentinel event in the foreign-born. Pediatr Infect
Dis J
1997;16:955-9.
CDC. Tetanus surveillance -- United States, 1991-1994. MMWR
1997;46(No.
SS-2):15-25.
Gergen PJ, McQuillan GM, Keily M, Ezzati-Rice TM, Sutter RW,
Virella G.
A population-based serologic survey of immunity to tetanus in
the
United States. N Engl J Med 1995;332:761-6.
Toxic-Shock Syndrome
Schuchat A, Broome CV. Toxic shock syndrome and tampons.
Epidemiol Rev
1991;13:99-112.
CDC. Reduced incidence of menstrual toxic shock syndrome --
United
States, 1980-1990. MMWR 1990;39:421-3.
Gaventa S, Reingold AL, Hightower AW, et al. Active
surveillance for
toxic shock syndrome in the United States, 1986. Rev Infect Dis
1989;11(suppl):S28-S34.
Trichinellosis (Trichinosis)
CDC. Outbreak of trichinellosis associated with eating cougar
jerky --
Idaho, 1995. MMWR 1996;45:205-6.
McAuley JB, Michelson MK, Hightower AW, Engeran S, Wintermeyer
LA,
Schantz PM. A trichinosis outbreak among Southeast Asian
refugees. Am J
Epidemiol 1992;135:1404-10.
CDC. Trichinosis surveillance -- United States, 1987-1990. MMWR
1991;40(No. SS-3):35-42.
Bailey TM, Schantz PM. Trends in the incidence and transmission
patterns of human trichinosis in the United States, 1982-1986.
Rev
Infect Dis 1990;12:5-11.
Tuberculosis
CDC. Reported tuberculosis in the United States, 1997.
Washington, DC:
US Department of Health and Human Services, CDC, 1998.
CDC. Tuberculosis morbidity -- United States, 1997. MMWR
1998;47:253-7.
CDC. Recommendations for counting reported tuberculosis cases.
In:
Reported tuberculosis in the United States, 1996. July
1997:61-8.
American Thoracic Society, CDC. Treatment of tuberculosis and
tuberculosis infection in adults and children. Am J Respir Crit
Care
Med 1994;149:1359-74.
Typhoid Fever
Mermin JH, Townes JM, Gerber M, Dolan N, Mintz ED, Tauxe RV.
Typhoid
fever in the United States, 1985-1994: changing risks of
international
travel and increasing antimicrobial resistance. Arch Intern Med
1998;158:633-8.
CDC. Typhoid immunization: recommendations of the Advisory
Committee on
Immunization Practices. MMWR 1994;43(No. RR-14).
Woodruff BA, Pavia AT, Blake PA. A new look at typhoid
vaccination:
information for the practicing physician. JAMA 1991;265:756-9.
Varicella
CDC. Varicella-related deaths among children -- United States,
1997.
MMWR 1998;47:365-8.
CDC. Outbreak of invasive Group A Streptococcus associated with
varicella in a childcare center -- Boston, Massachusetts, 1997.
MMWR
1997;46:944-9.
Izurieta HS, Strebel PM, Blake PA. Postlicensure effectiveness
of
varicella vaccine during an outbreak in a child care center.
JAMA
1997;278:1495-9.
CDC. Prevention of varicella: recommendations of the Advisory
Committee
on Immunization Practices (ACIP). MMWR 1996;45(No. RR-11).
Table_A Note:
To print large tables and graphs users may have to change their printer settings to landscape and use a small font size.
The 52 Infectious Diseases Designated
as Notifiable at the National Level During 1997
===============================================================================================
---------------------------------------------------------------------------------------------
Acquired immunodeficiency       Haemophilus  influenzae          Rabies, animal
  syndrome                        (Invasive Disease)             Rabies, human
Anthrax                         Hansen disease (leprosy)         Rocky Mountain spotted fever
Botulism*                       Hantavirus pulmonary syndrome    Rubella
Brucellosis                     Hemolytic uremic syndrome,       Salmonellosis*
Chancroid*                        post-diarrheal                 Shigellosis*
Chlamydia trachomatis,          Hepatitis A                      Streptococcal disease,
  genital infection             Hepatitis B                        invasive, group A
Cholera                         Hepatitis, C/non-A, non-B        Streptococcus  pneumoniae,
Coccidioidomycosis*             HIV infection, pediatric           drug-resistant*
Congenital rubella syndrome     Legionellosis                    Streptococcal toxic-shock
Congenital syphilis             Lyme disease                       syndrome
Cryptosporidiosis               Malaria                          Syphilis
Diphtheria                      Measles (Rubeola)                Tetanus
Encephalitis, California        Meningococcal disease            Toxic-shock syndrome
Encephalitis, eastern equine    Mumps                            Trichinosis
Encephalitis, St. Louis         Pertussis                        Tuberculosis
Encephalitis, western equine    Plague                           Typhoid fever
Escherichia  coli  O157:H7      Poliomyelitis, paralytic         Yellow fever
Gonorrhea                       Psittacosis
---------------------------------------------------------------------------------------------
NOTE: Although varicella is not a nationally notifiable disease, the Council of State and
Territorial Epidemiologists recommends reporting of cases of this disease to CDC.

* Not currently published in the MMWR  weekly tables.
===============================================================================================
Disclaimer
All MMWR HTML versions of articles are electronic conversions from ASCII text into HTML. This conversion may have resulted in character translation or format errors in the HTML version. Users should not rely on this HTML document, but are referred to the electronic PDF version and/or the original MMWR paper copy for the official text, figures, and tables. An original paper copy of this issue can be obtained from the Superintendent of Documents, U.S. Government Printing Office (GPO), Washington, DC 20402-9371; telephone: (202) 512-1800. Contact GPO for current prices.
**Questions or messages regarding errors in formatting should be addressed to mmwrq@cdc.gov.
