At a glance
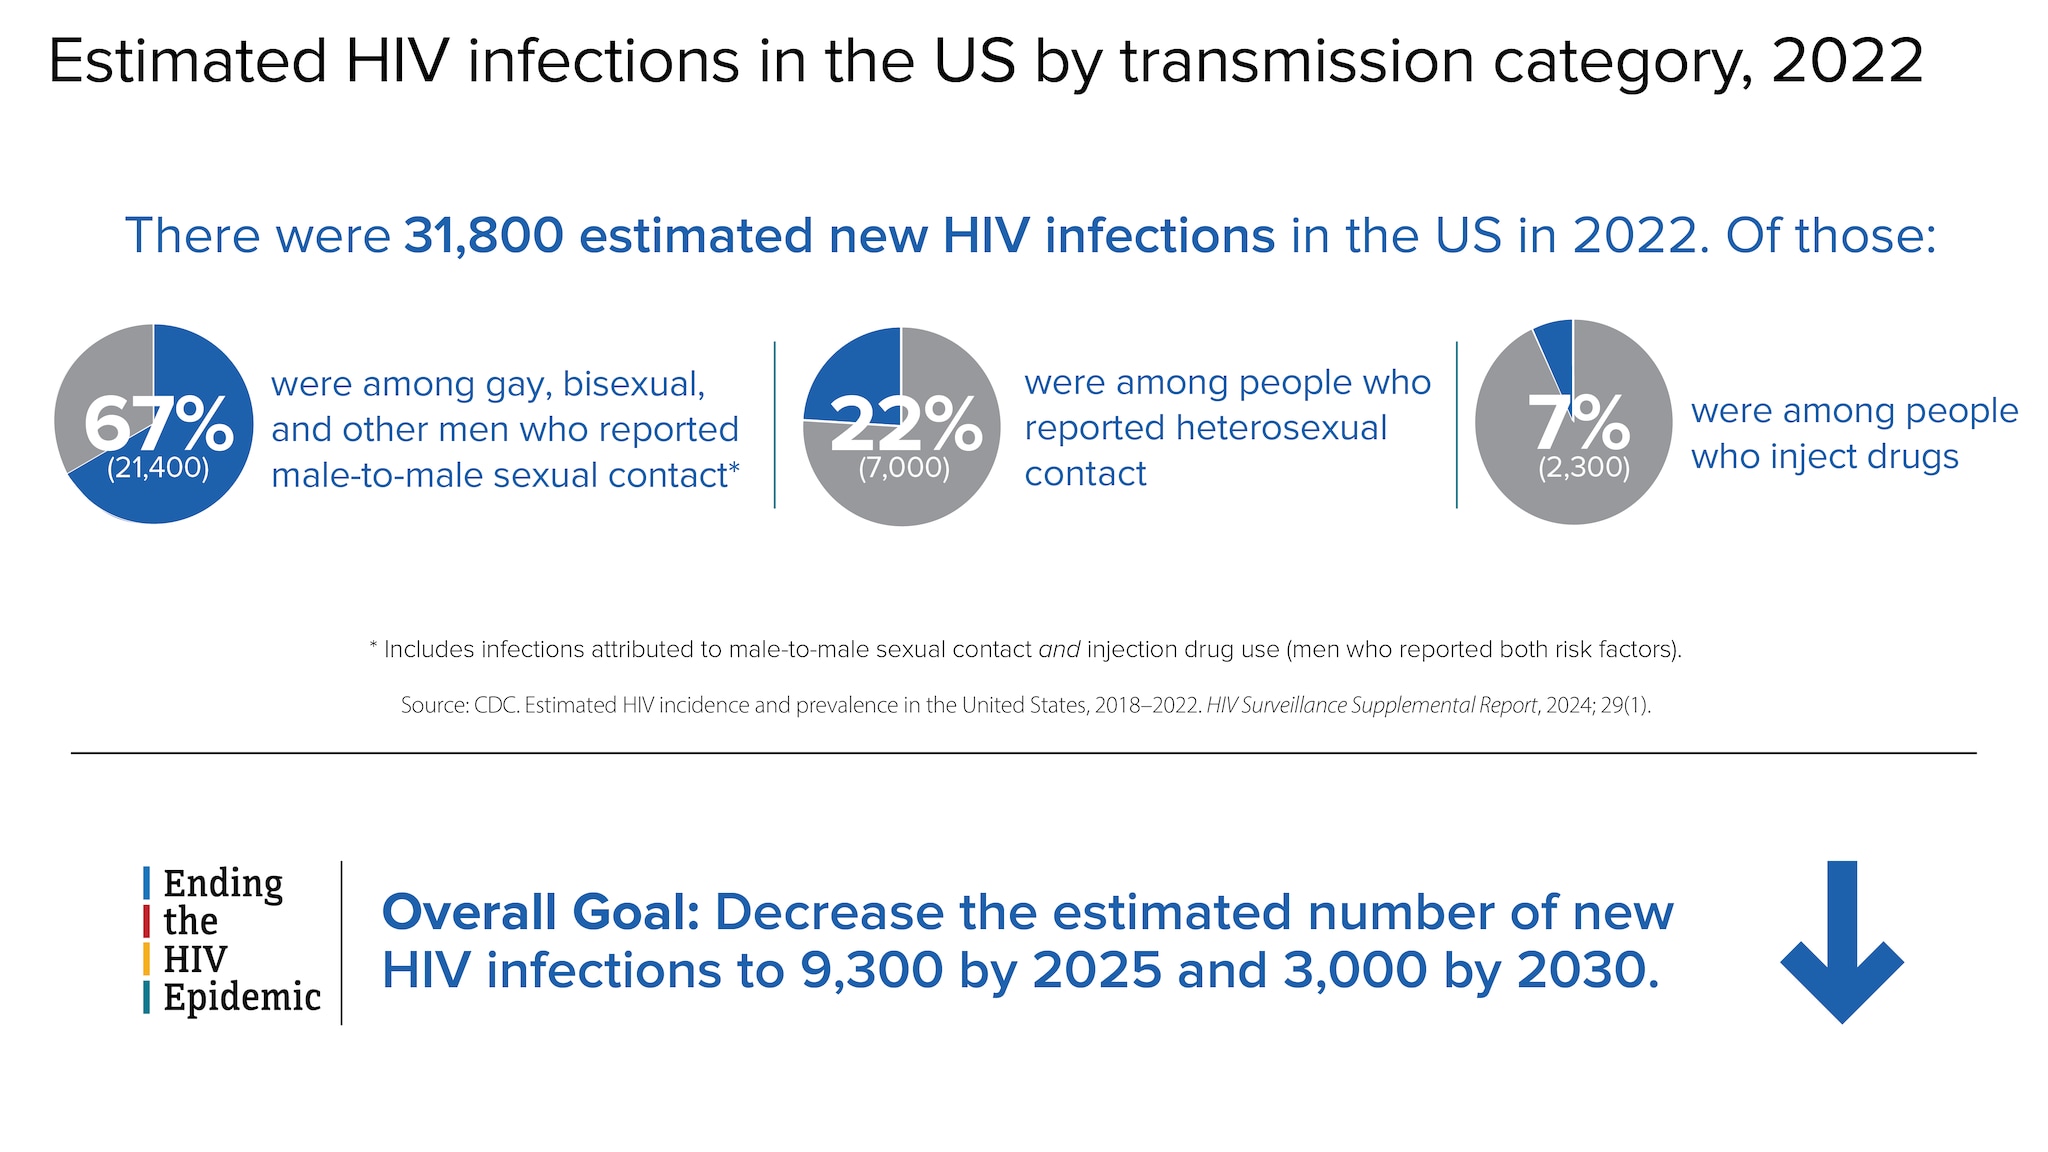
HIV remains a persistent problem in the United States. In the United States, estimated HIV infections decreased 12% overall from 2018 to 2022. Learn more about HIV trends in the United States.

Fast facts
HIV affects some groups more than others. Social and structural issues—such as HIV stigma, homophobia, discrimination, poverty, and limited access to high-quality health care—influence health outcomes and continue to drive inequities.
HIV incidence
HIV incidence refers to the estimated number of new HIV infections in a given year.
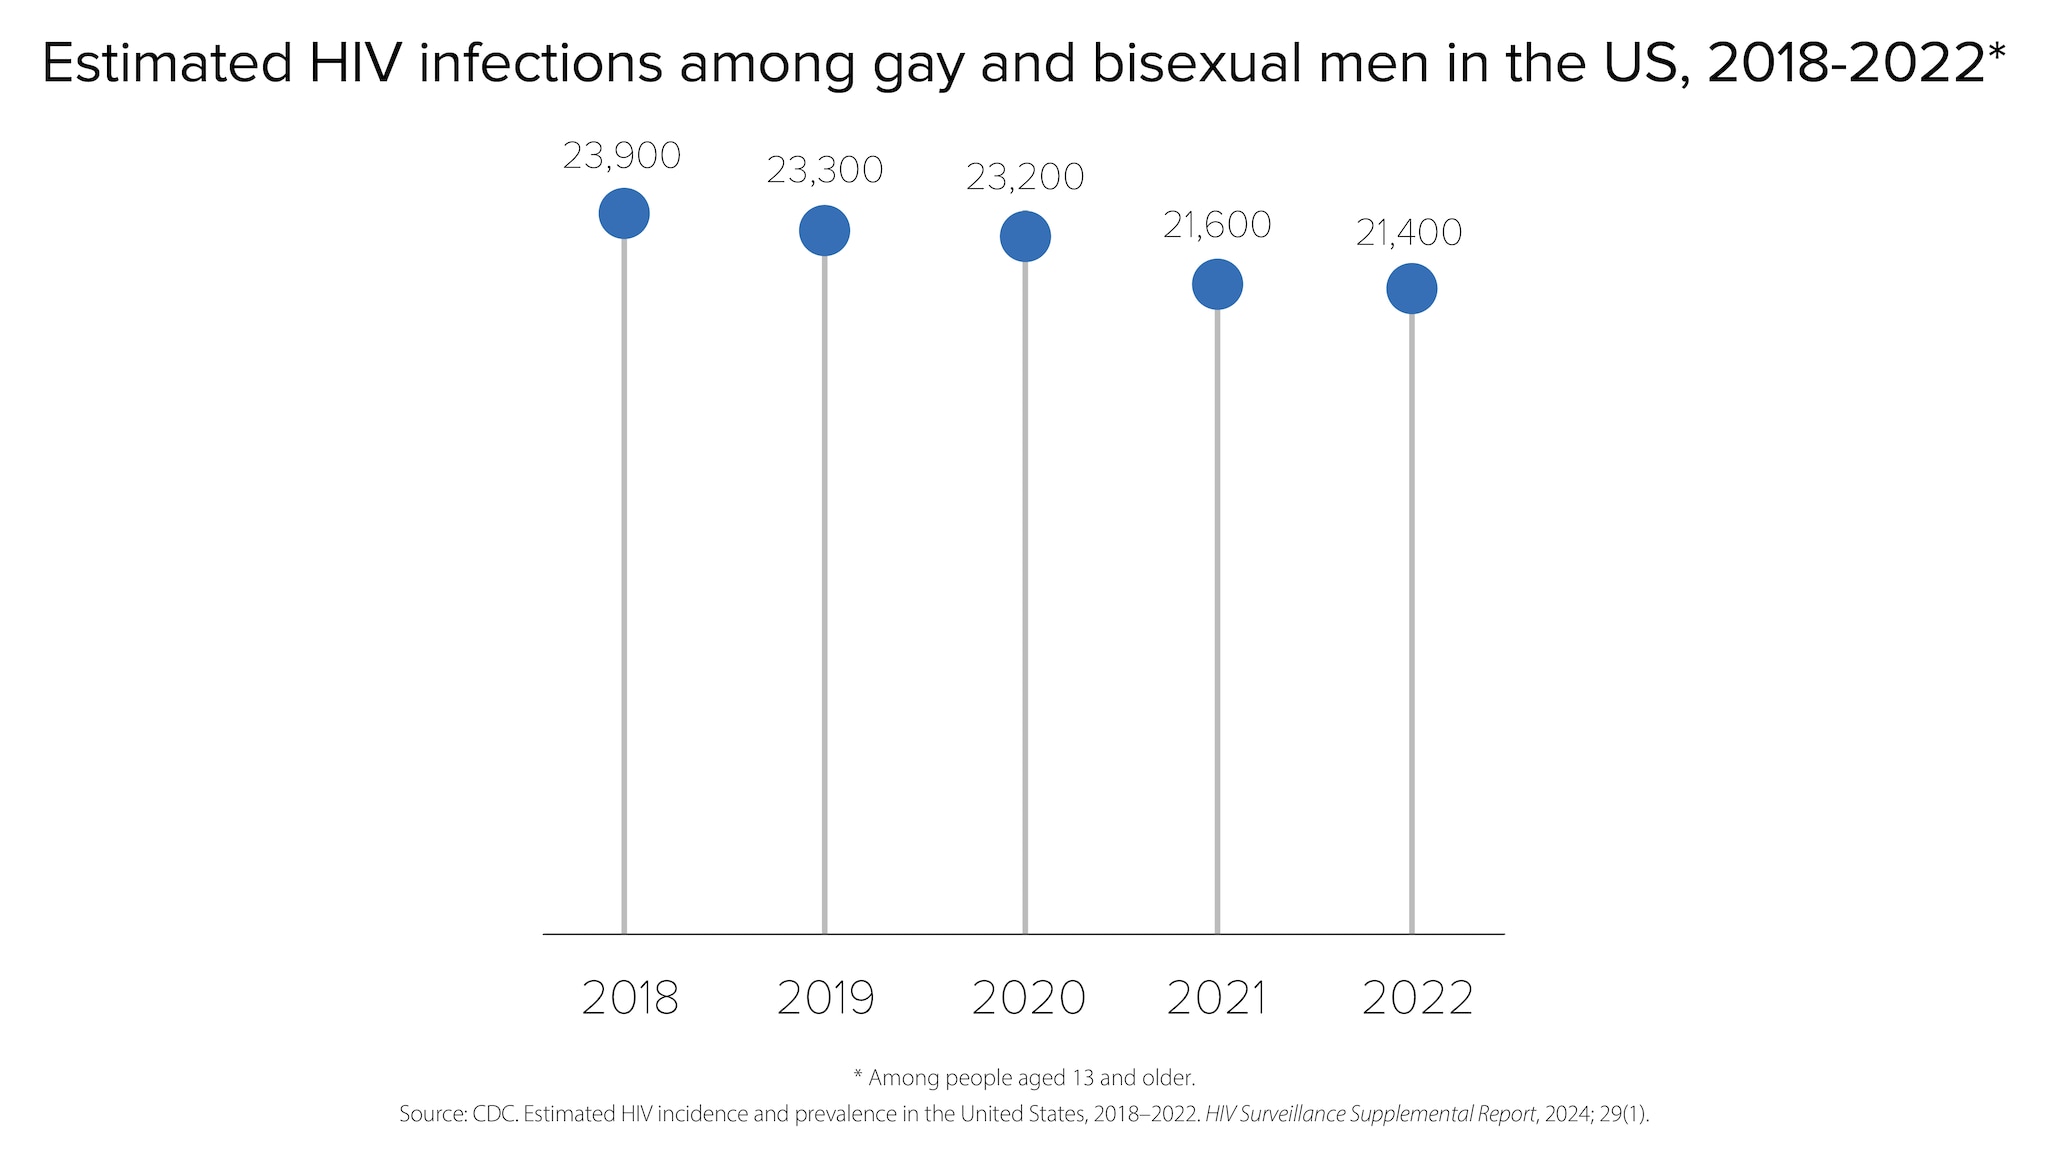
HIV infections among gay, bisexual, and other men who reported male-to-male sexual contact
In 2022, gay, bisexual, and other men who reported male-to-male sexual contact accounted for 67% (21,400) of the 31,800 estimated new HIV infections and 83% of estimated infections among all men.
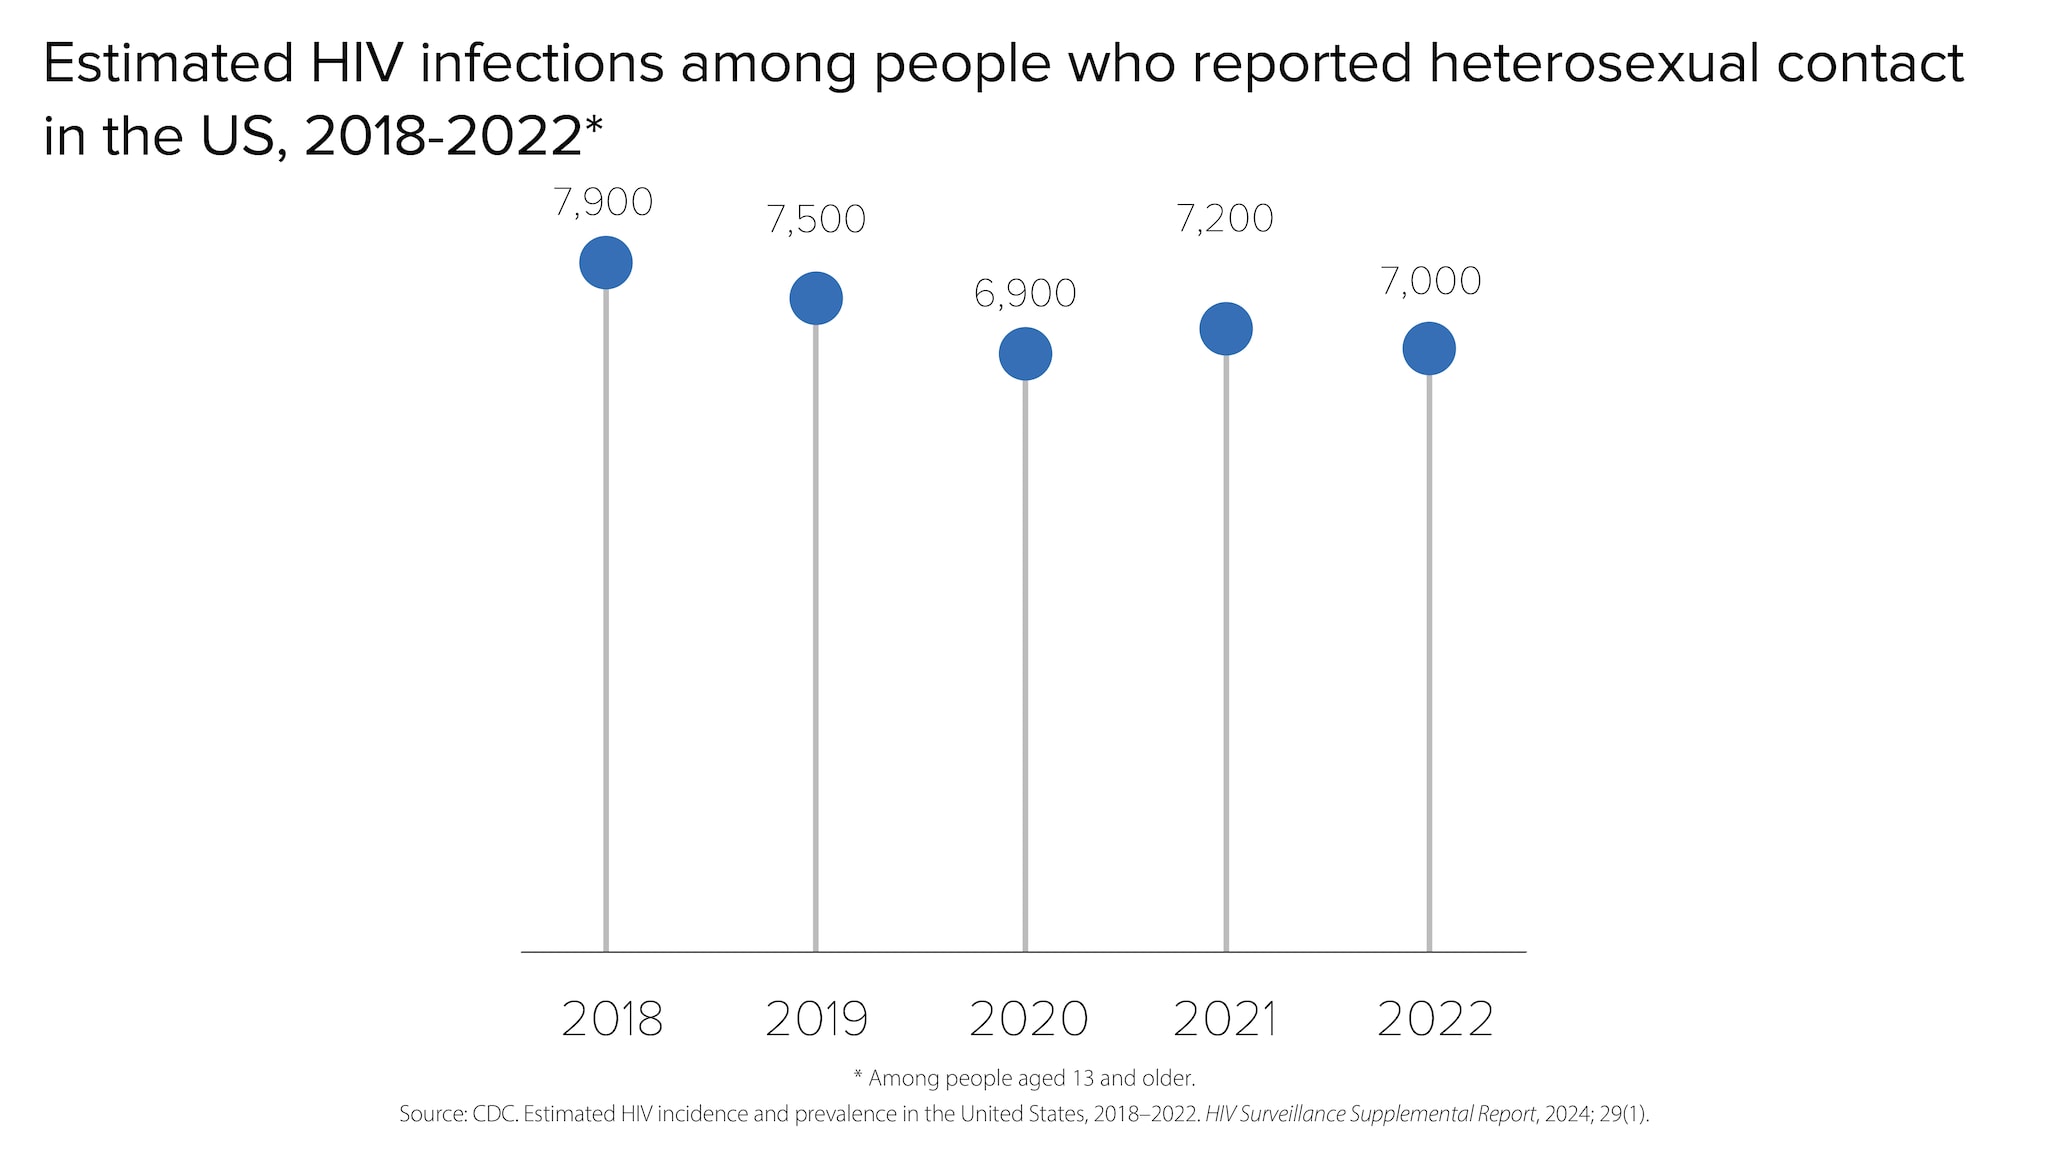
HIV infections among people who reported heterosexual contact
In 2022, people reporting heterosexual contact accounted for 22% (7,000) of the 31,800 estimated new HIV infections.
- Men reporting heterosexual contact accounted for 7% (2,100) of estimated new HIV infections.
- Women reporting heterosexual contact accounted for 15% (4,900) of estimated new HIV infections.
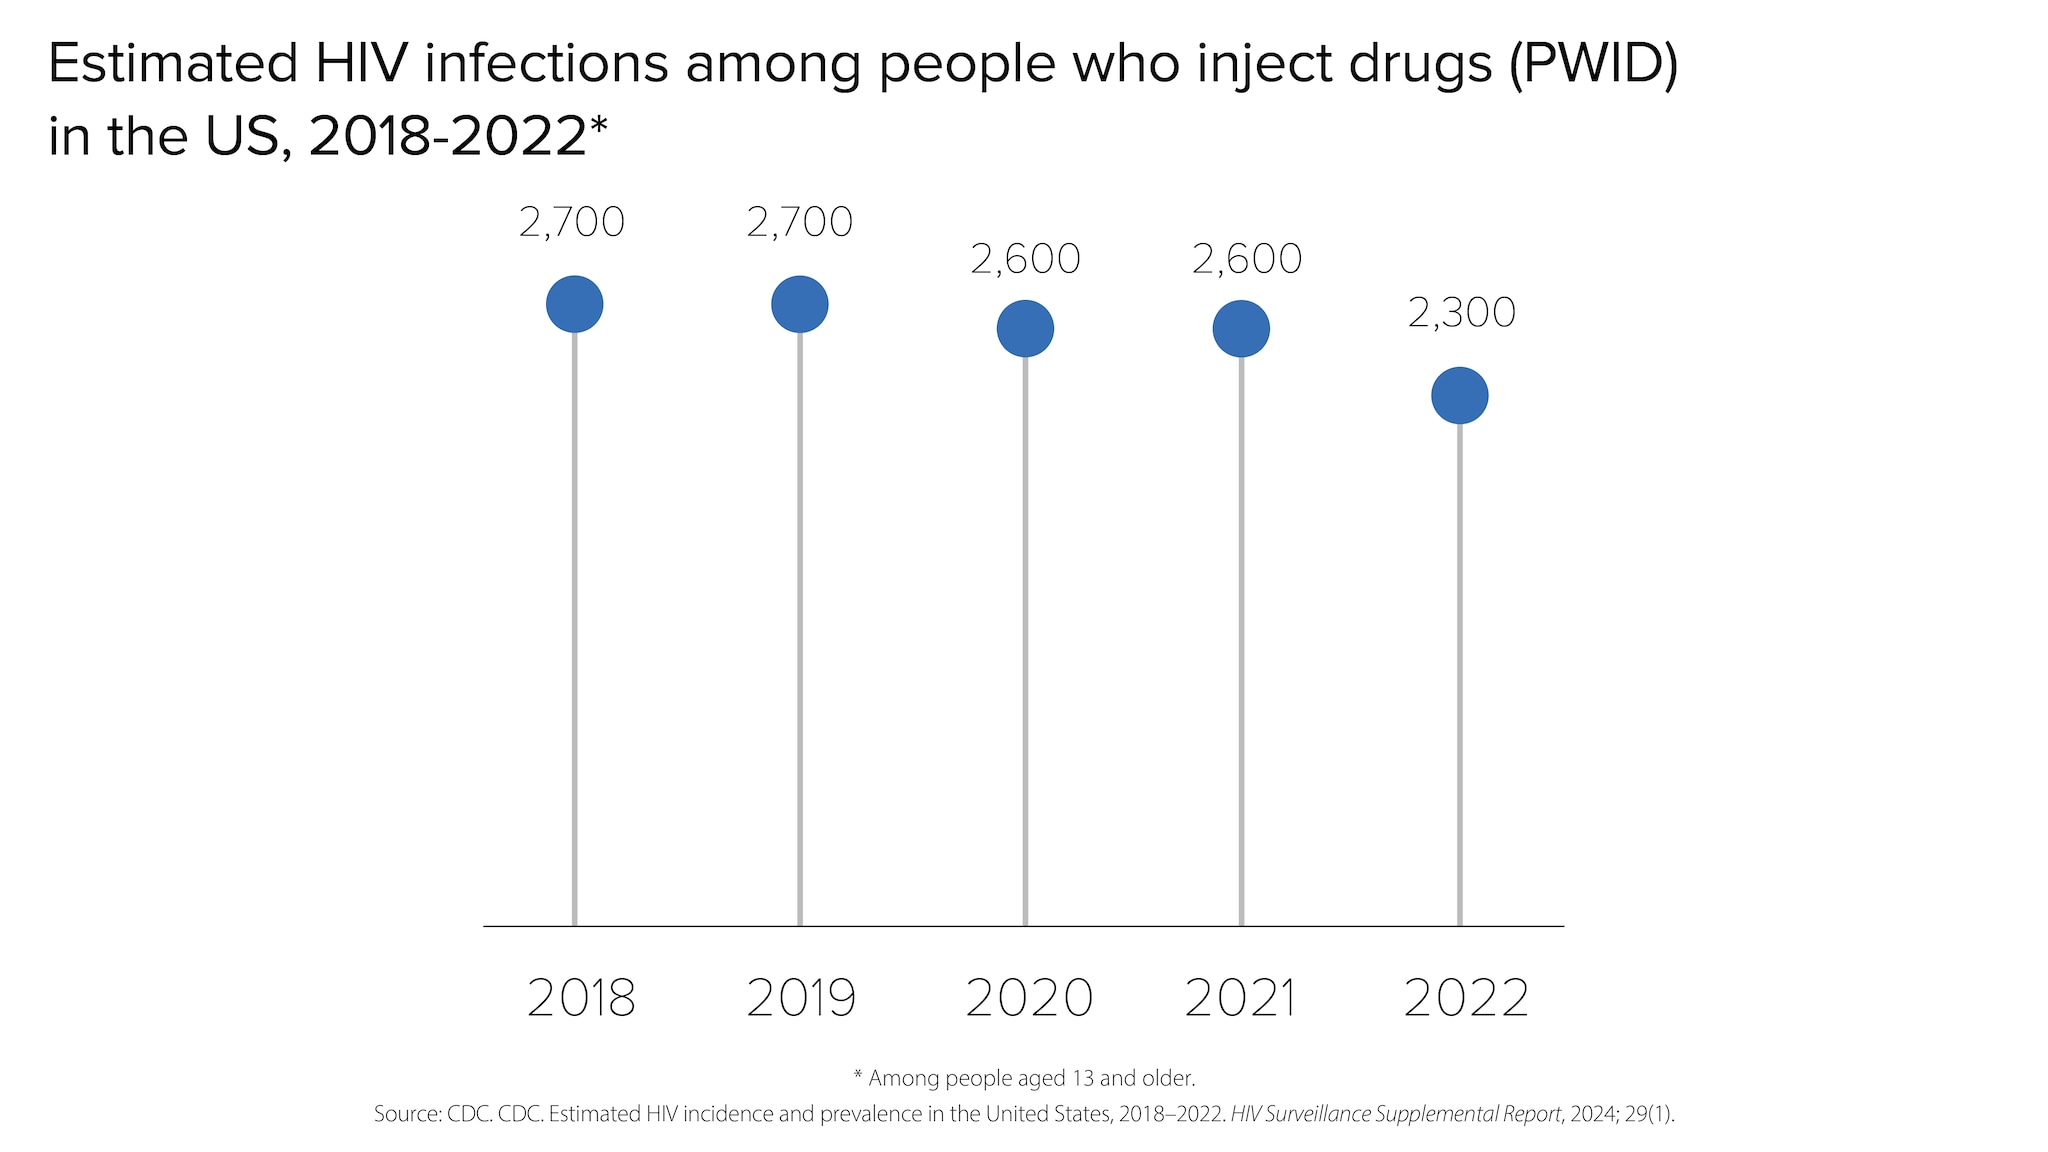
HIV infections among people who inject drugs (PWID)
In 2022, PWID accounted for 7% (2,300) of the 31,800 estimated new HIV infections.
- Men who inject drugs accounted for 4% (1,300) of estimated new HIV infections.
- Women who inject drugs accounted for 3% (1,000) of estimated new HIV infections.
HIV infections by region
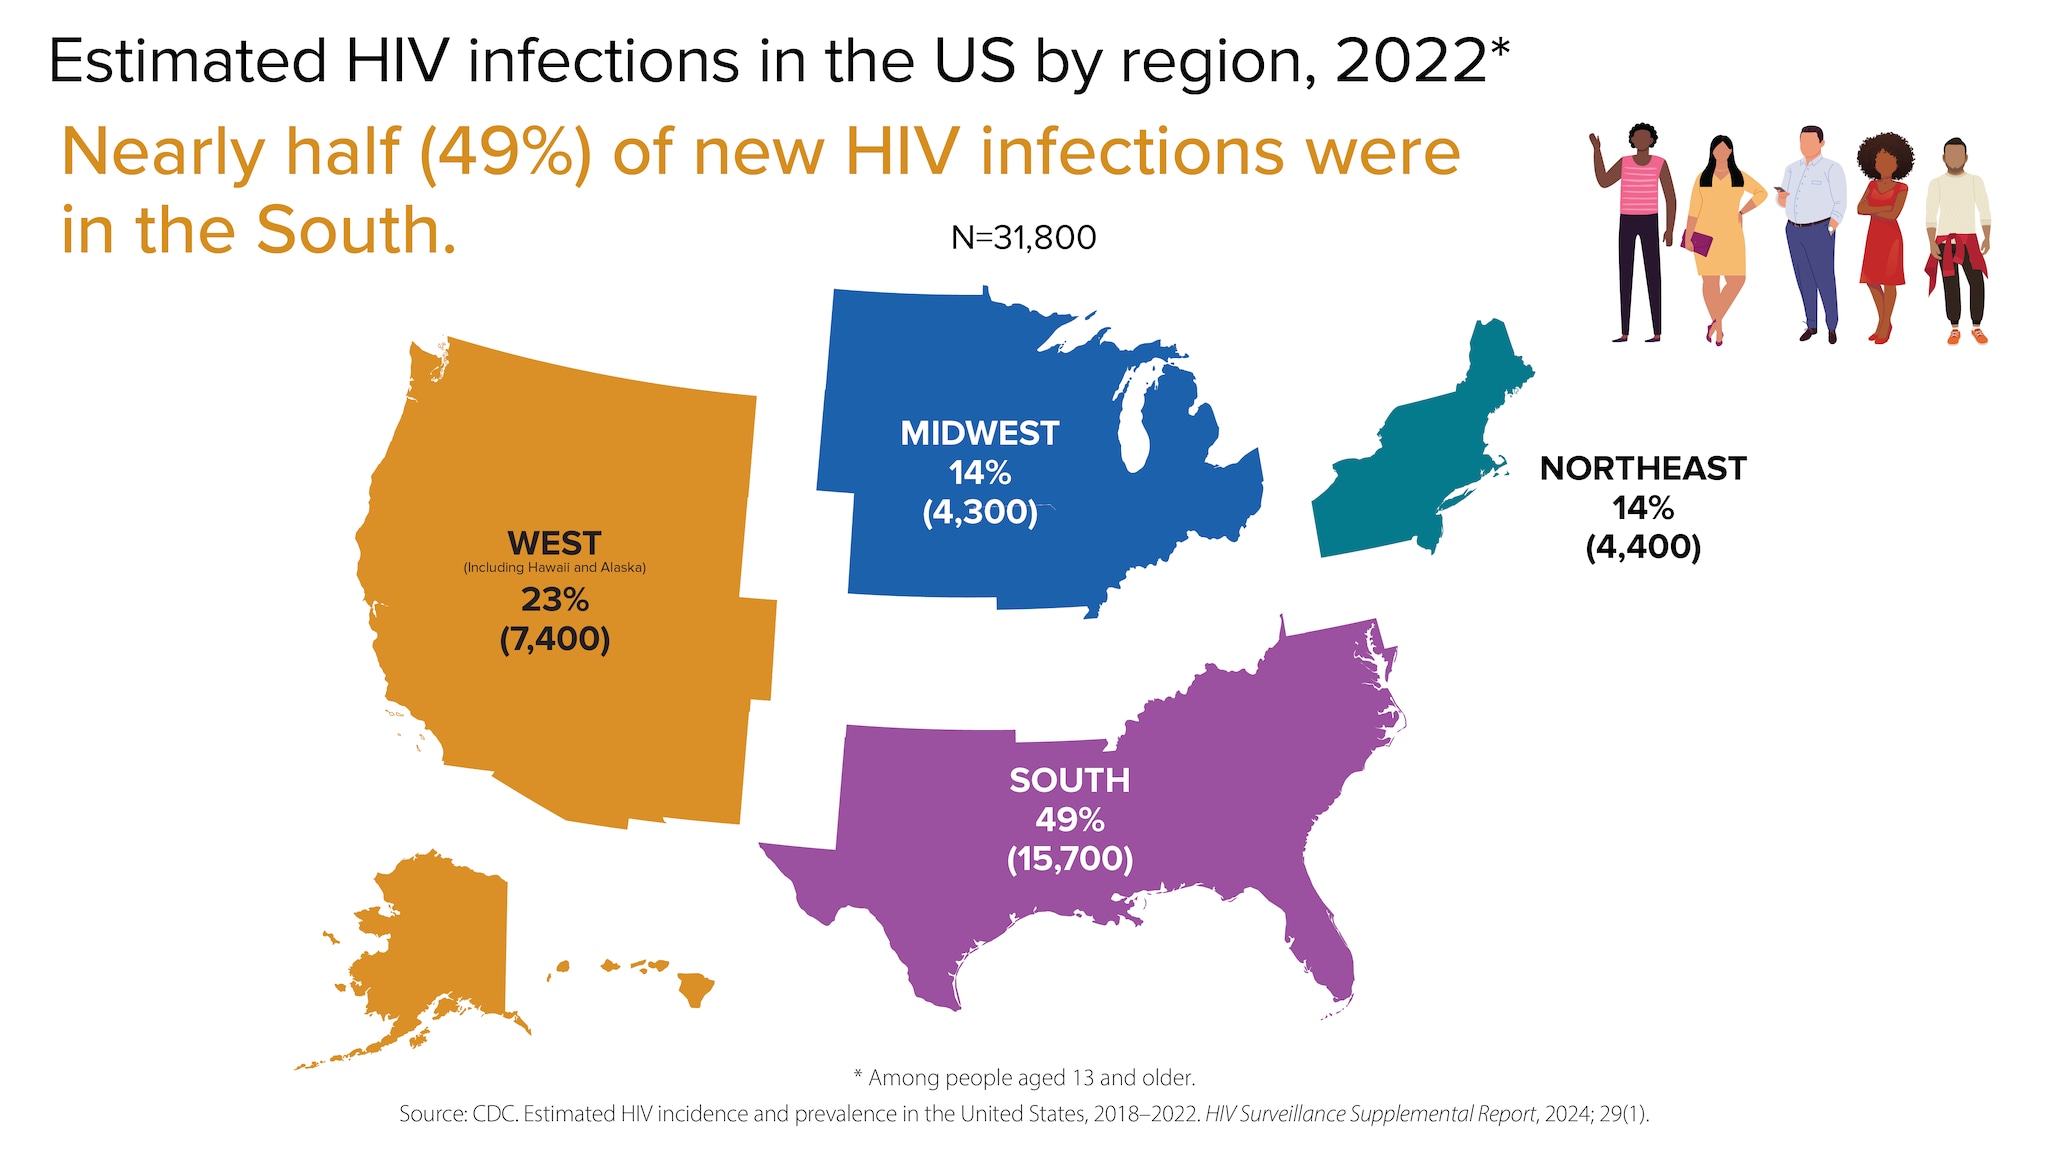
In 2022, the South accounted for nearly half (49%) of the 31,800 estimated new HIV infections.
HIV diagnoses
HIV diagnoses refers to the number of people who received an HIV diagnosis during a given year.
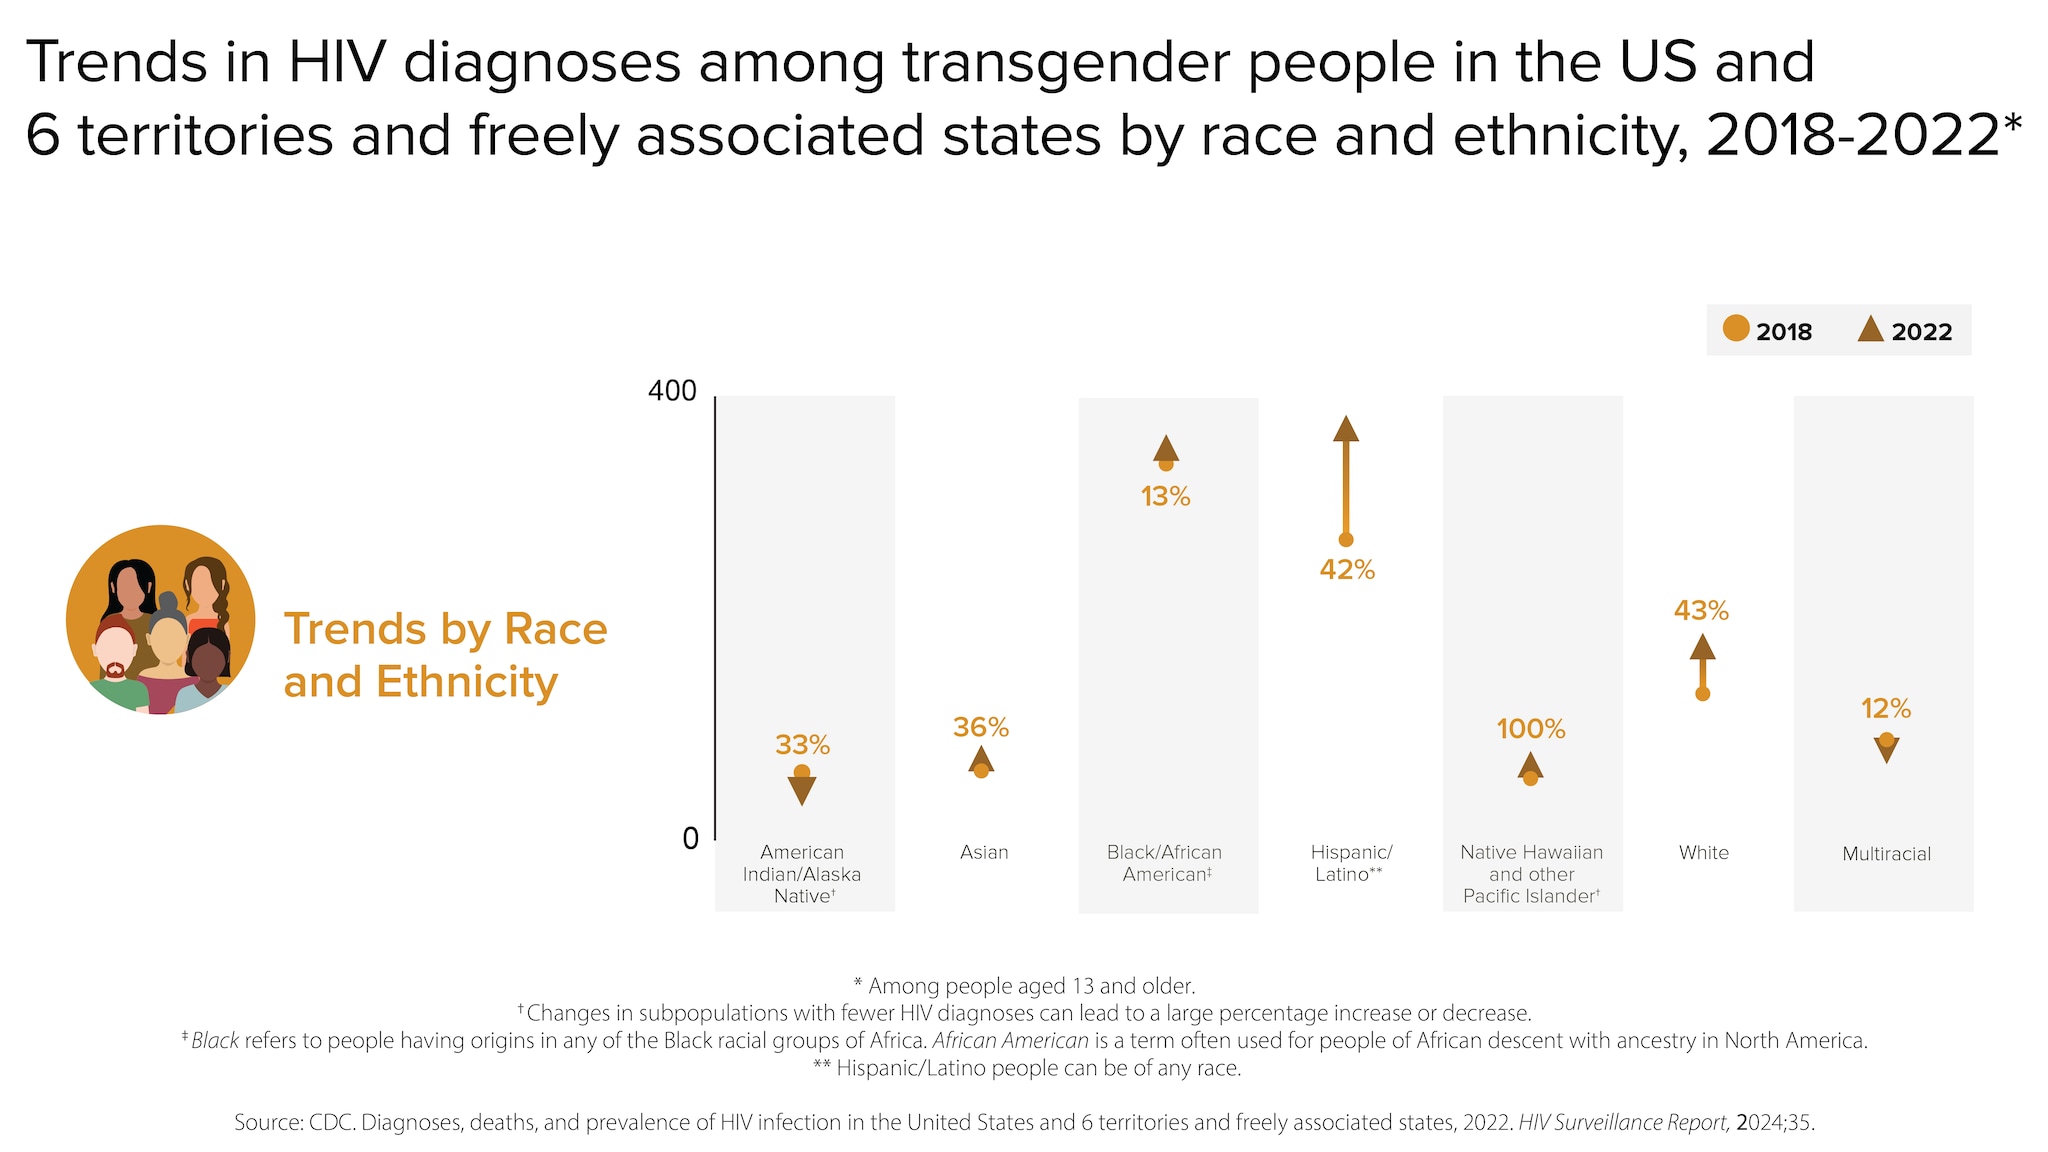
HIV diagnoses among transgender people
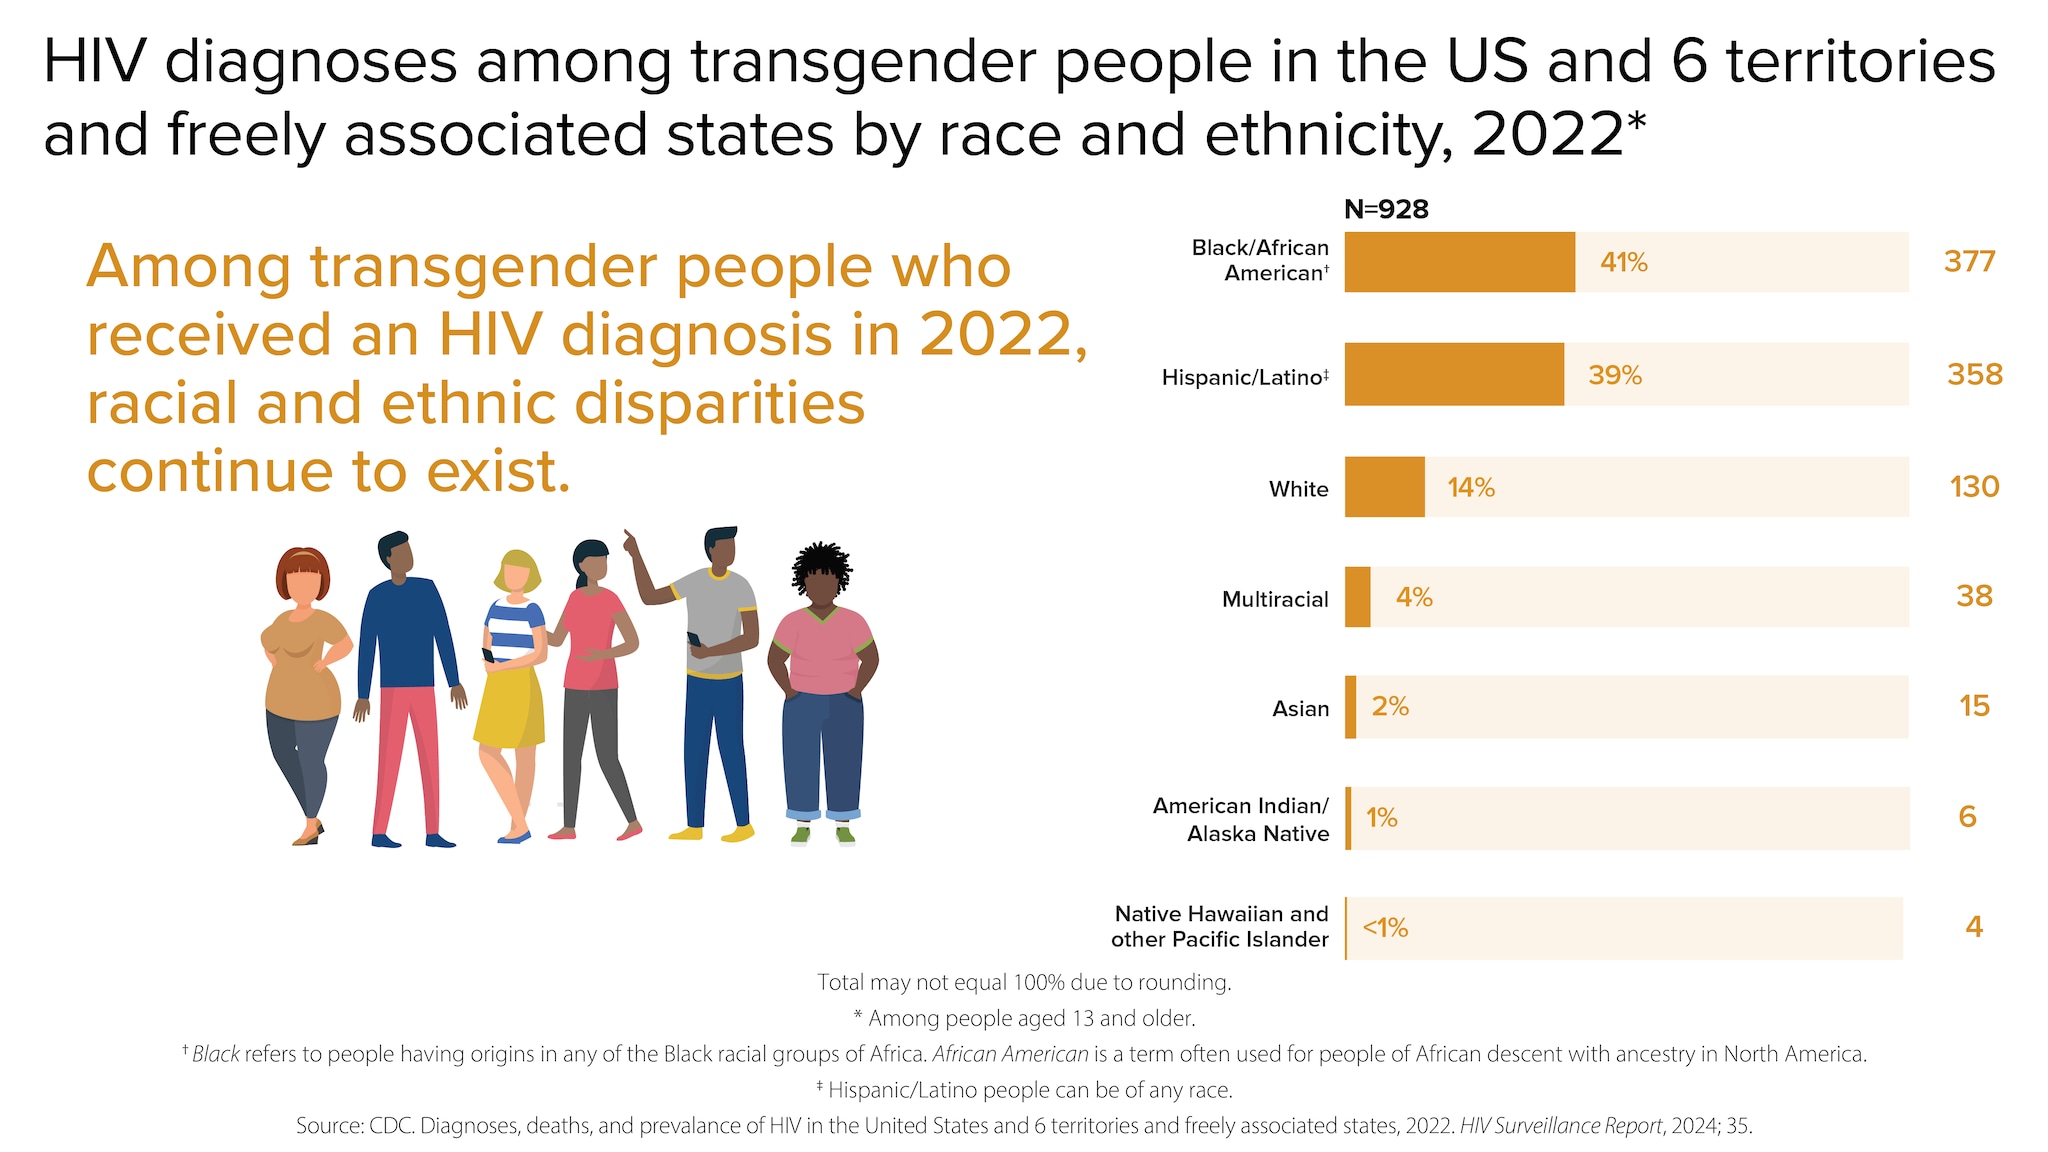
In 2022, transgender people accounted for 2% (928) of the 37,981 new HIV diagnoses.
- Transgender womenaccounted for 2% (869) of new HIV diagnoses.
- Transgender menaccounted for less than 1% (59) of new HIV diagnoses.
HIV diagnoses among gay and bisexual men
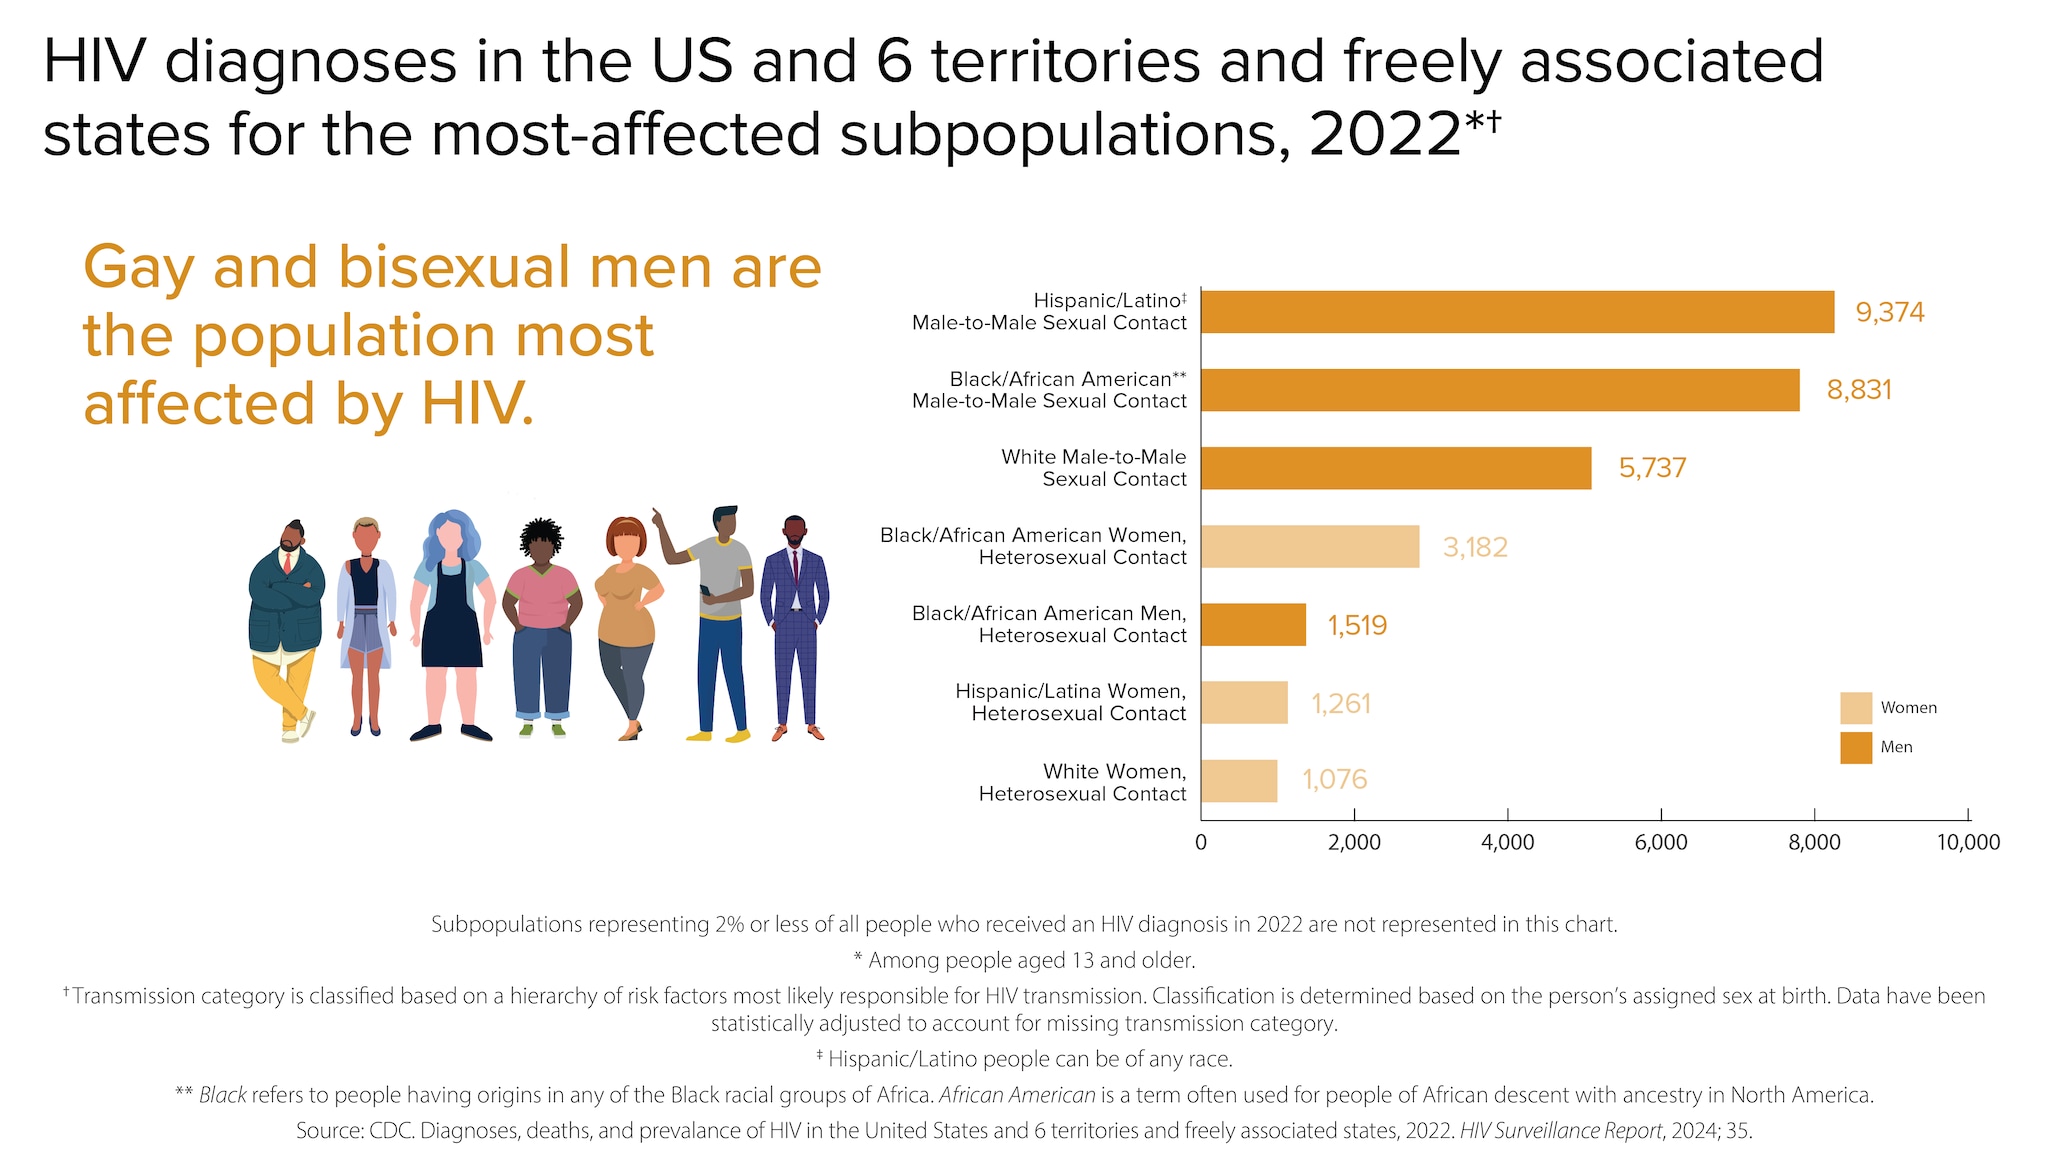
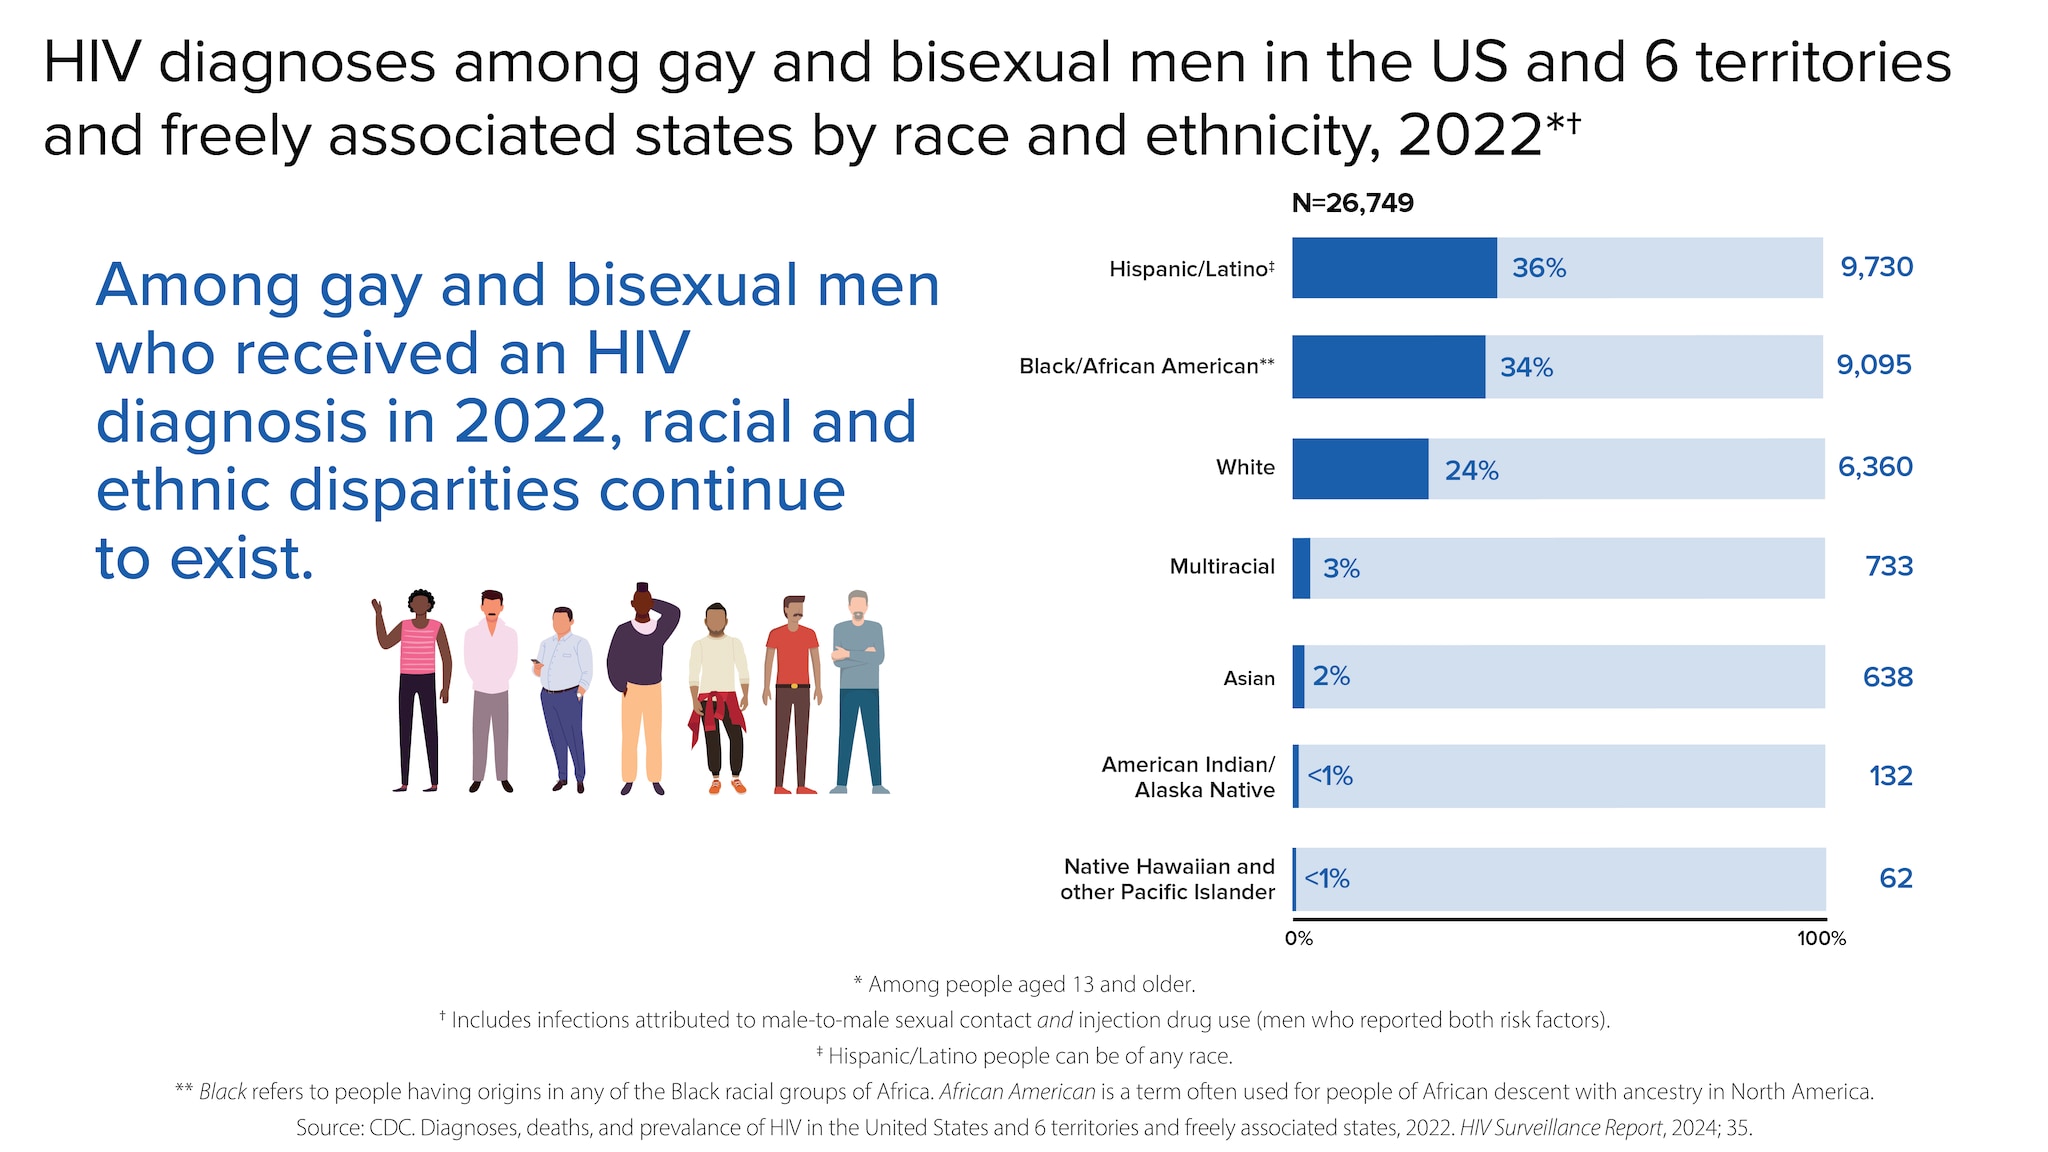
Gay, bisexual, and other men who reported male-to-male sexual contact are the population most affected by HIV. In 2022, gay and bisexual men accounted for 67% (25,482) of the 37,981 new HIV diagnoses and 86% of diagnoses among all men.
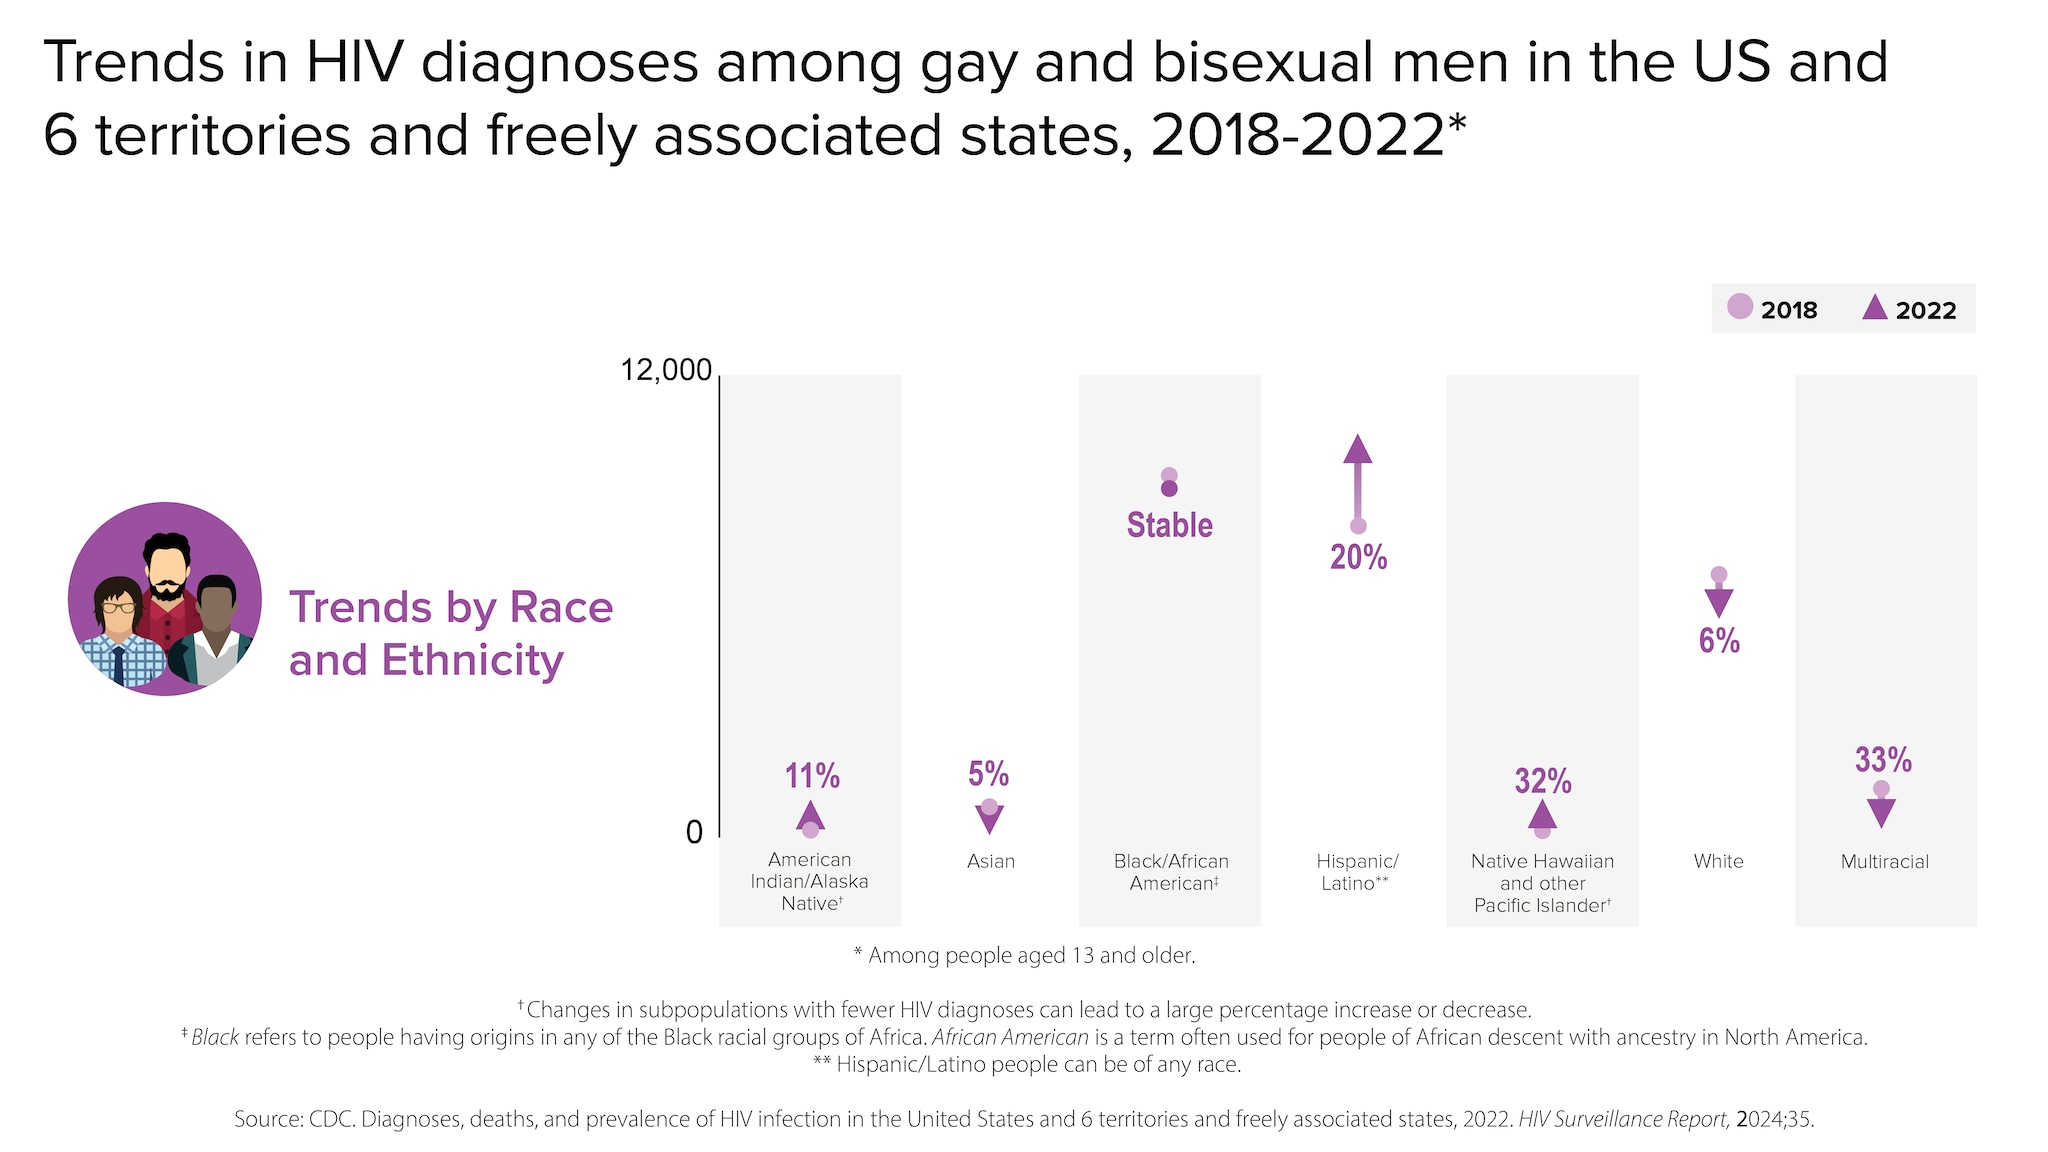
From 2018 to 2022, HIV diagnoses were stable among gay and bisexual men overall. But trends varied for different groups of gay and bisexual men.
HIV diagnoses among people who reported heterosexual contact
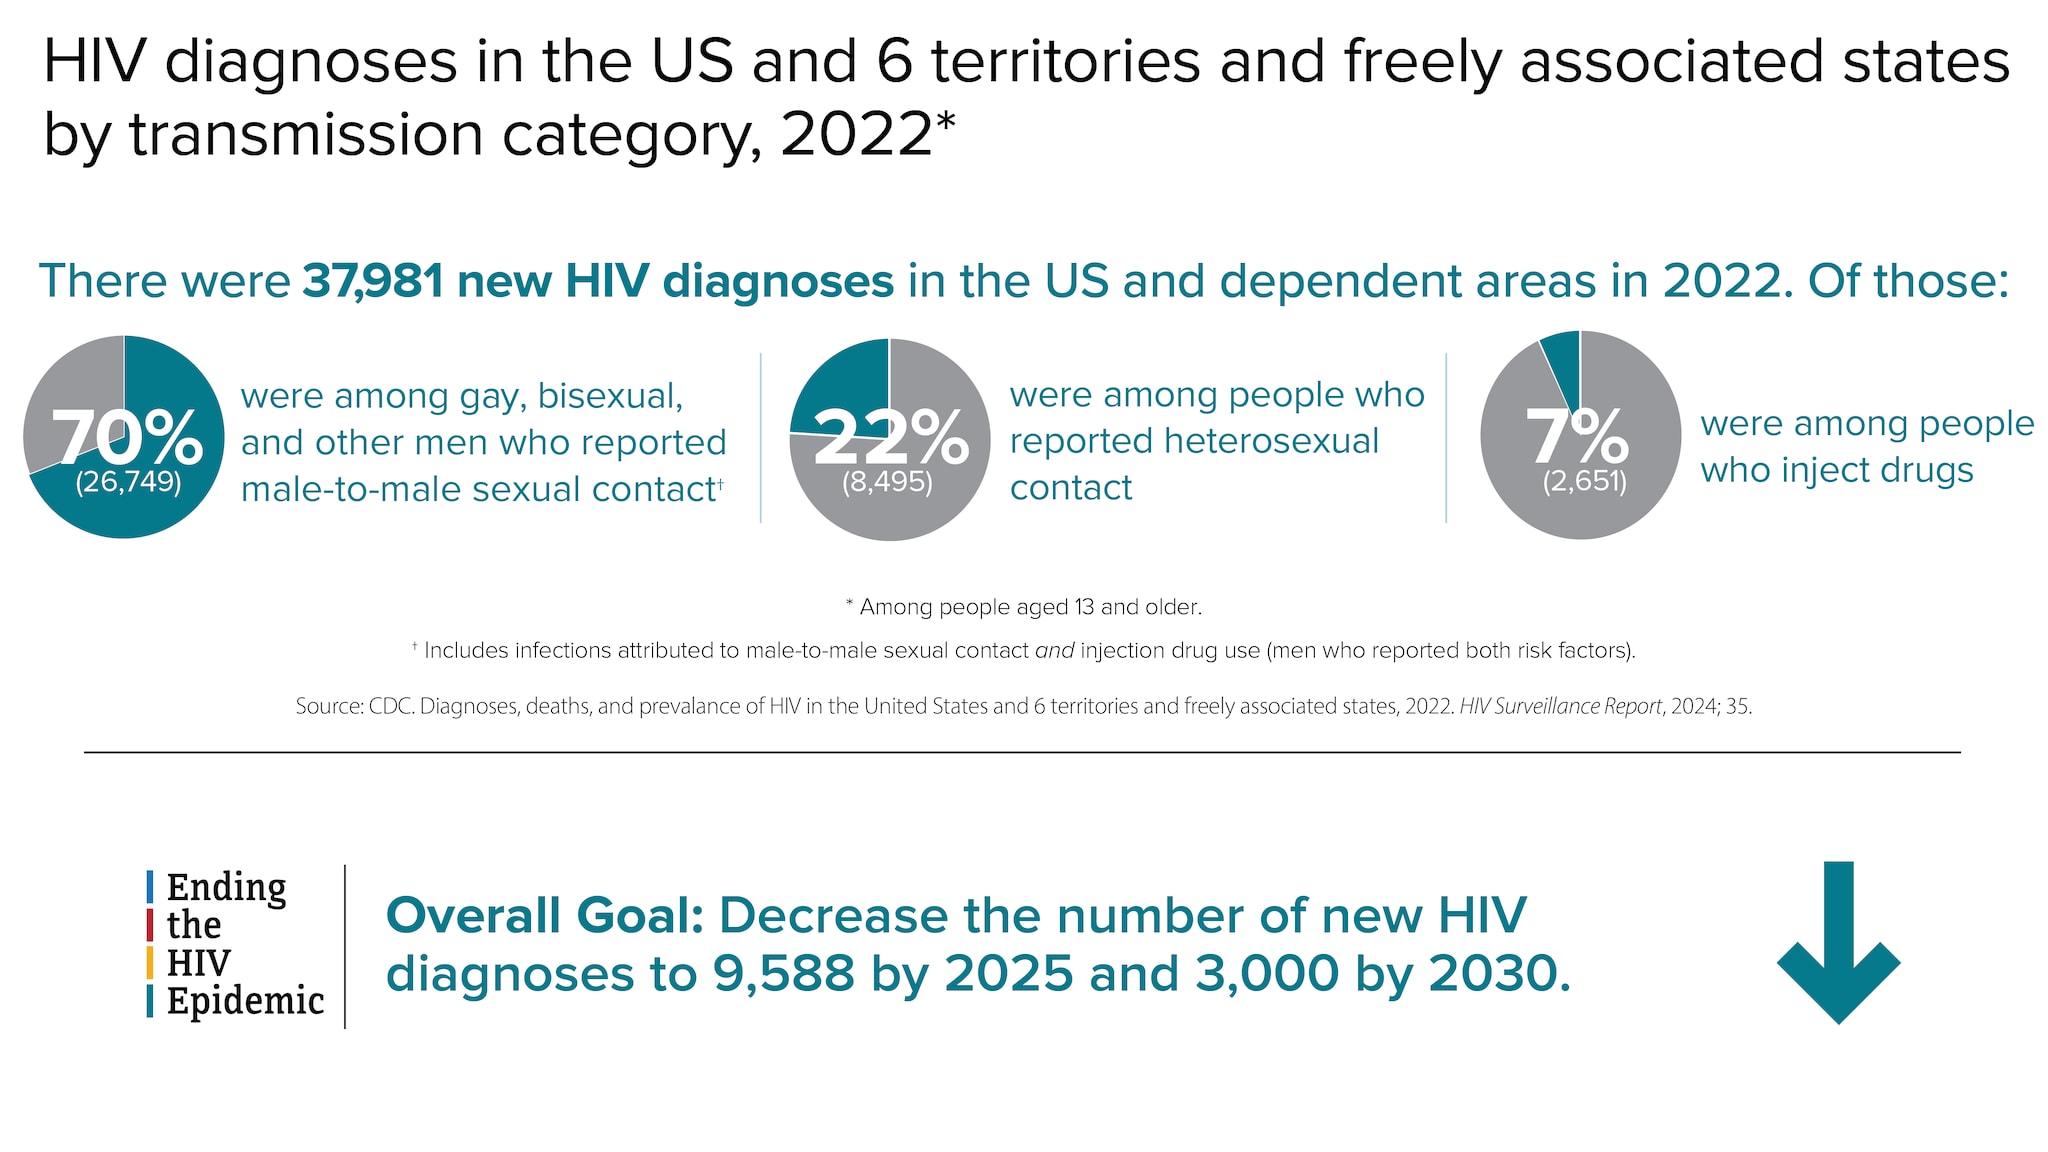
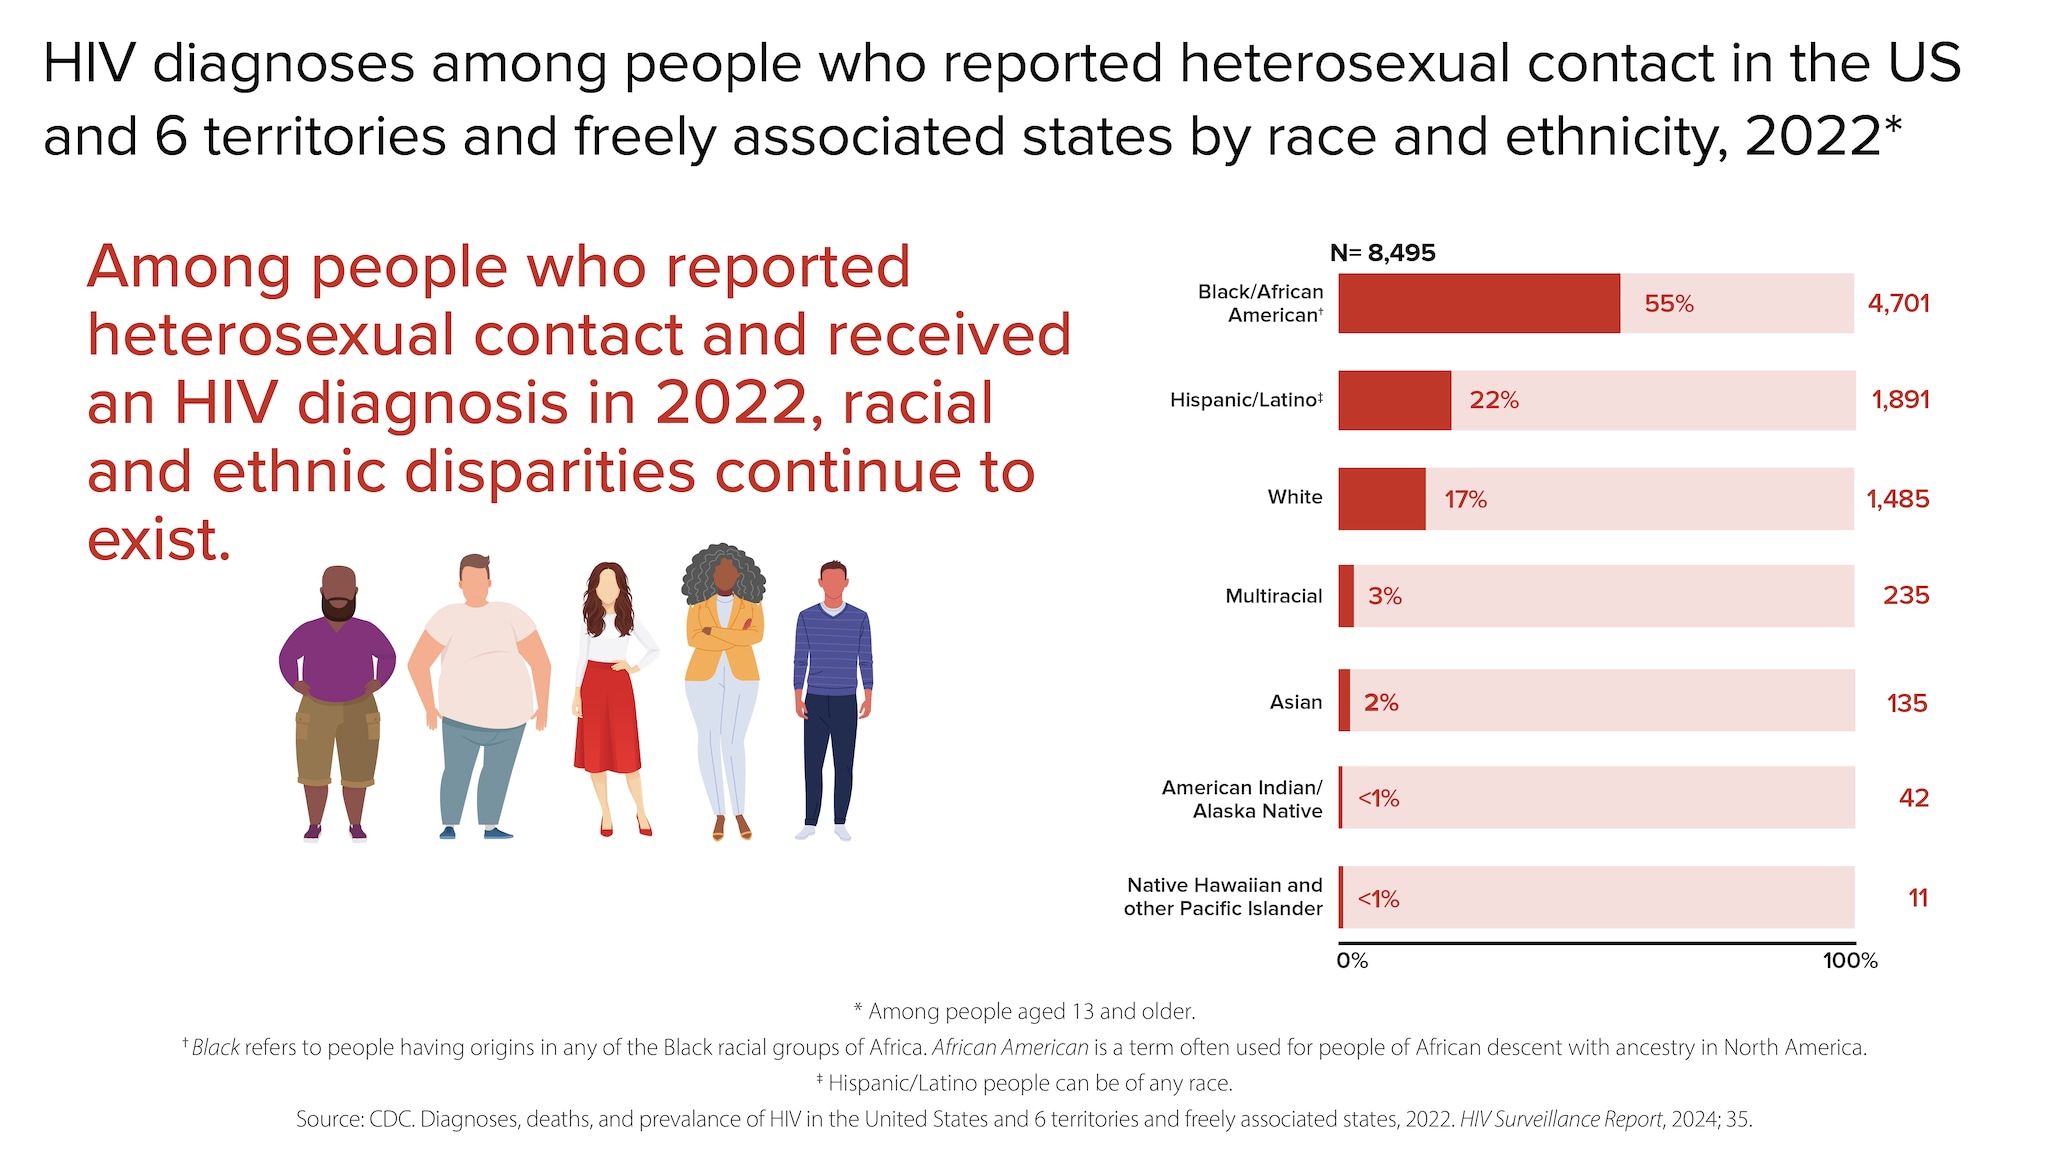
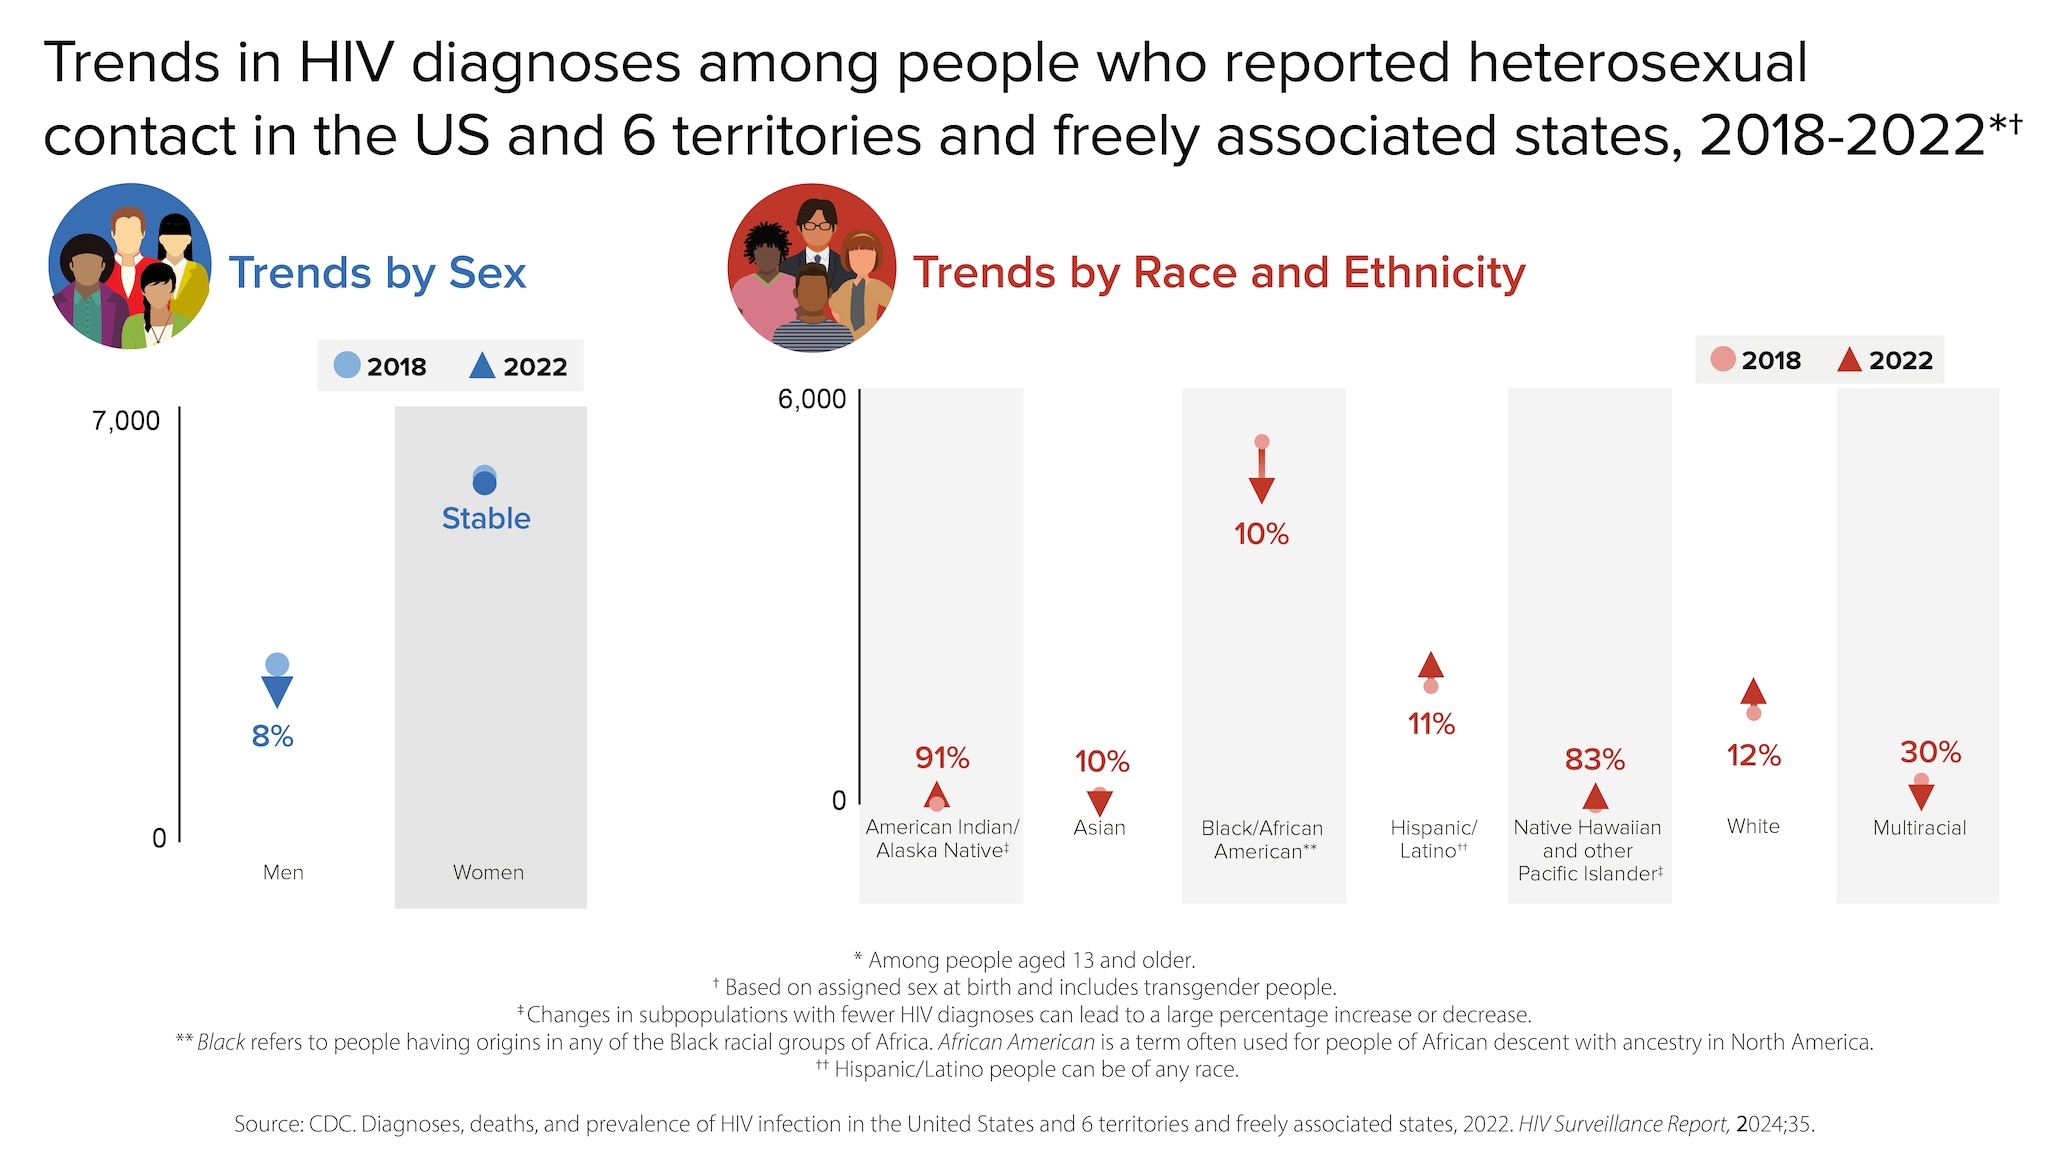
Men and women who reported heterosexual contact continue to be affected by HIV. In 2022, people reporting heterosexual contact accounted for 22% (8,495) of the 37,981 new HIV diagnoses.
- Men reporting heterosexual contact accounted for 7% (2,660) of new HIV diagnoses.
- Women reporting heterosexual contact accounted for 15% (5,835) of new HIV diagnoses.
From 2018 to 2022, HIV diagnoses from heterosexual contact remained stable overall.
HIV diagnoses among people who inject drugs (PWID)
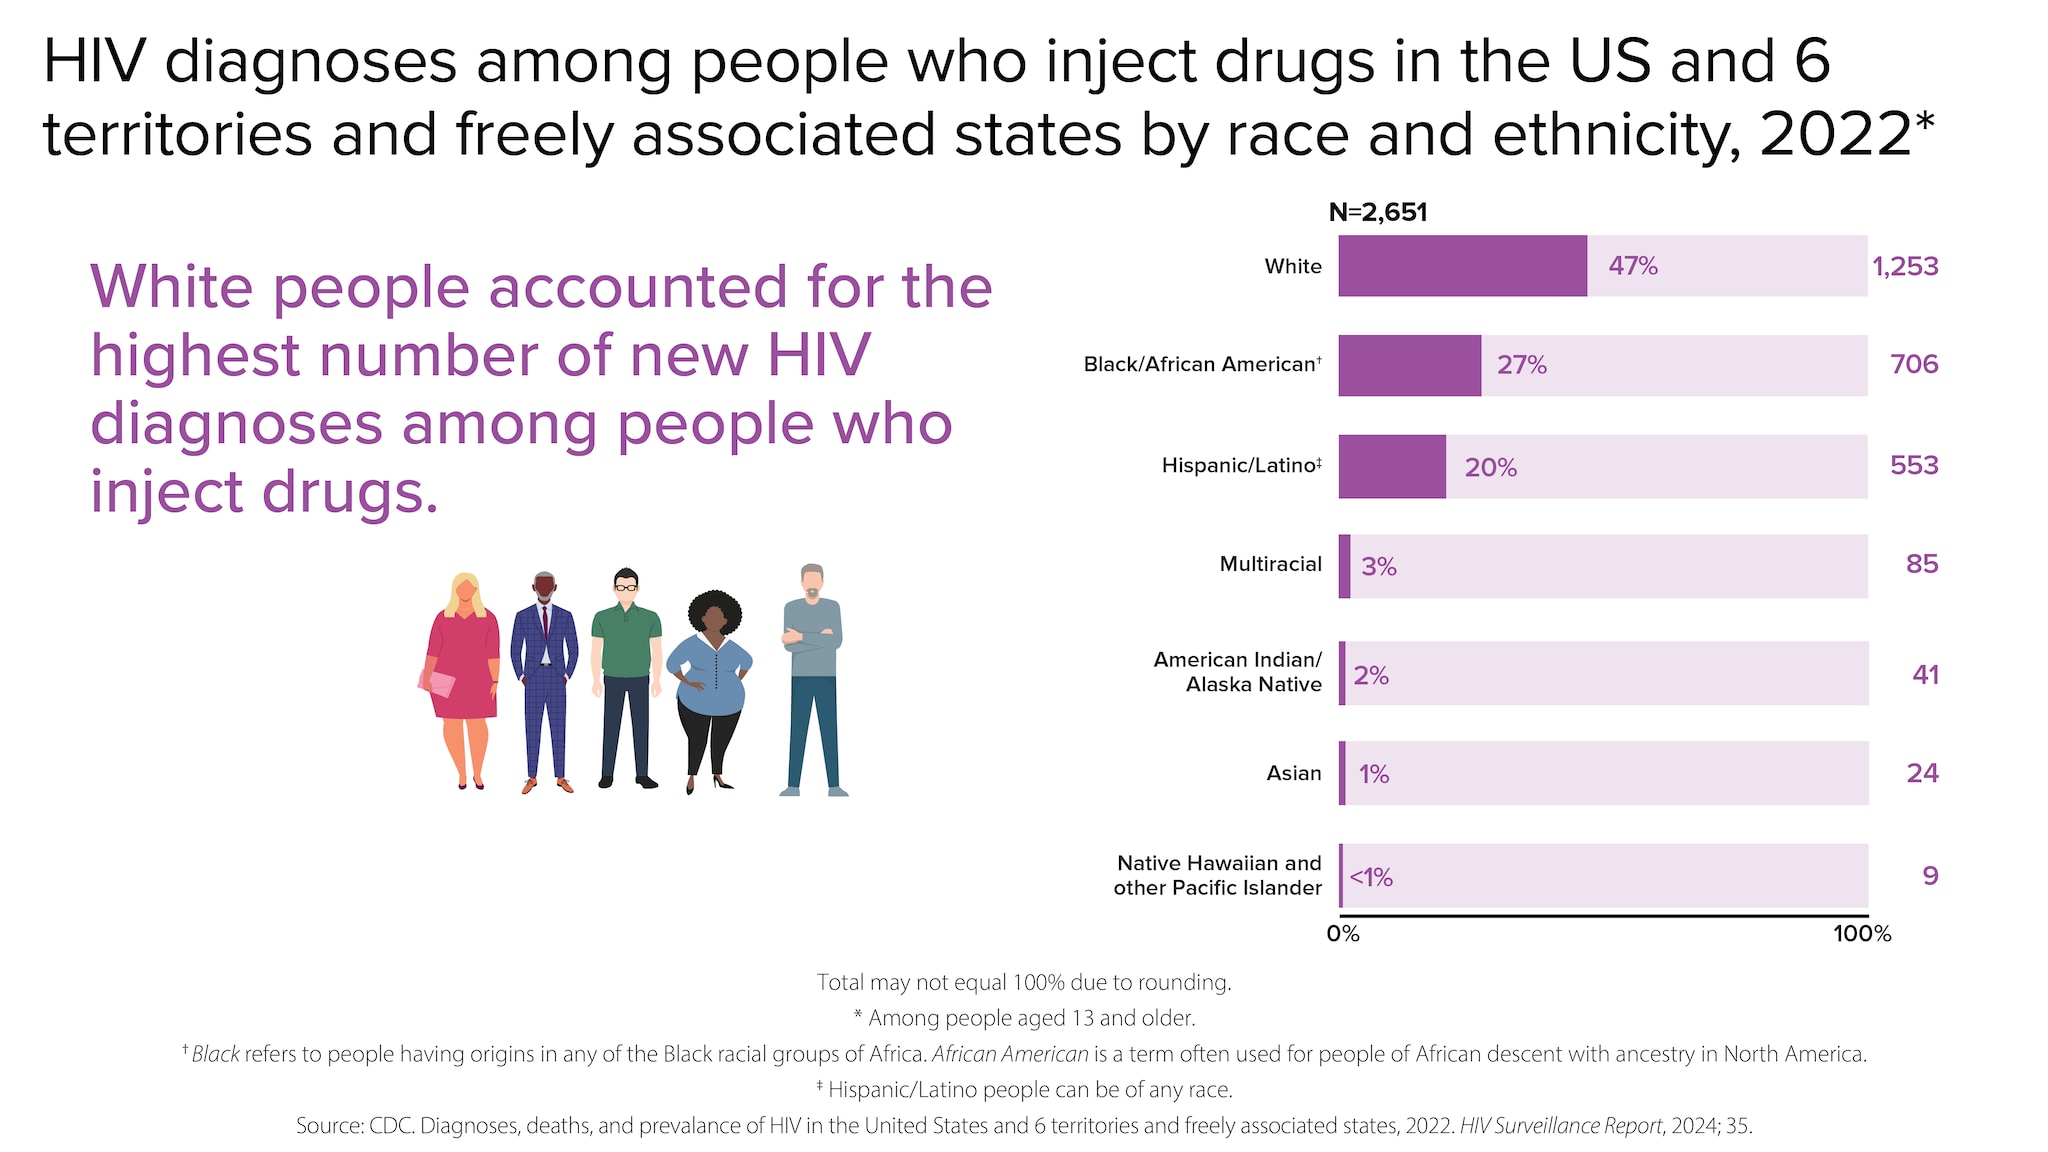
In 2022, PWID accounted for 7% (2,651) of the 37,981 new HIV diagnoses.
- Men who inject drugs accounted for 4% (1,490) of new HIV diagnoses.
- Women who inject drugs accounted for 3% (1,161) of new HIV diagnoses.
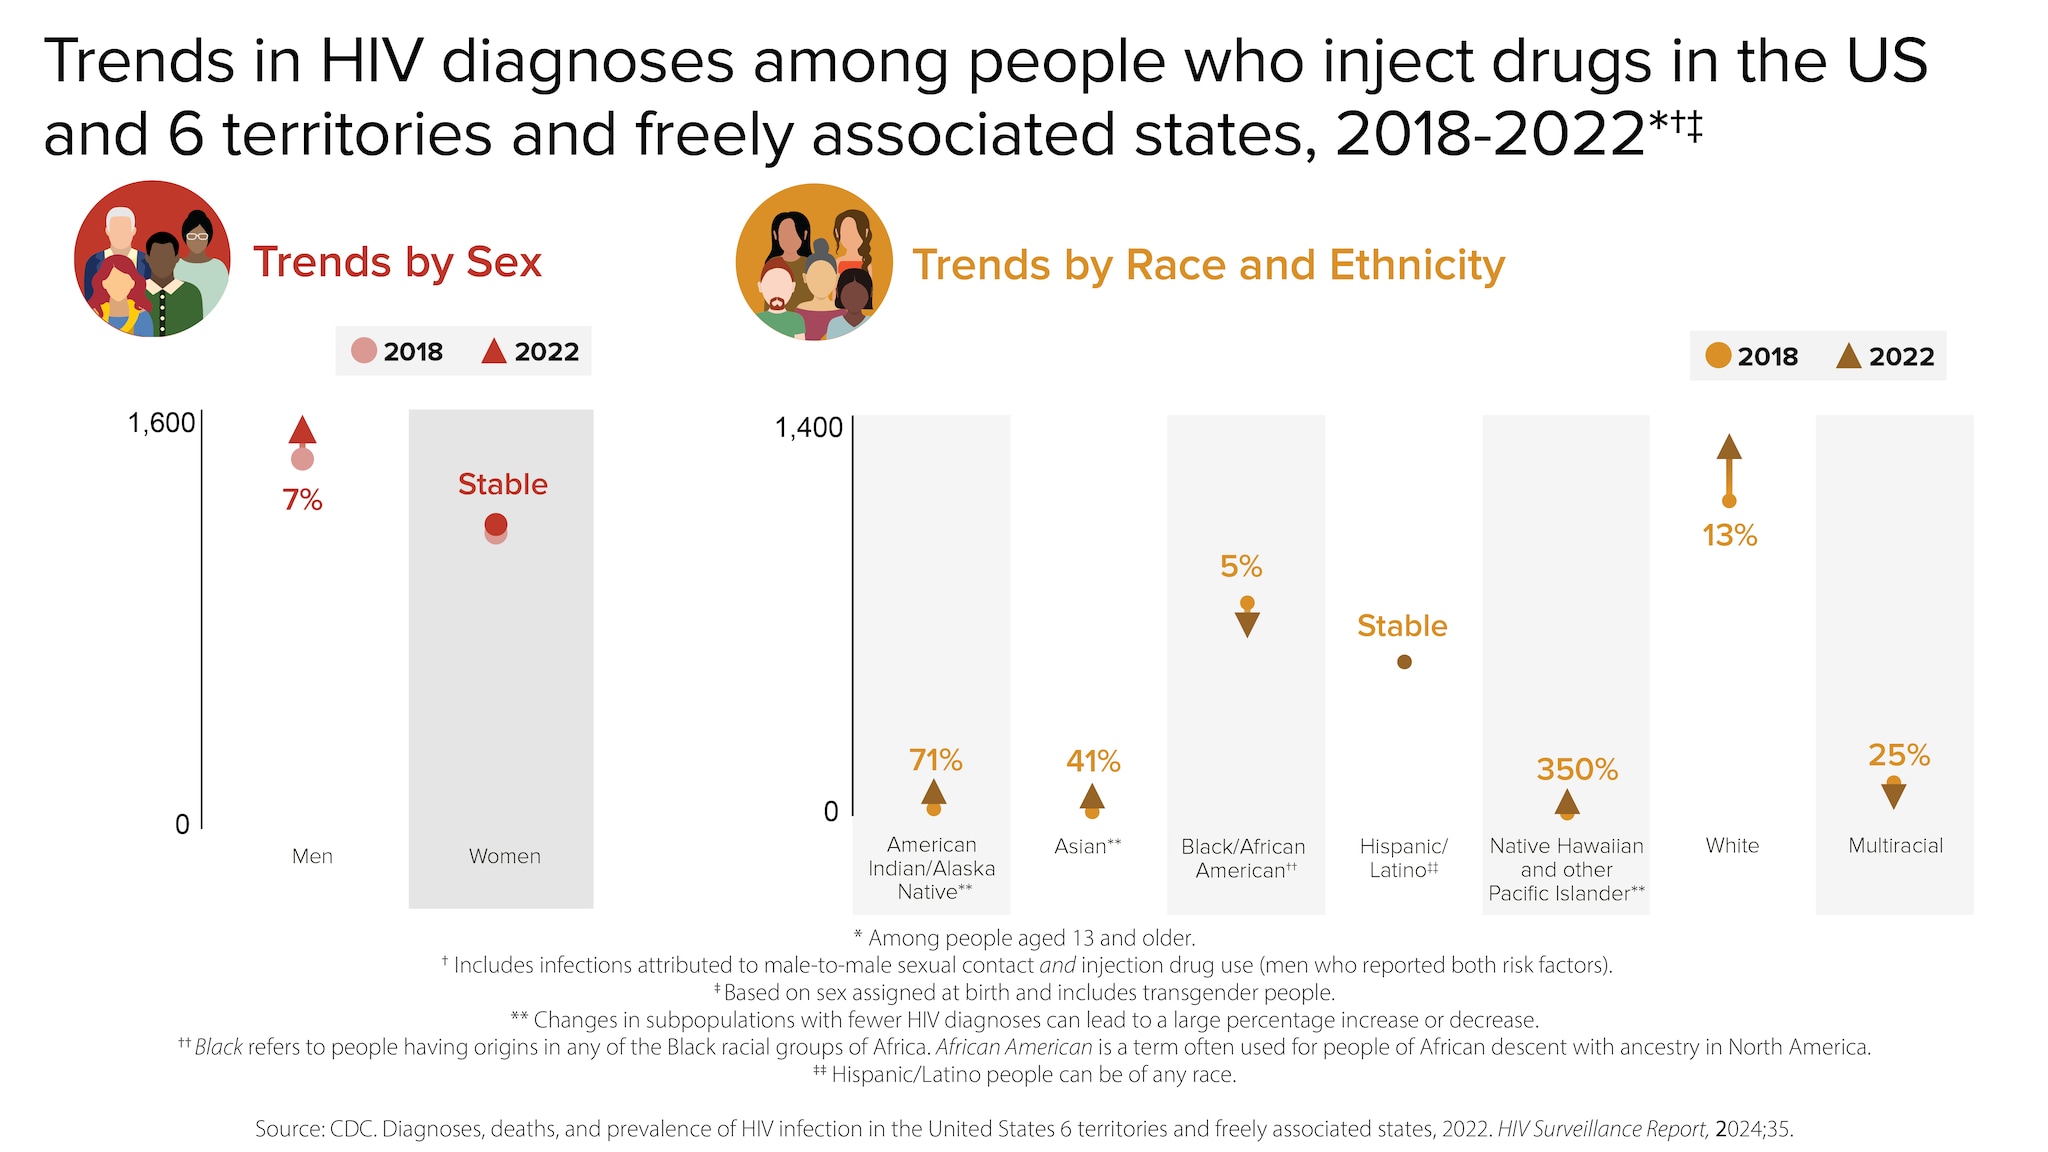
From 2018 to 2022, HIV diagnoses increased 5% among PWID overall.
HIV diagnoses by region
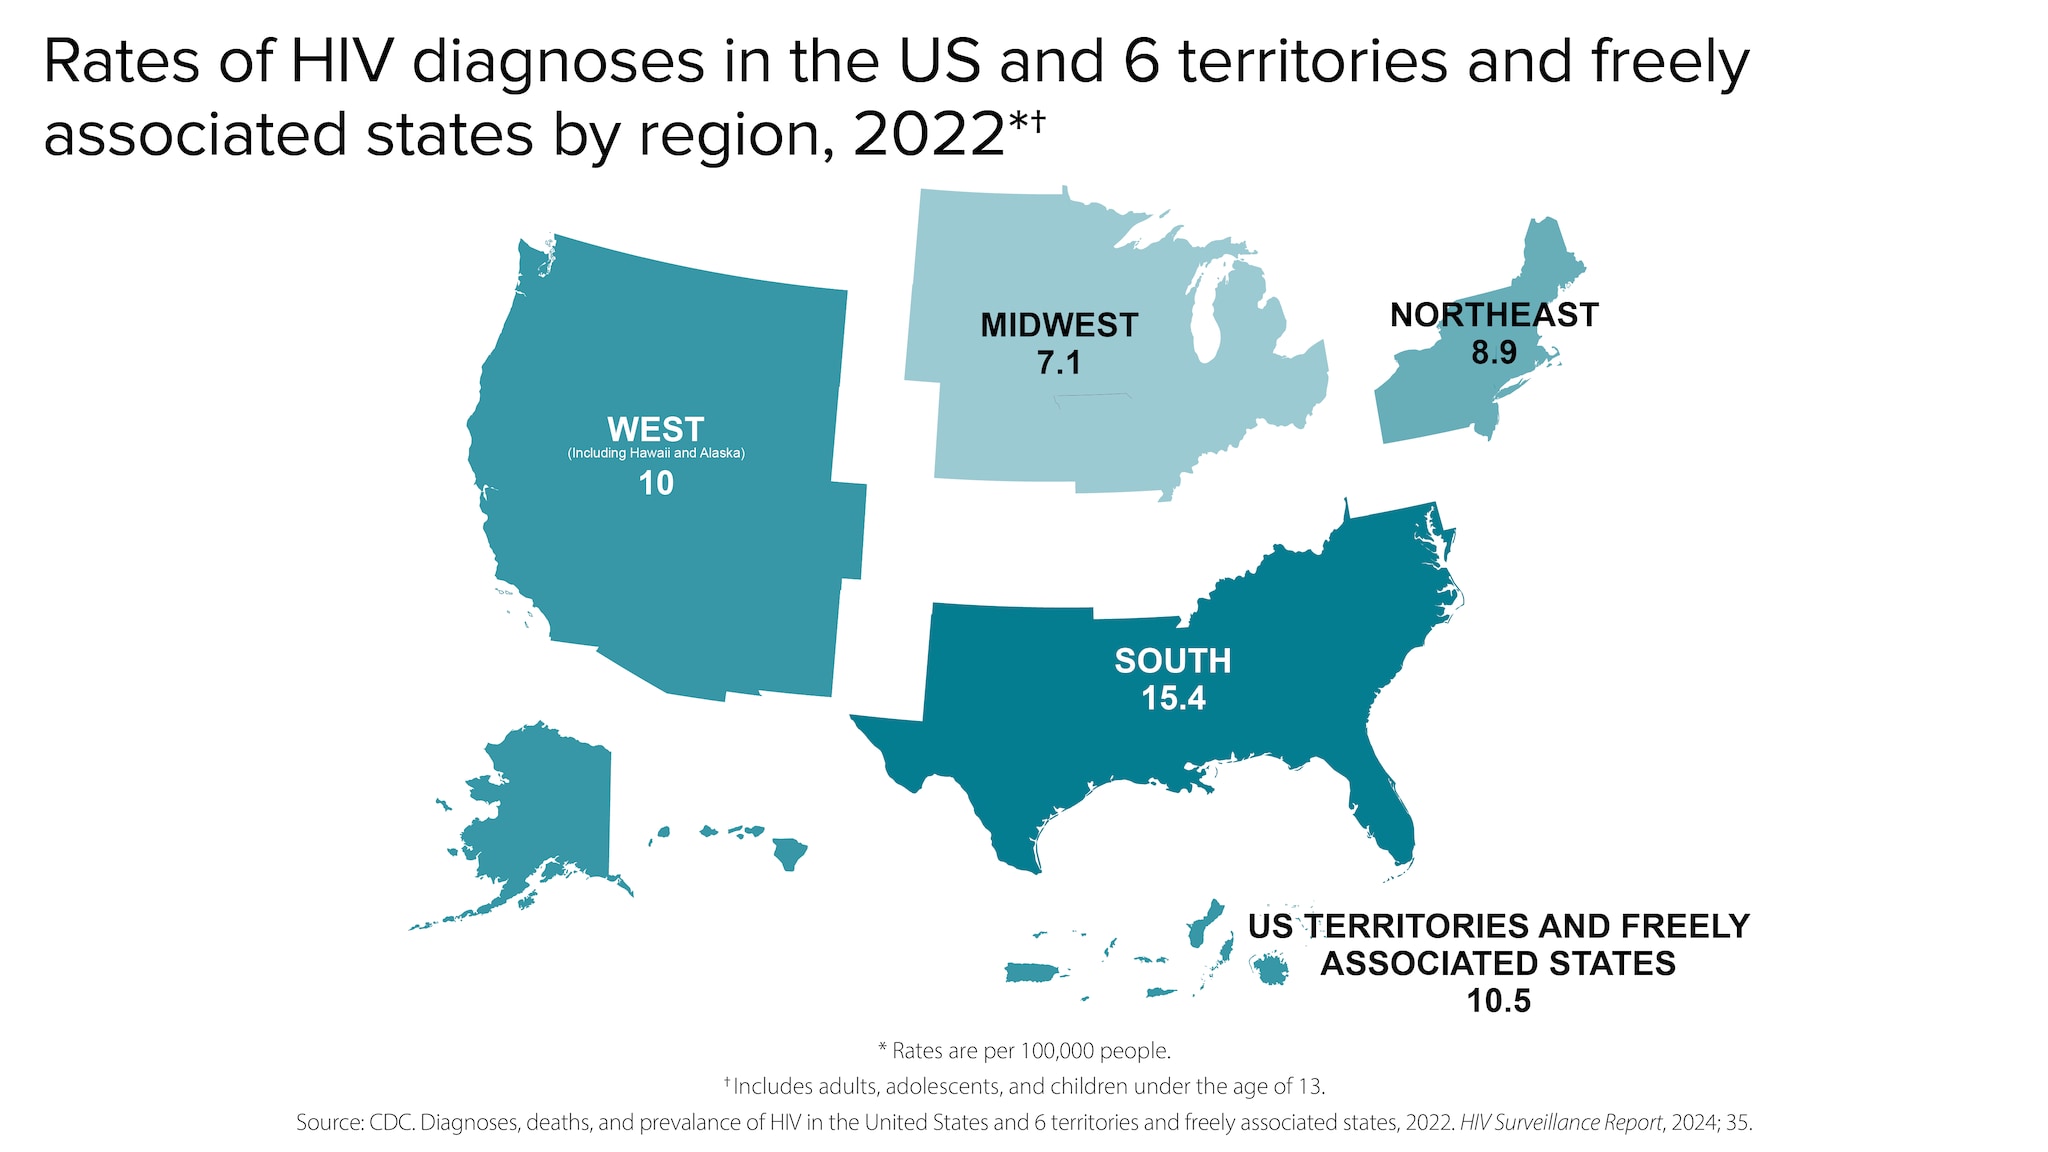
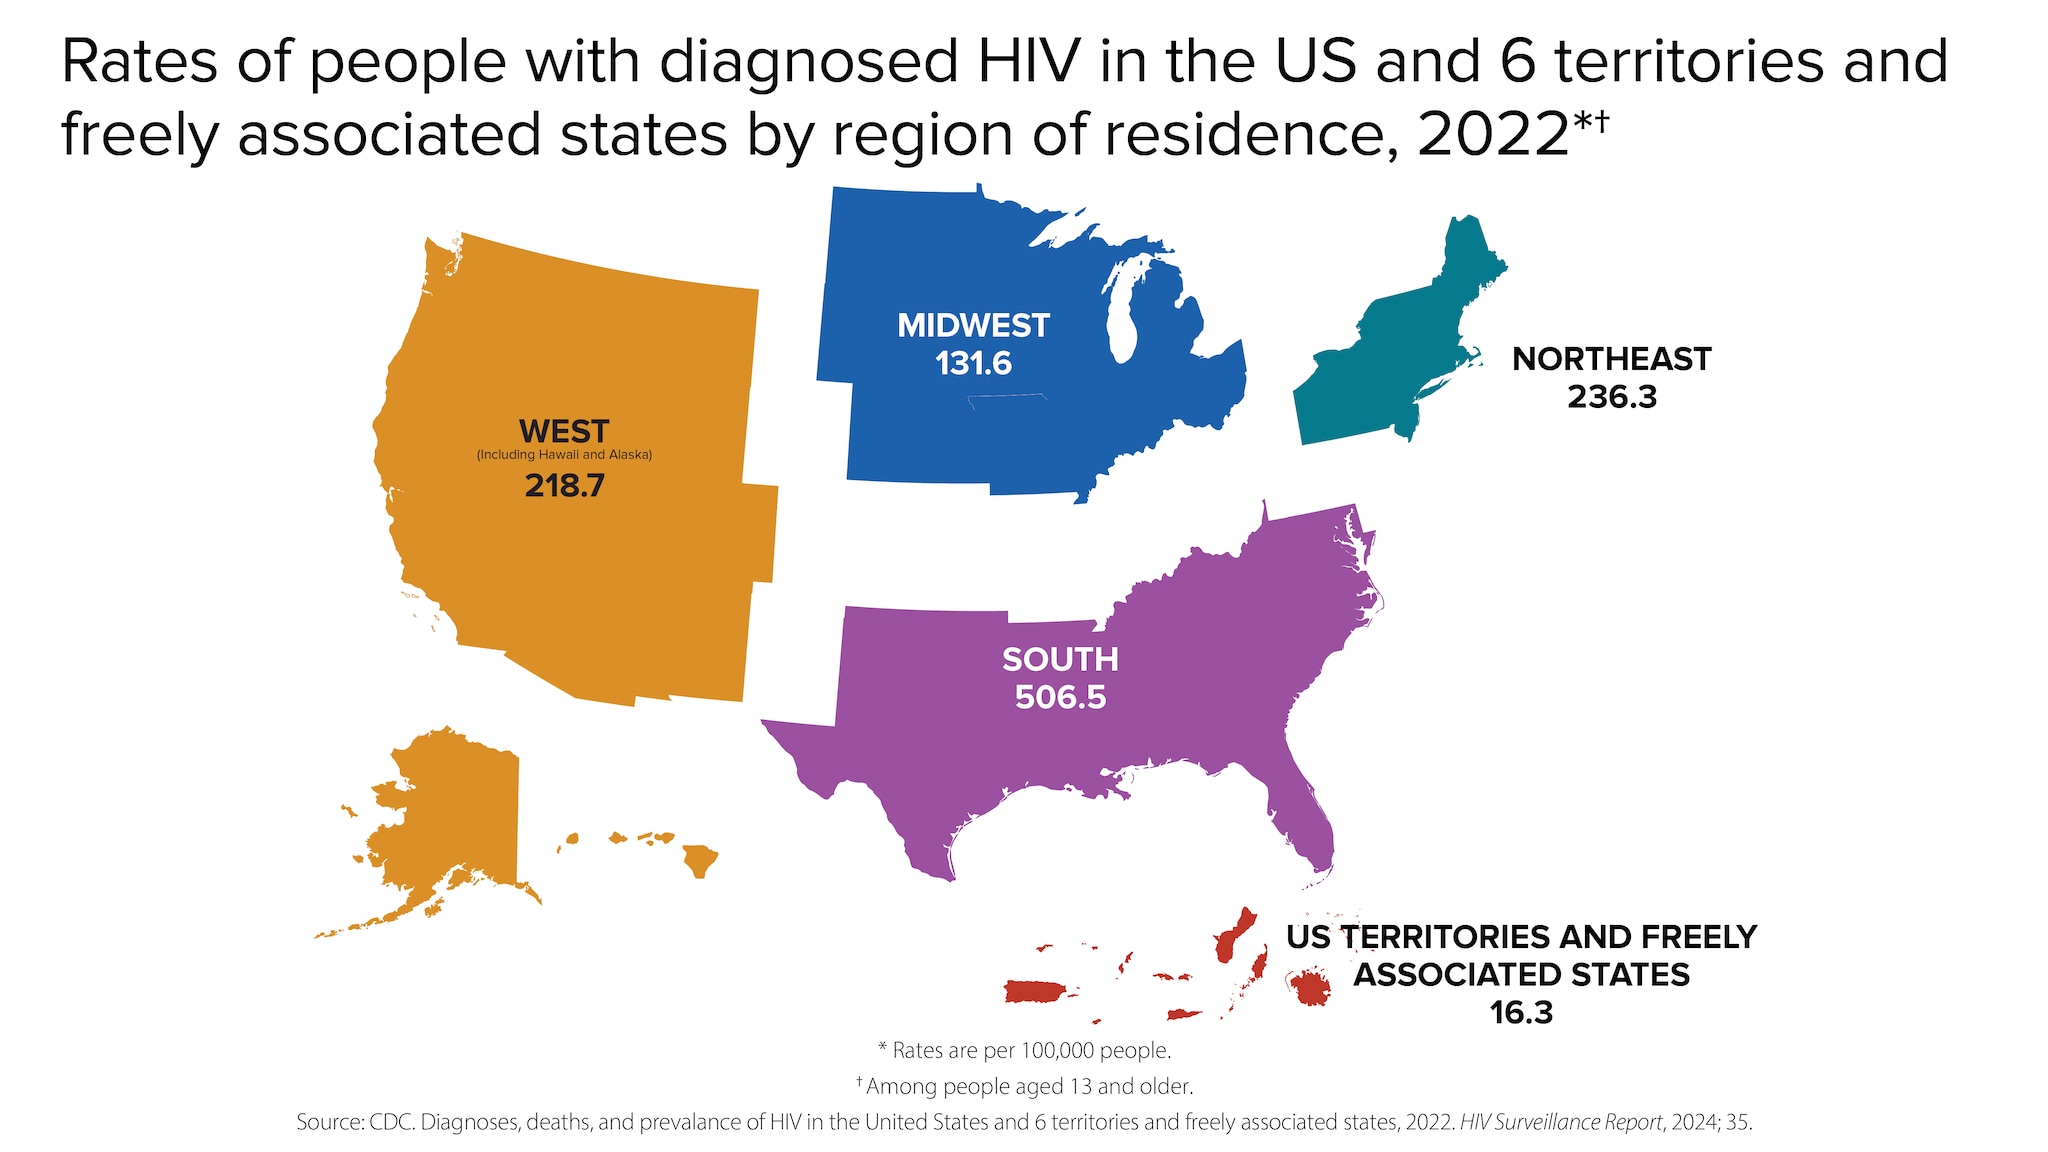
HIV diagnoses are not evenly distributed regionally in the US and 6 territories and freely associated states.
Knowledge of status
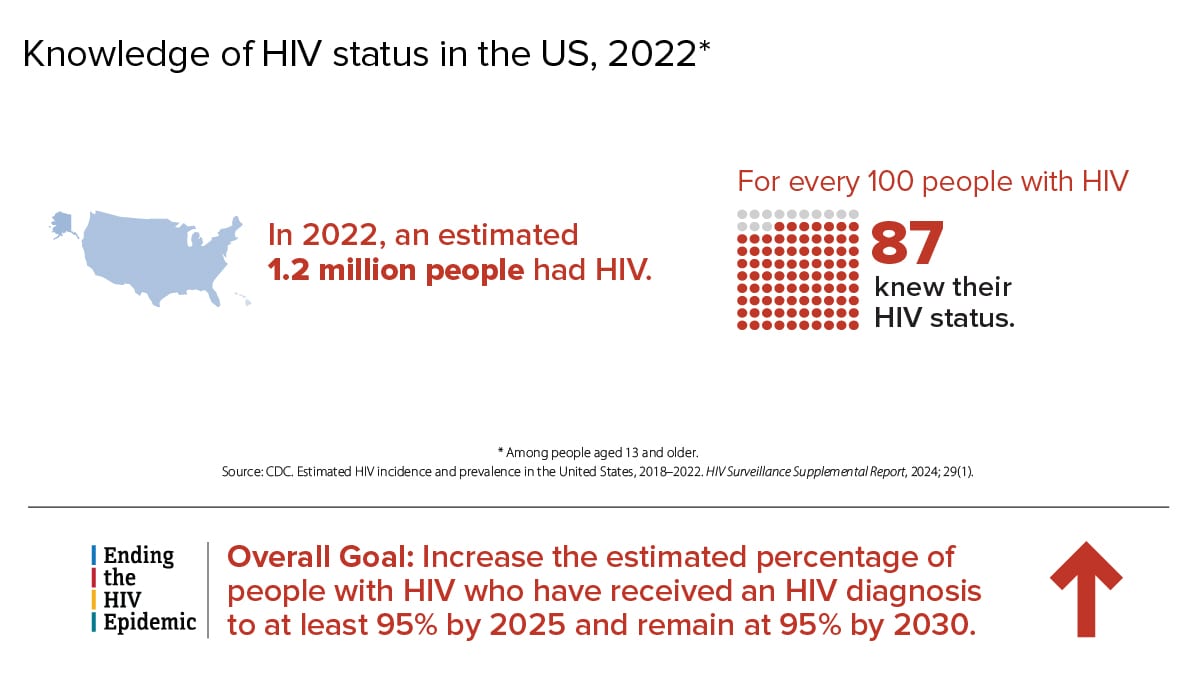
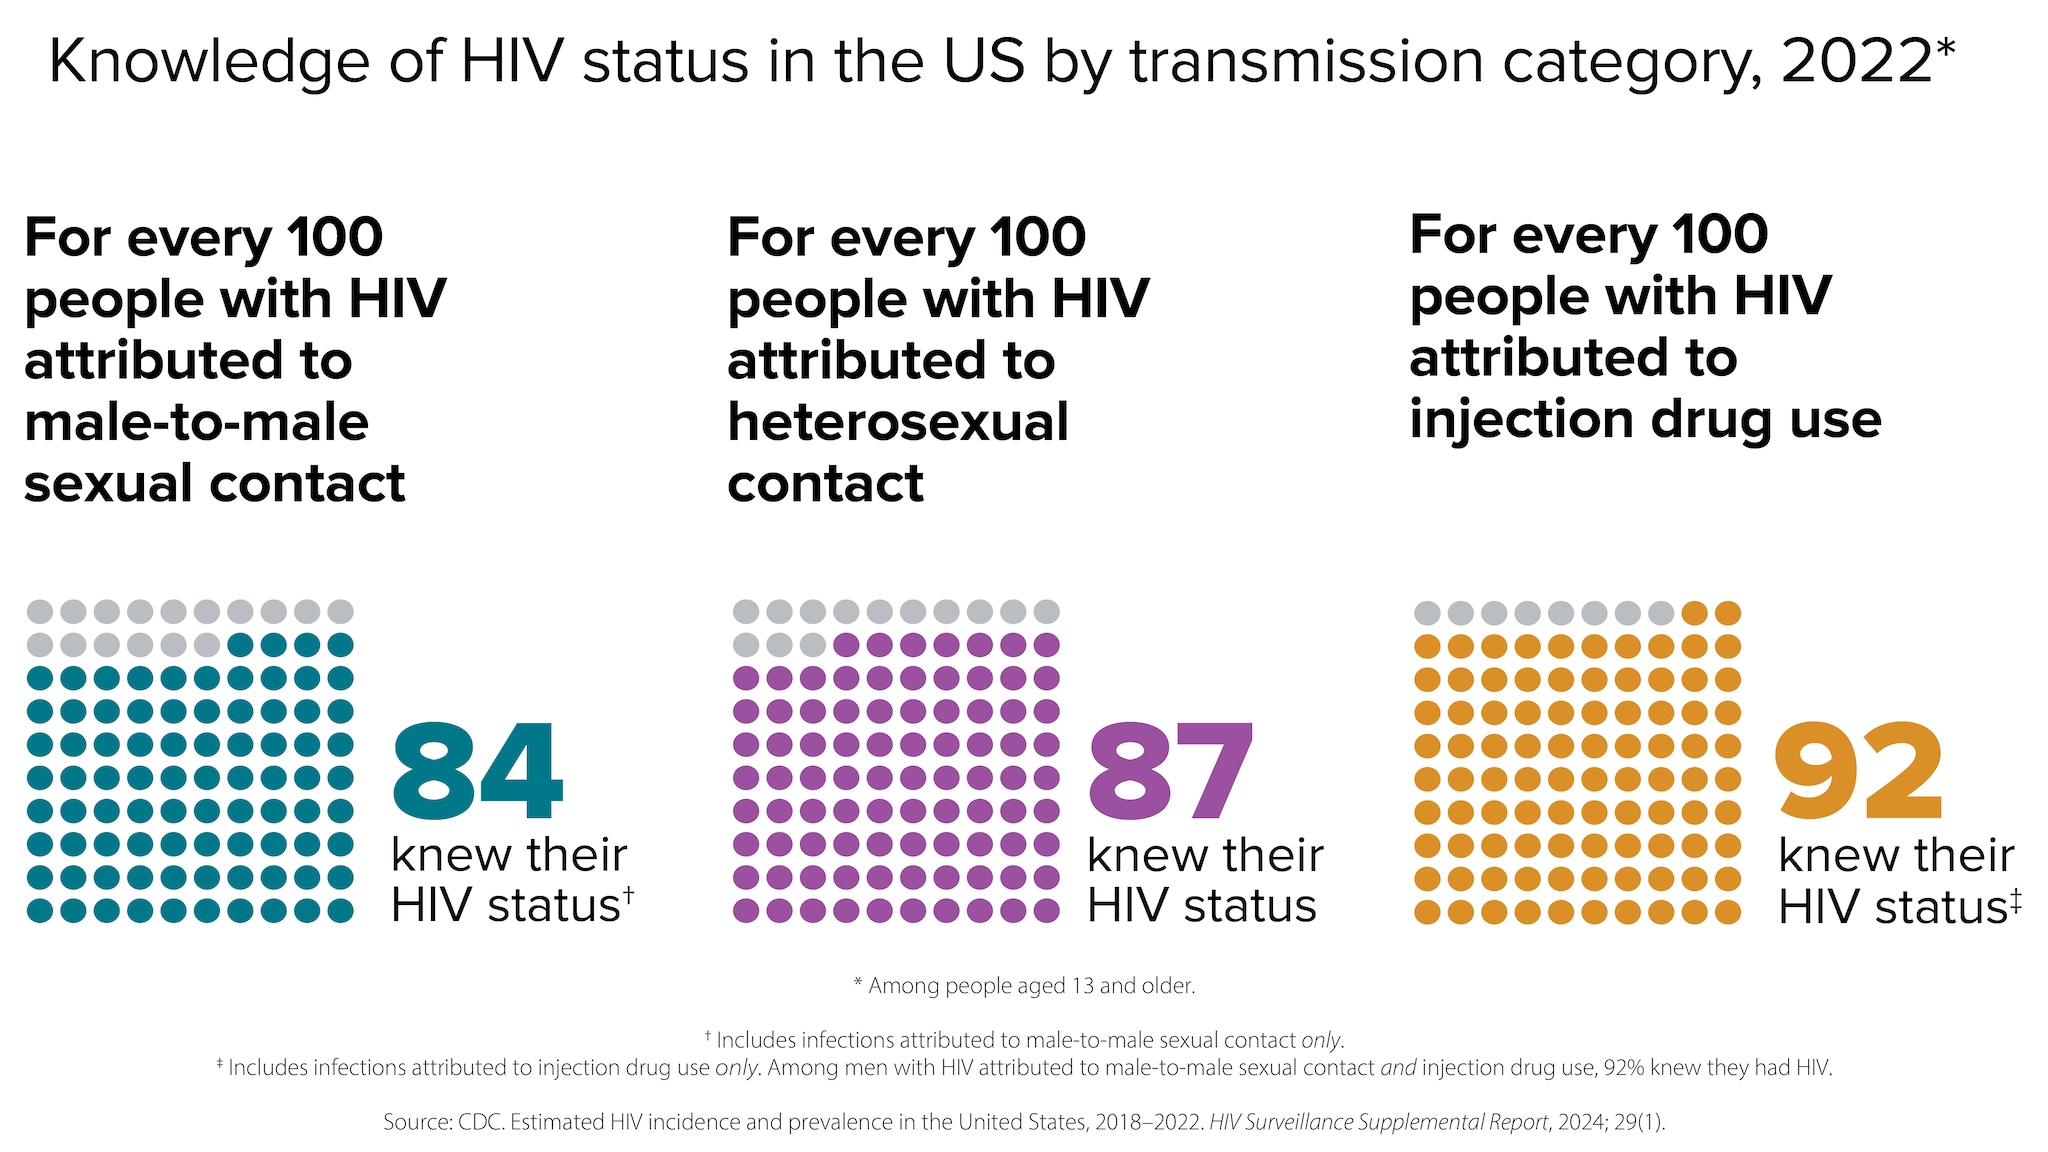
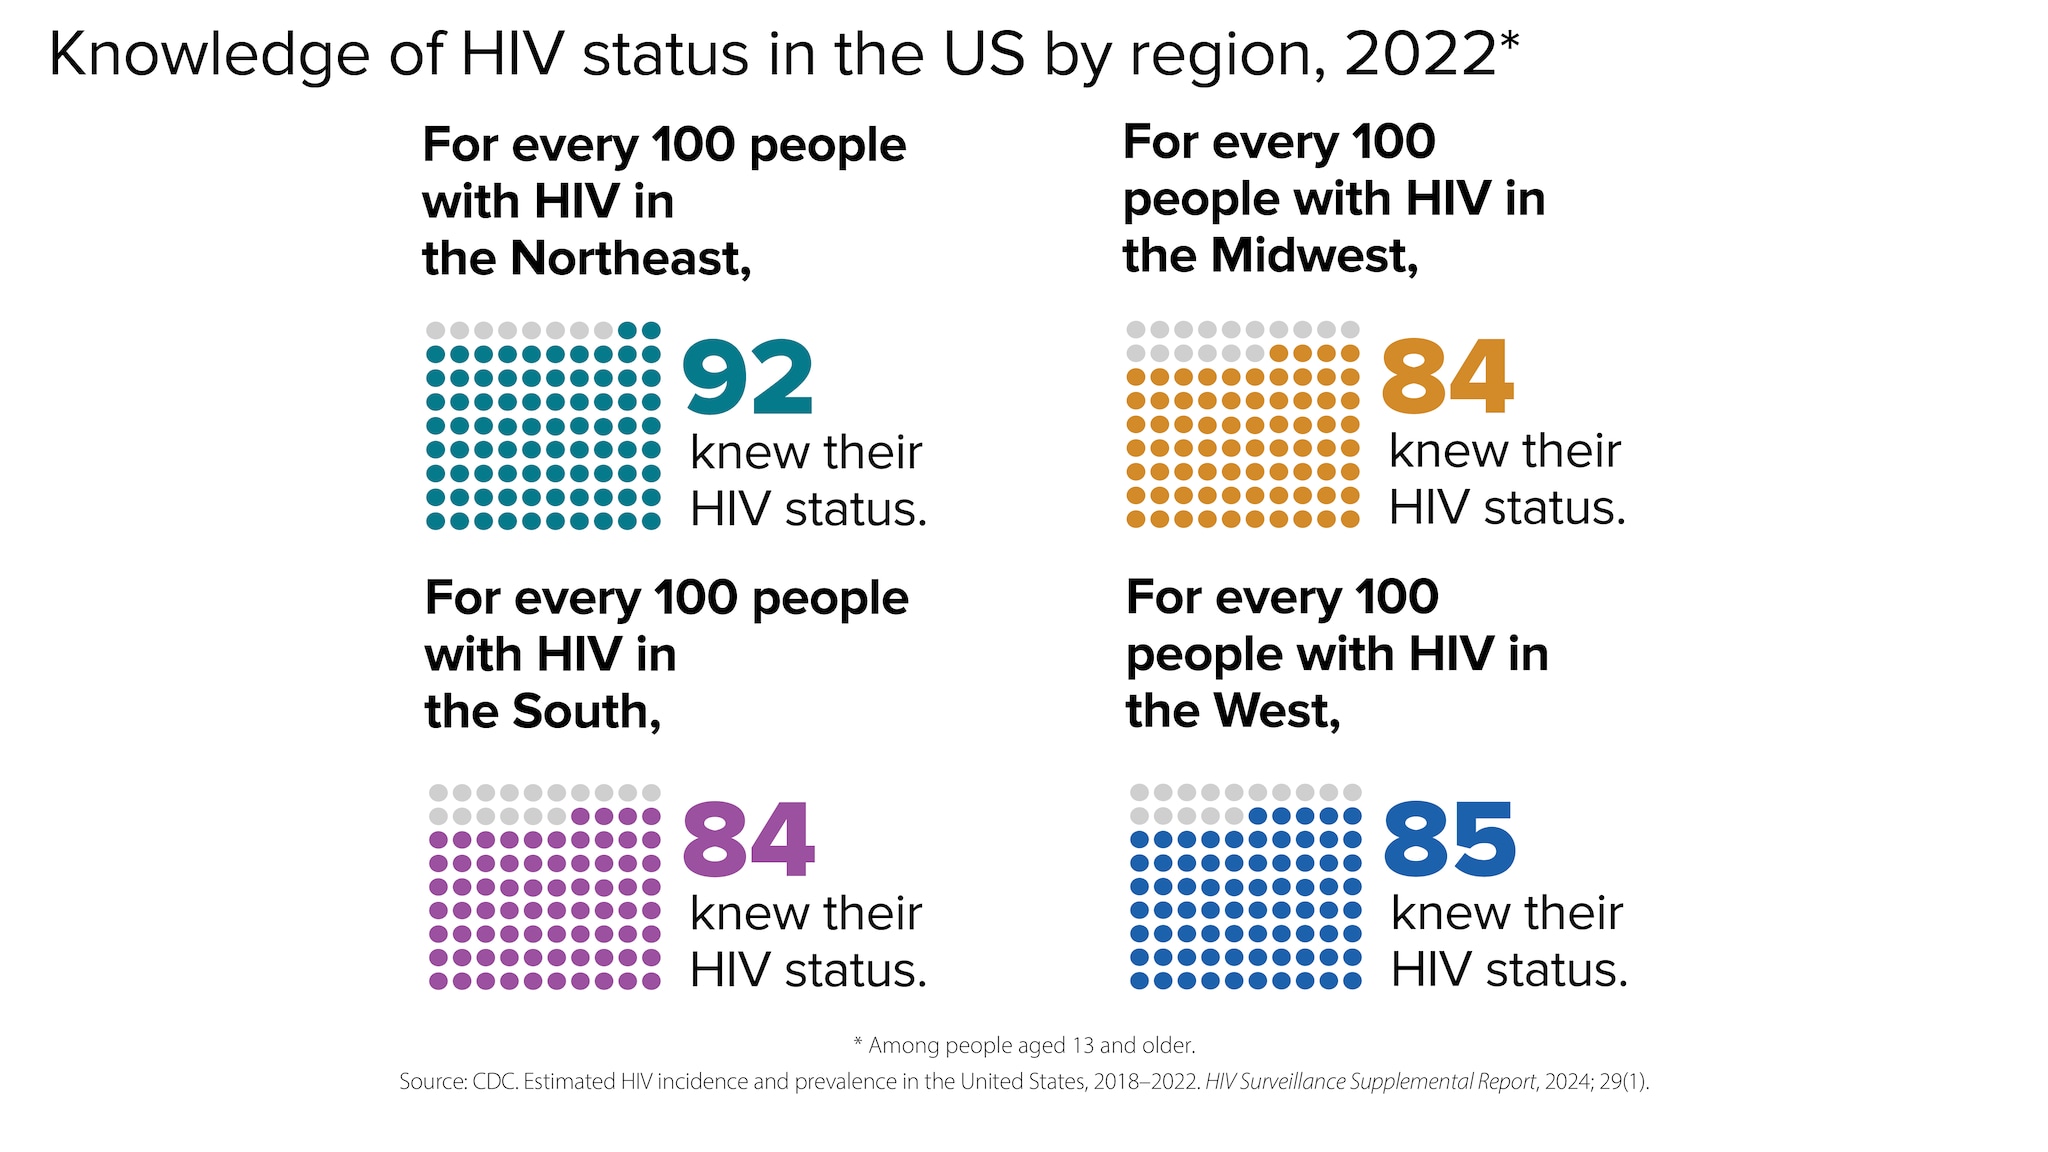
Knowledge of status refers to the estimated percentage of people with HIV who have received an HIV diagnosis.
PrEP coverage
CDC has paused PrEP (pre-exposure prophylaxis) coverage reporting to determine the best methodology for calculating PrEP coverage, and to update PrEP coverage estimates using updated methods and sources. CDC plans to resume PrEP coverage reporting in the next HIV Monitoring Report for all demographic groups, currently scheduled for publication in June 2025. Until updated PrEP coverage estimates are published, CDC advises against citing specific PrEP coverage data points, as historical estimates will be updated.
Viral suppression and barriers to care
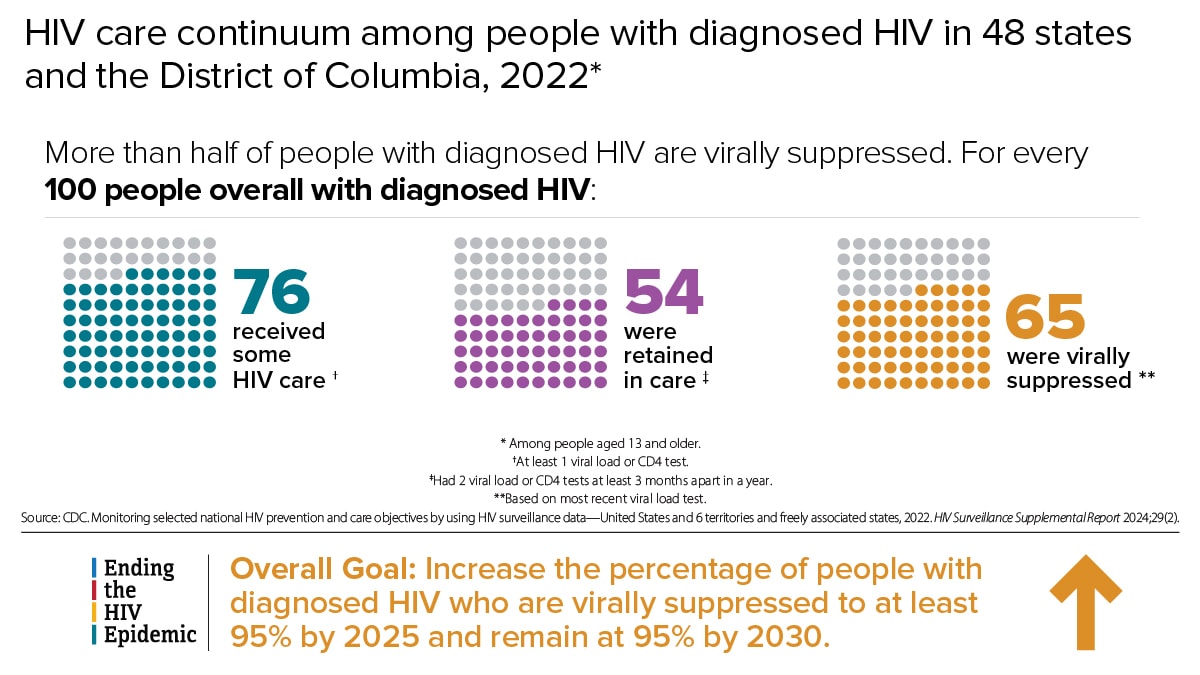
Viral suppression refers to the percentage of people with diagnosed HIV who have less than 200 copies of HIV per milliliter of blood.
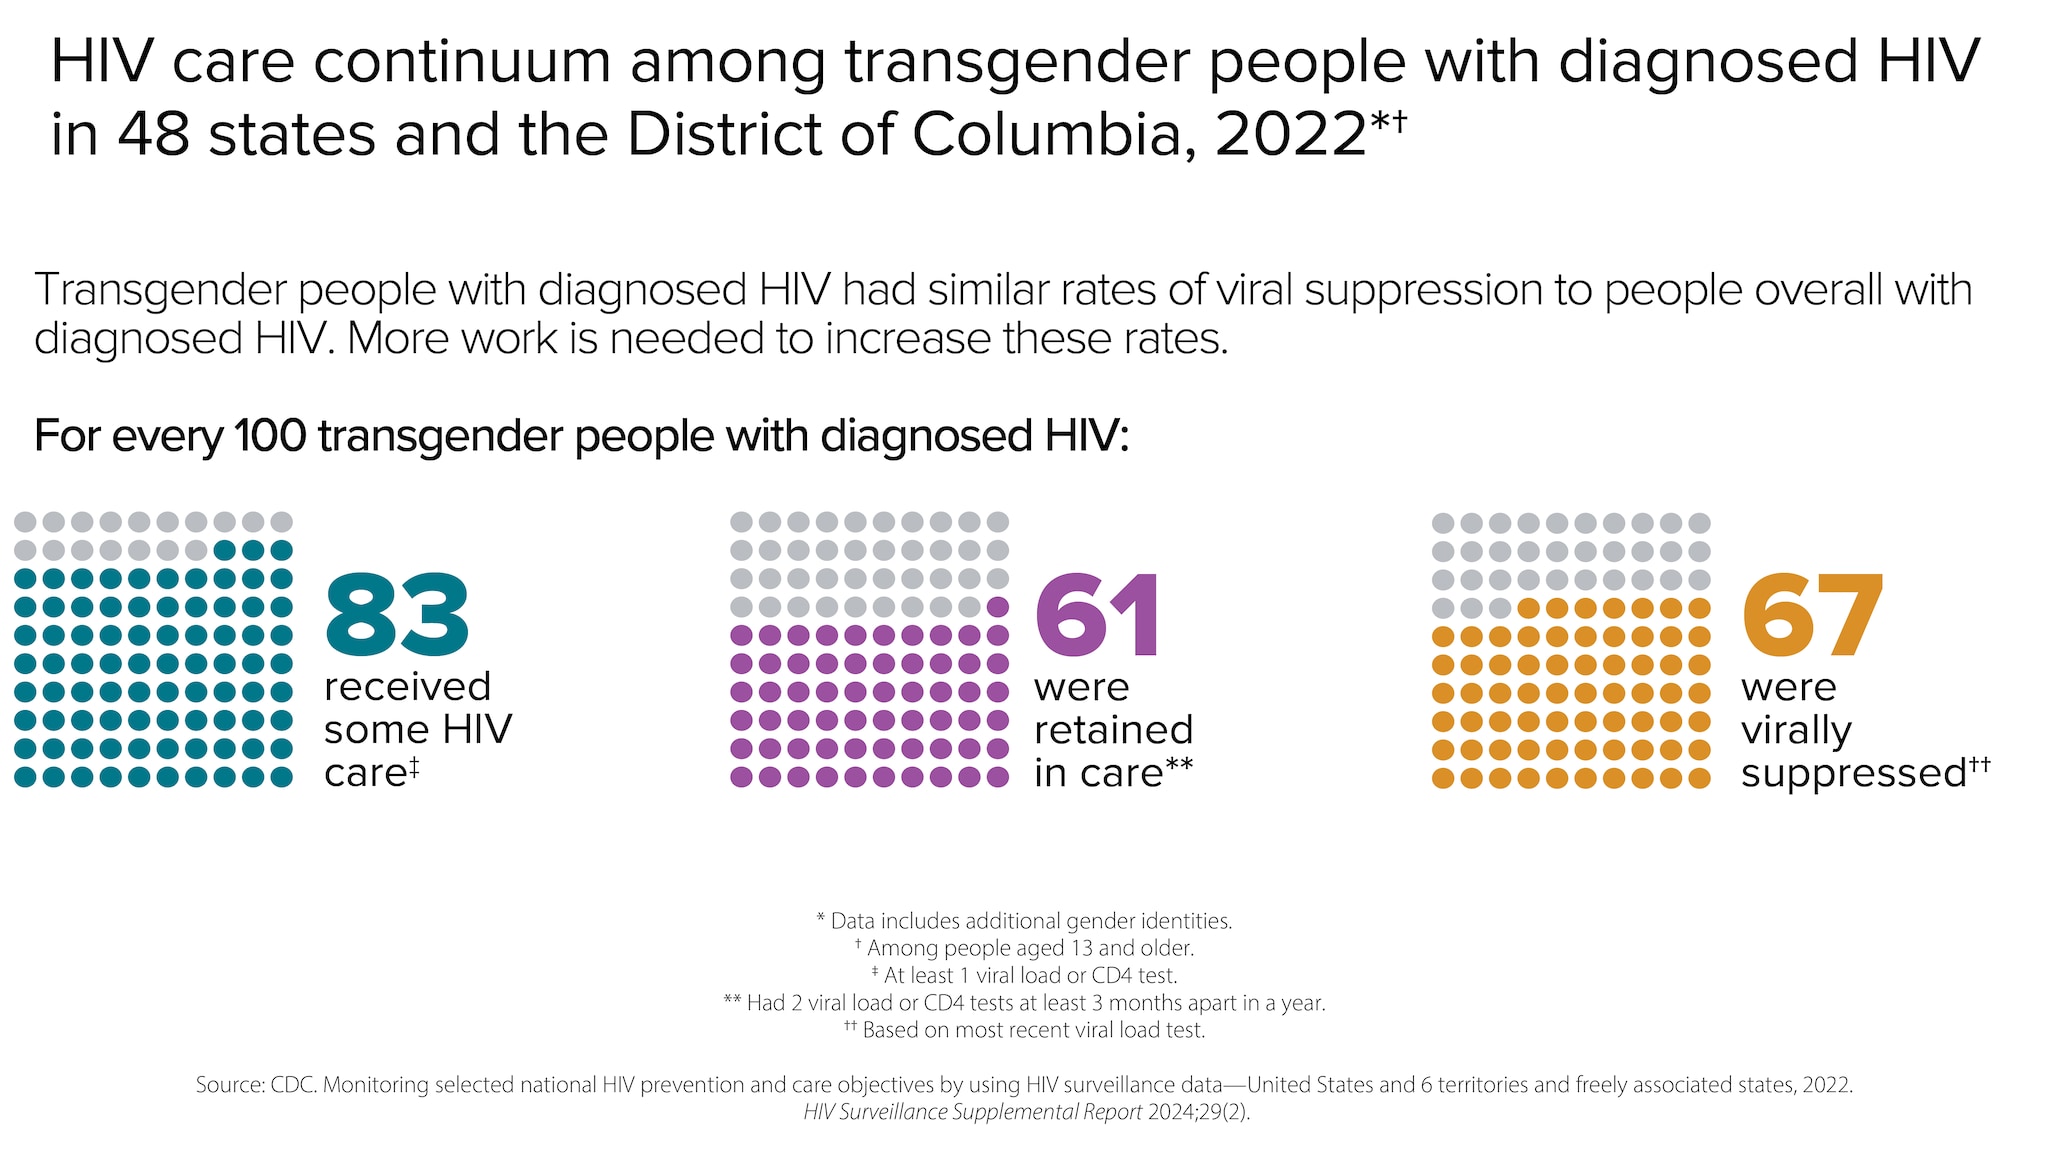
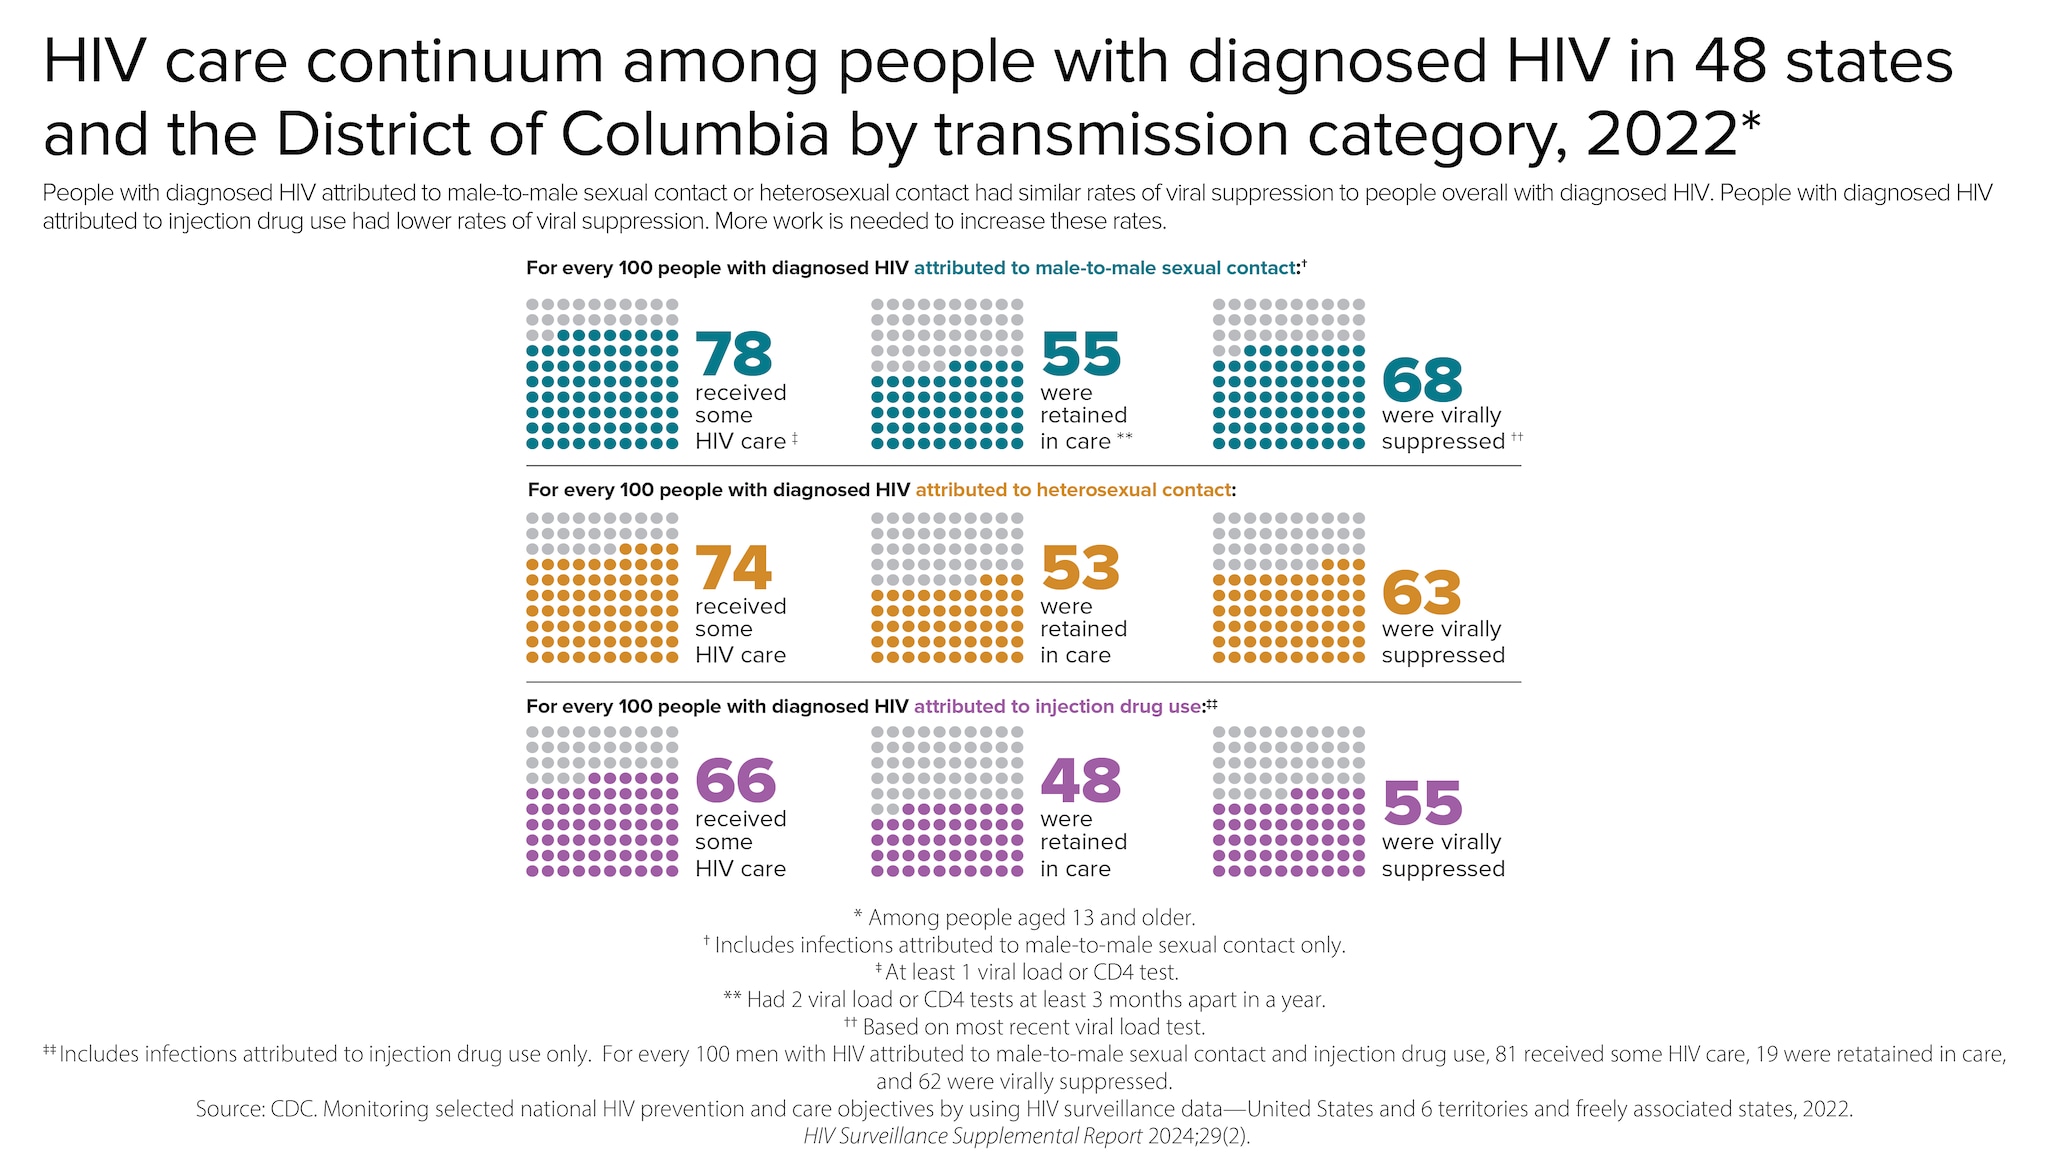
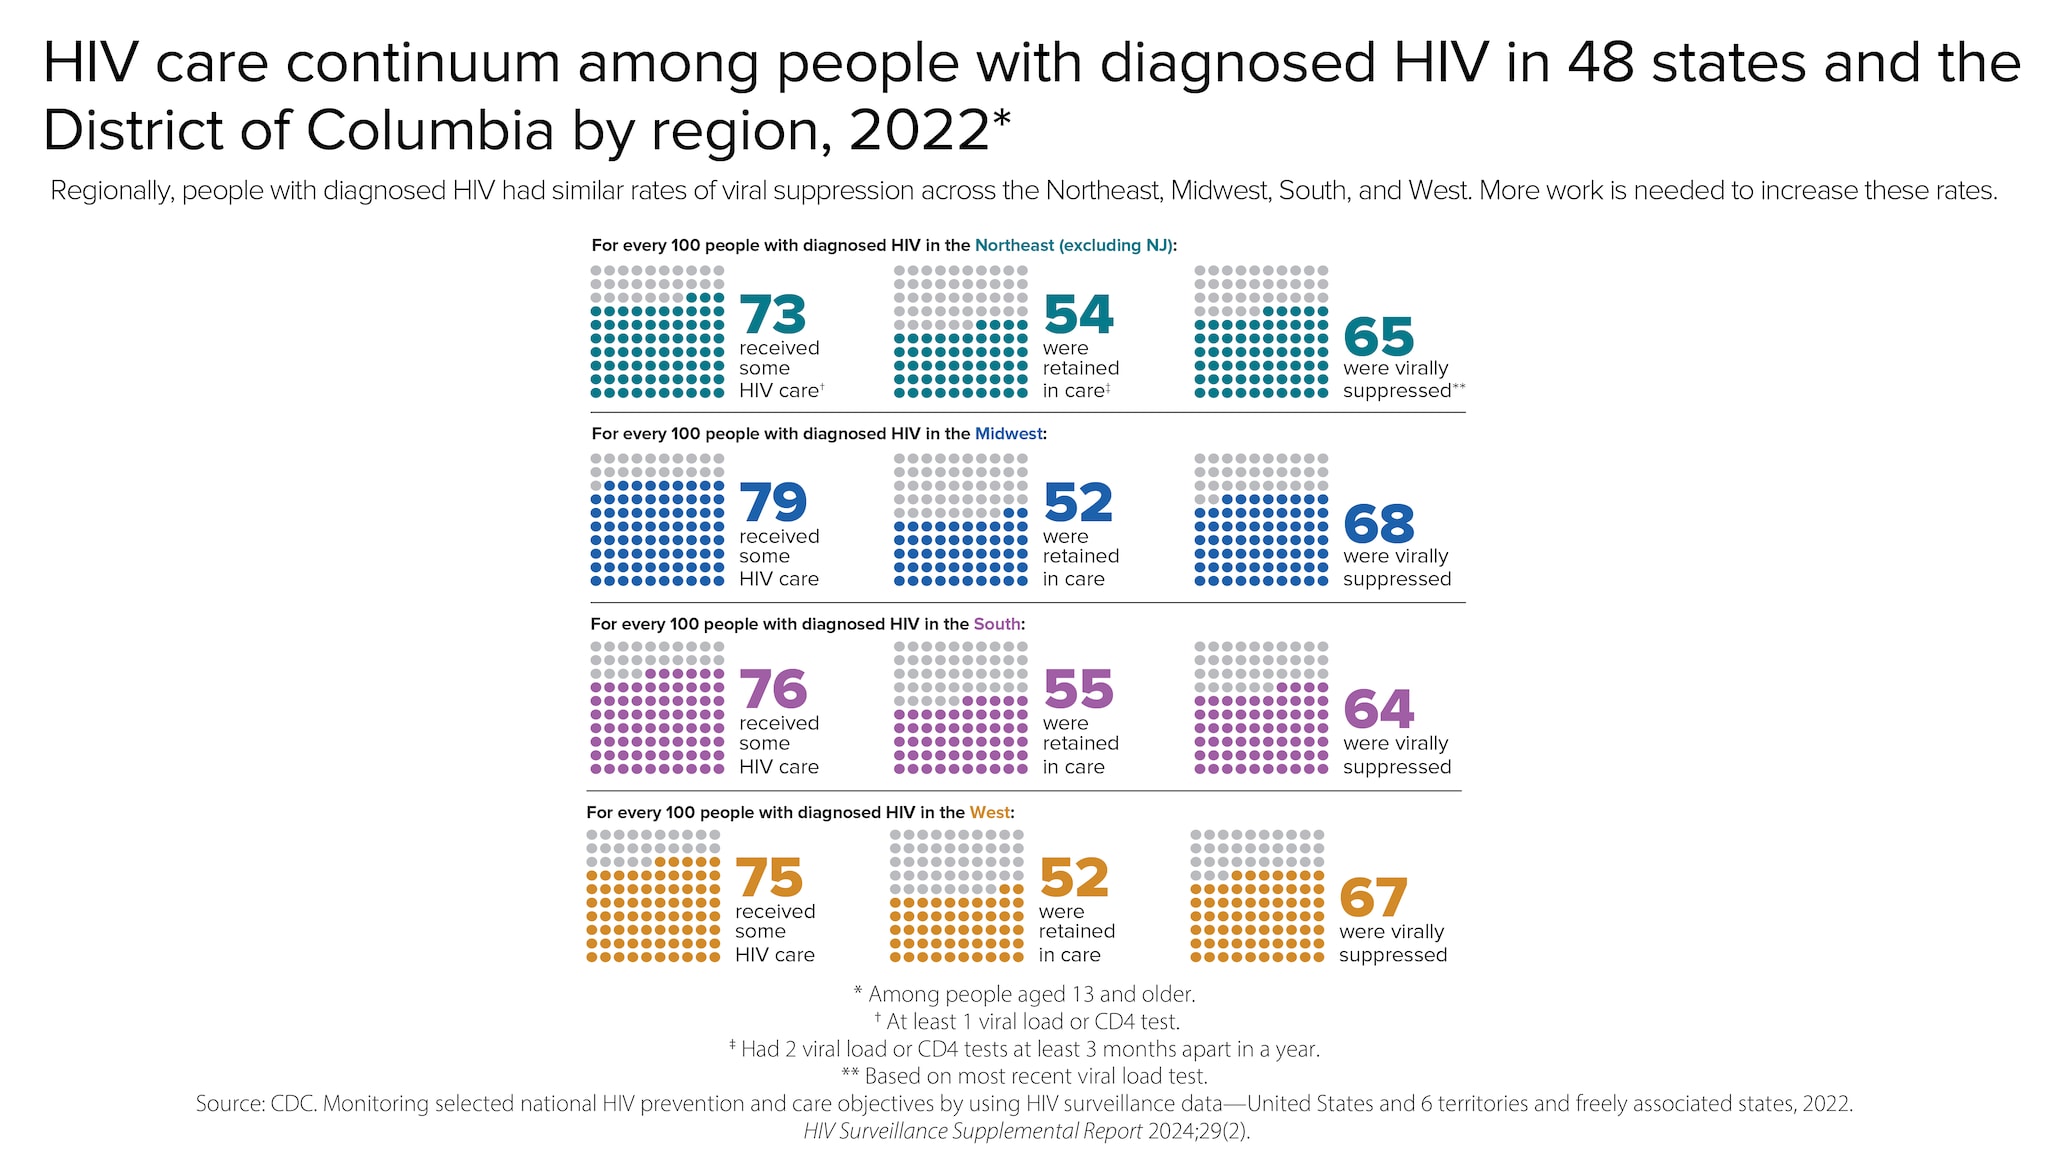
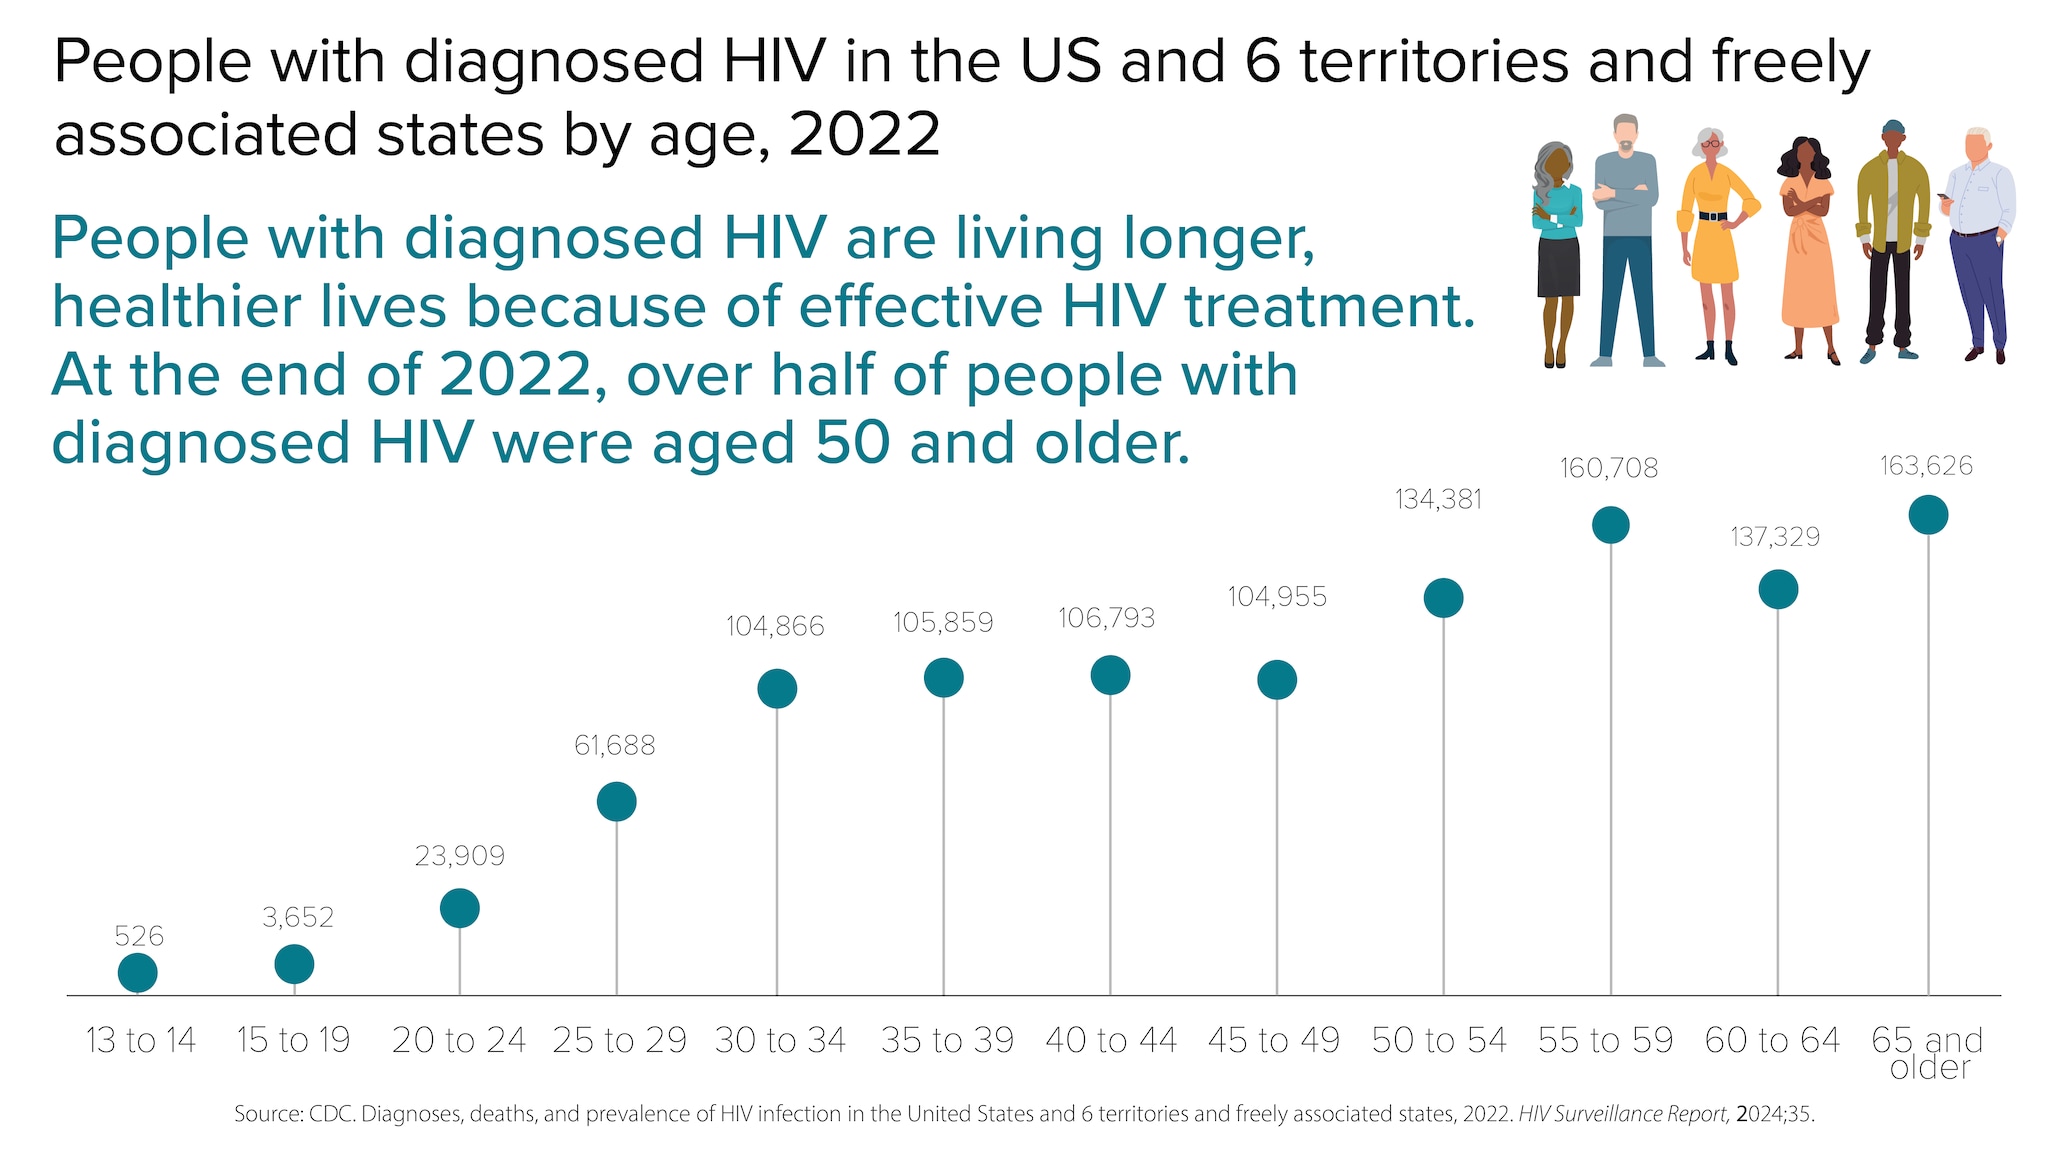
Most HIV cases occur in metropolitan areas with 500,000 or more people. The South has the highest number of people with HIV, but if population size is taken into account, the Northeast has the highest rate of people with HIV.
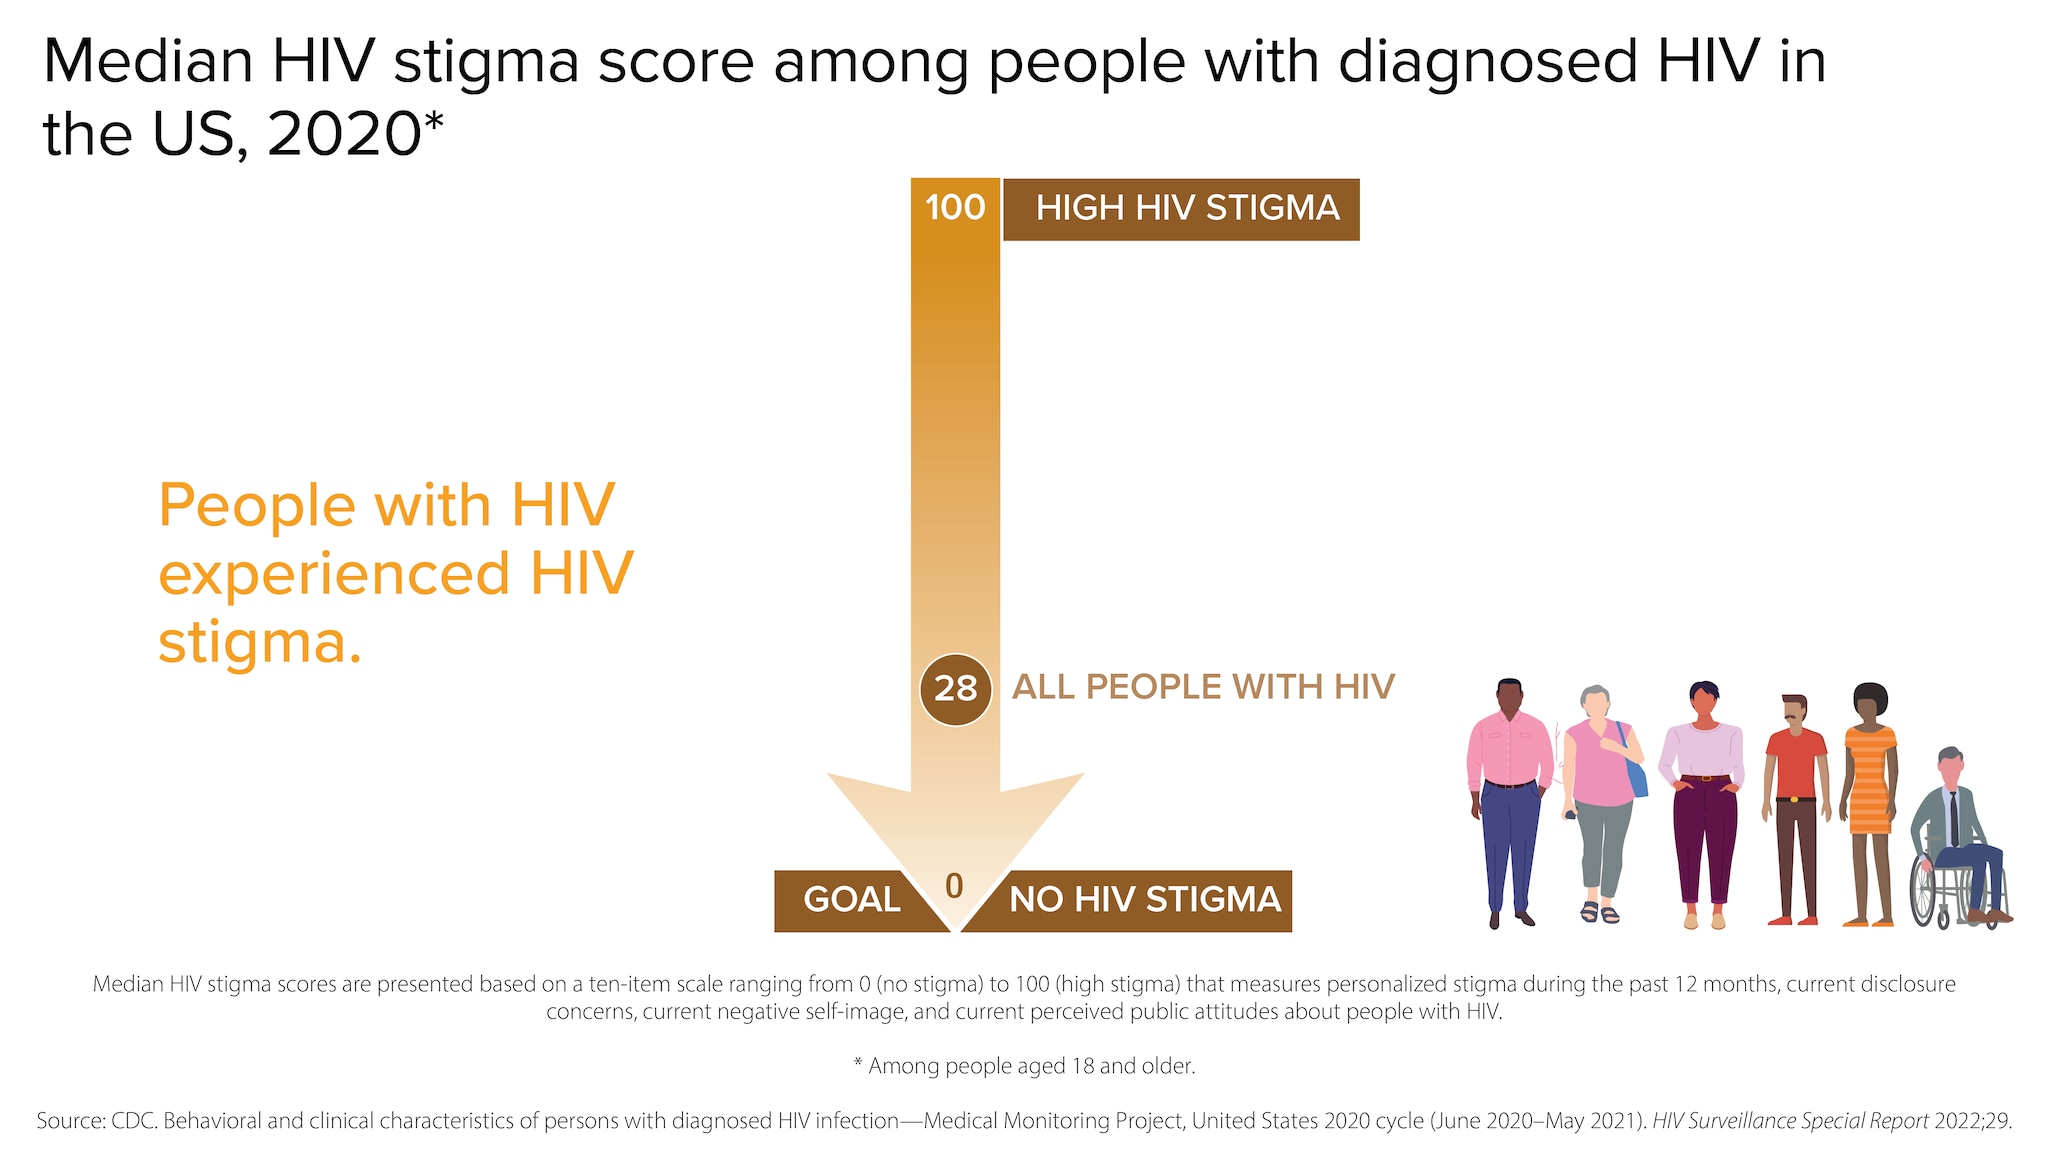
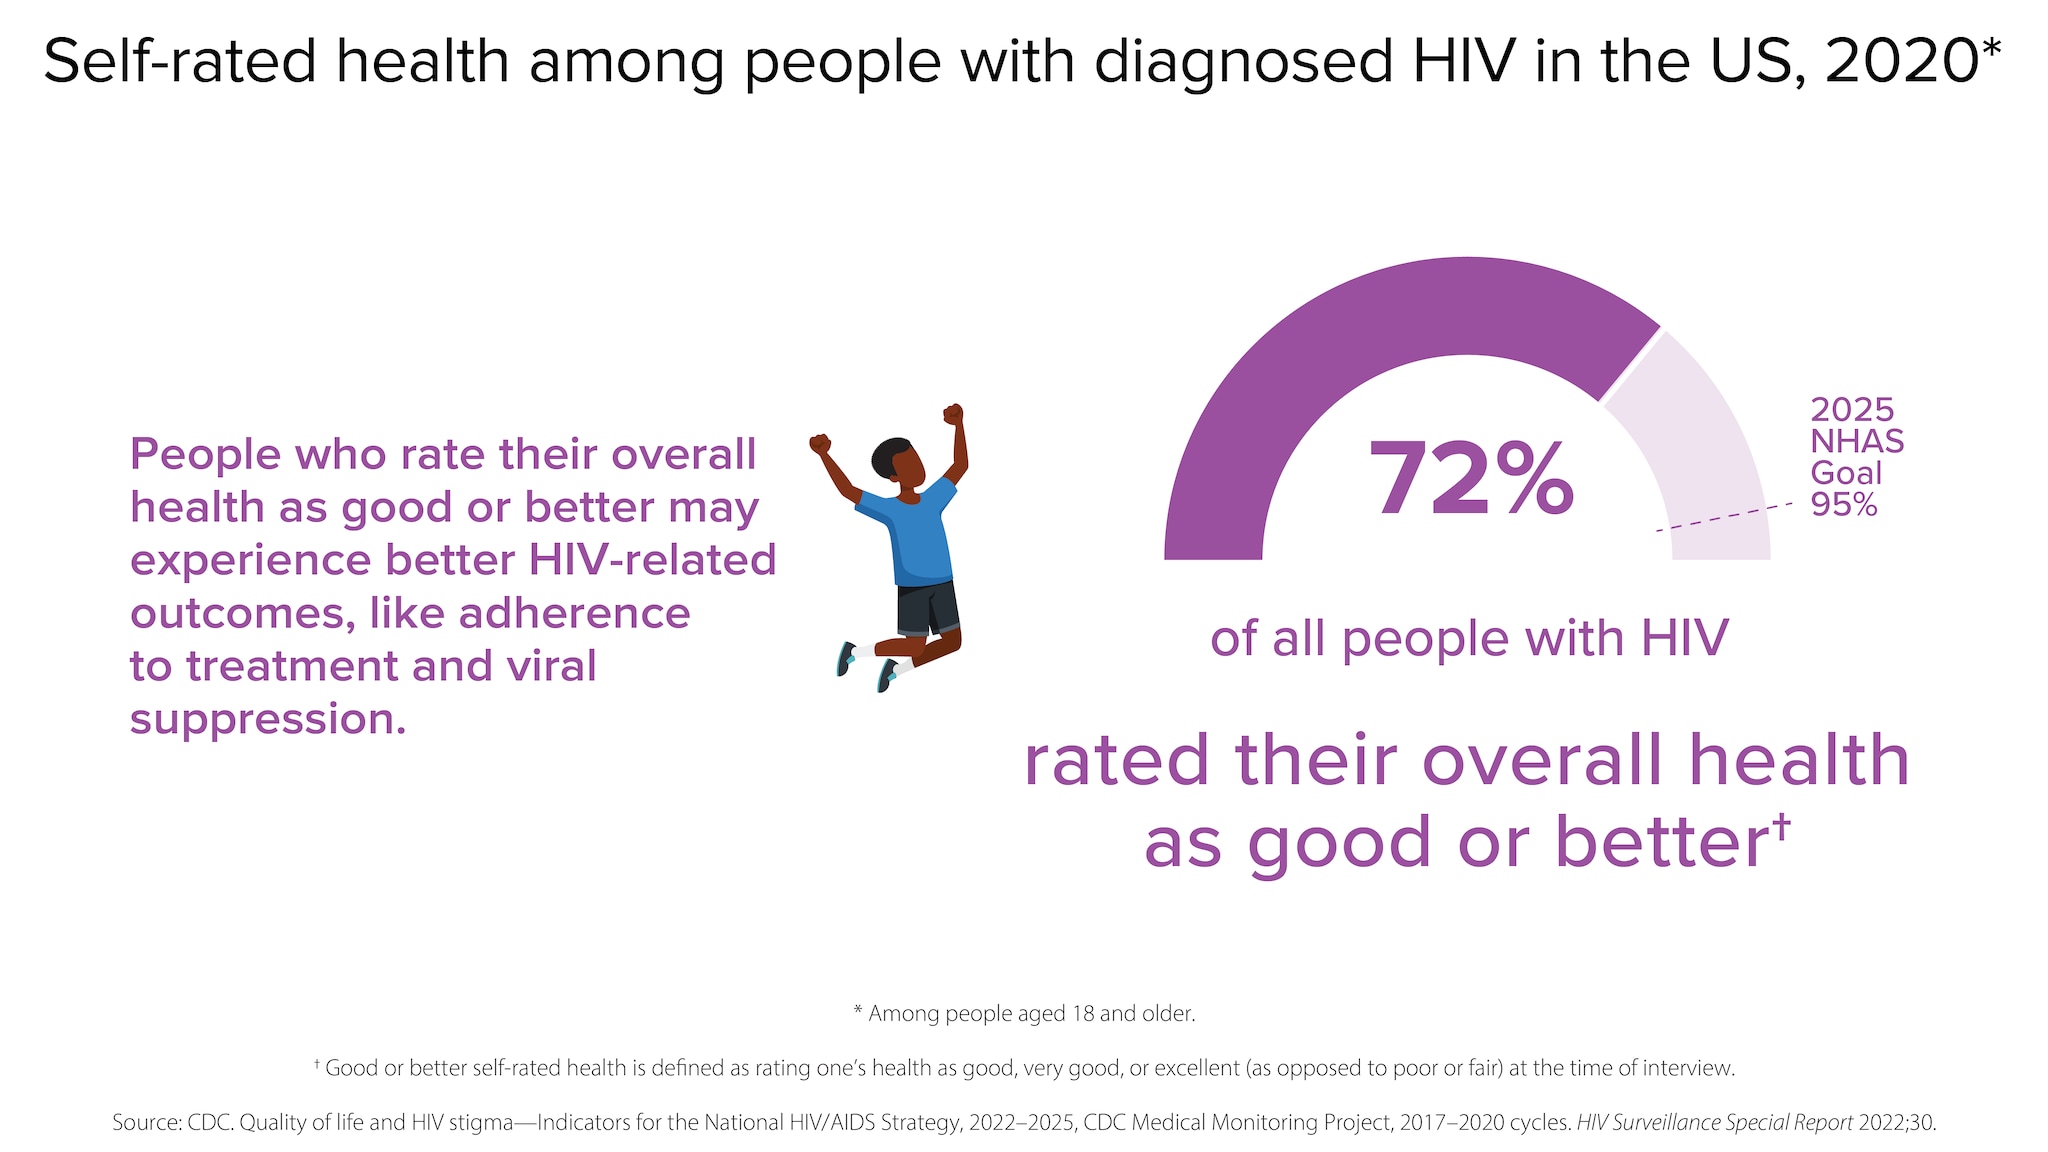
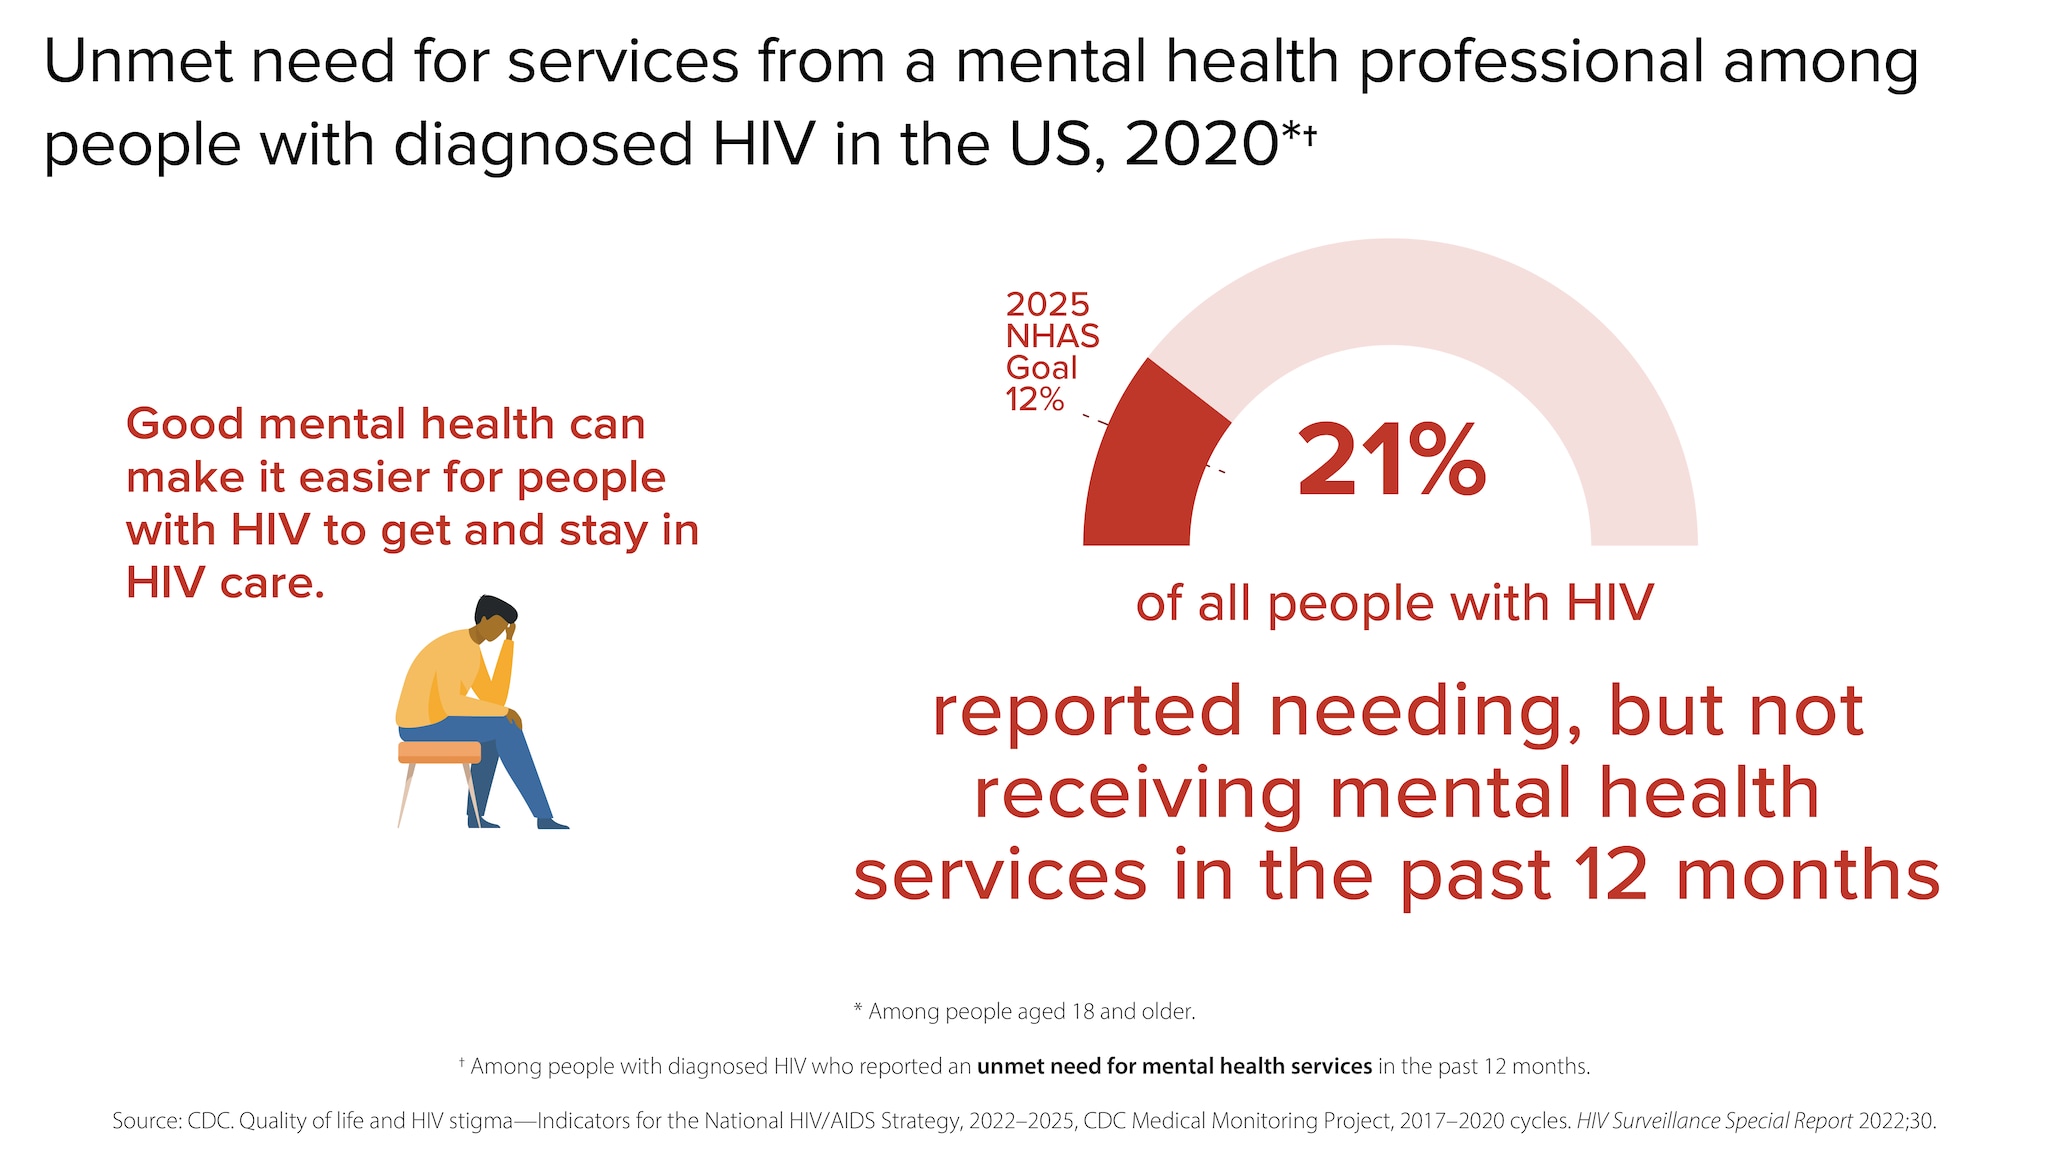
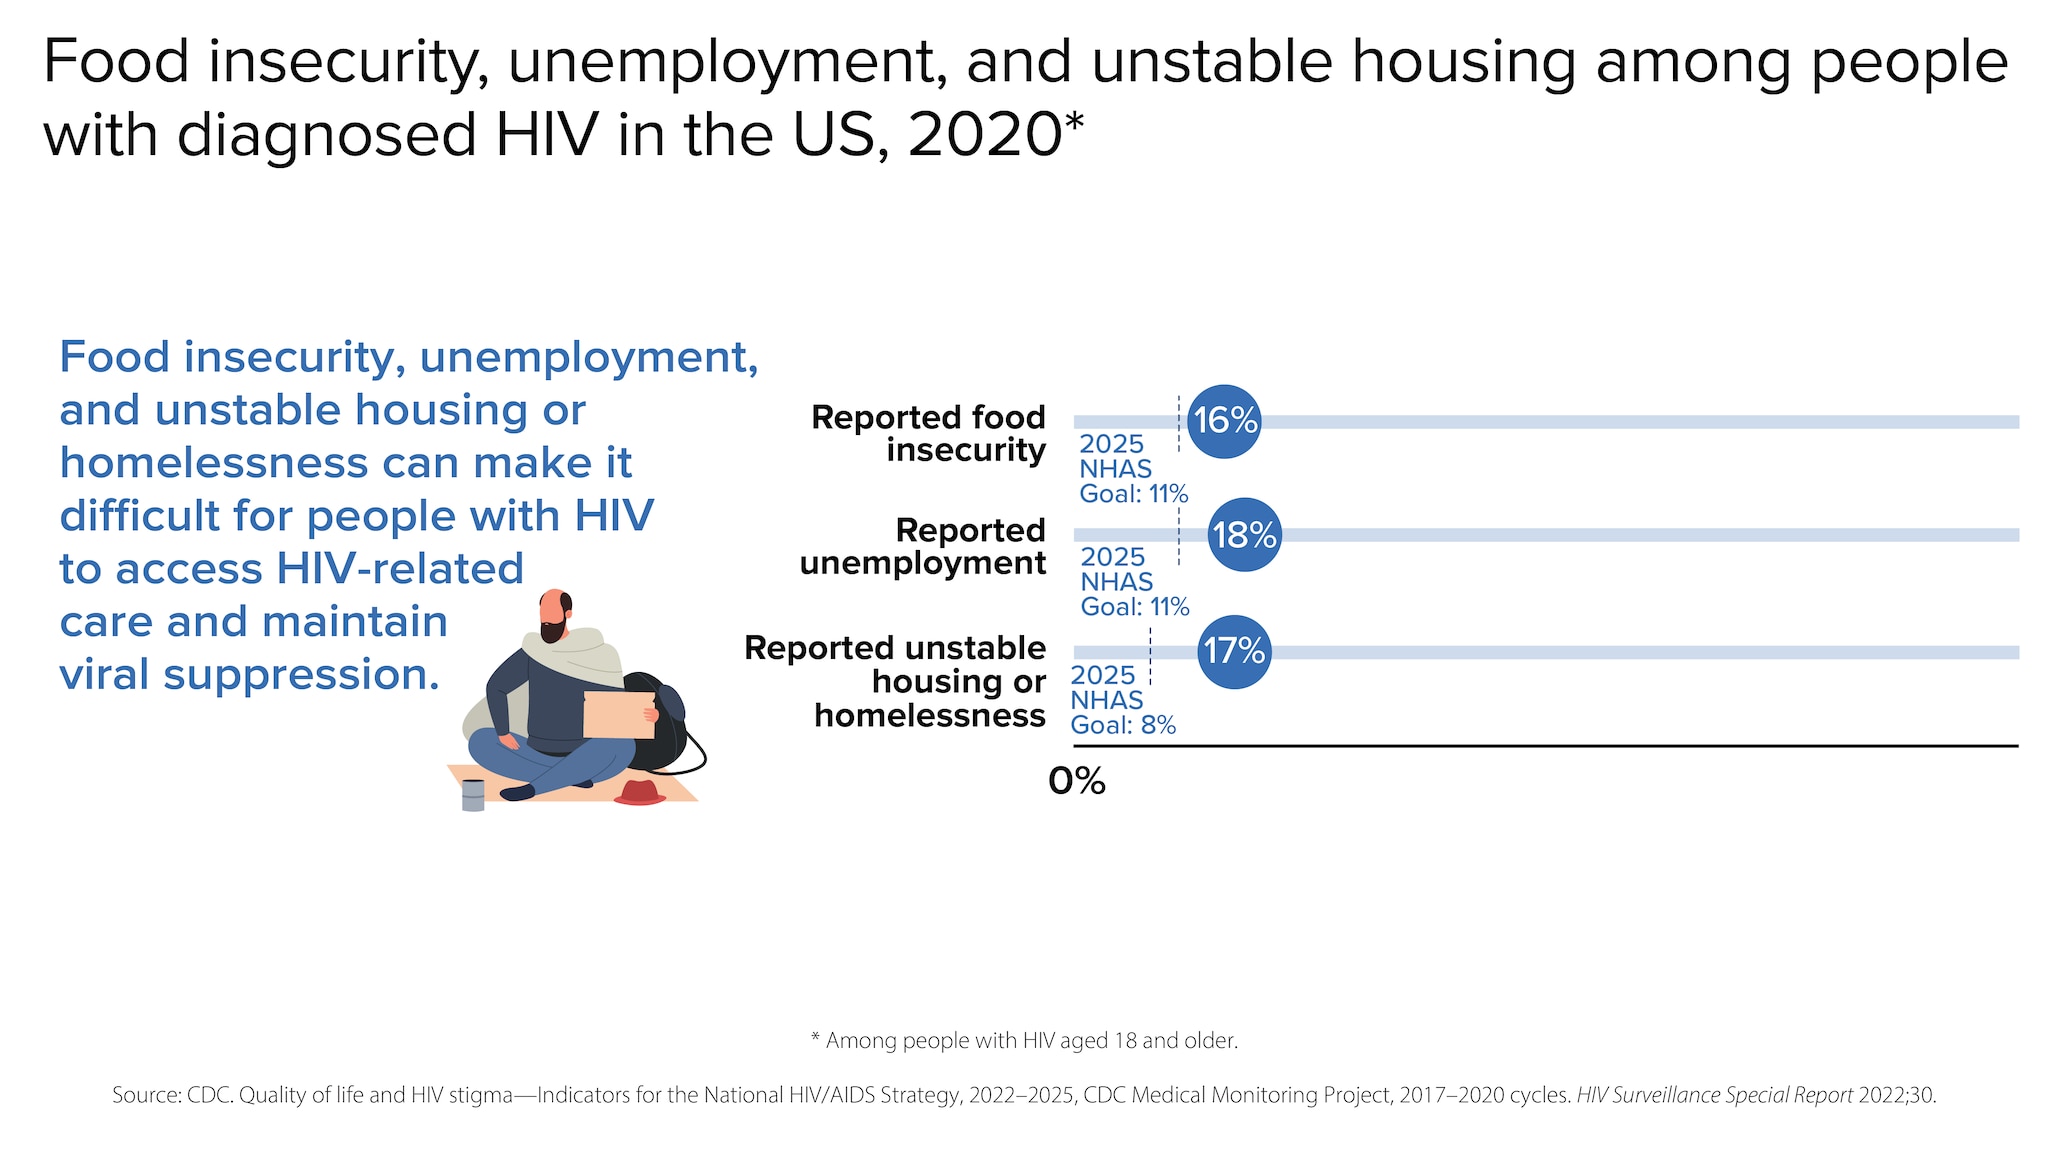
Although many people taking HIV medicine are virally suppressed, some people with HIV are currently not virally suppressed or do not maintain viral suppression over time. Some challenges with achieving and maintaining viral suppression include HIV stigma, physical health, mental health, and structural issues—such as food insecurity, unemployment, and unstable housing or homelessness.
- CDC. Estimated HIV incidence and prevalence in the United States, 2018–2022.HIV Surveillance Supplemental Report, 2024; 29(1).
- CDC. Diagnoses, deaths, and prevalence of HIV in the United States and 6 territories and freely associated states, 2022.HIV Surveillance Report, 2024;35.
- CDC. Behavioral and clinical characteristics of persons with diagnosed HIV infection—Medical Monitoring Project, United States 2020 cycle (June 2020–May 2021). HIV Surveillance Special Report, 2022;29.
- CDC. HIV infection risk, prevention, and testing behaviors among persons who inject drugs—National HIV Behavioral Surveillance: injection drug use, 23 U.S. Cities, 2018. HIV Surveillance Special Report, 2020;24.
- CDC. Monitoring selected national HIV prevention and care objectives by using HIV surveillance data—United States and 6 territories and freely associated states, 2022.HIV Surveillance Supplemental Report, 2024;29(2).
- CDC. Quality of life and HIV stigma—Indicators for the National HIV/AIDS Strategy, 2022–2025, CDC Medical Monitoring Project, 2017–2020 cycles. HIV Surveillance Special Report, 2022;30.
