At a glance
Gay, bisexual, and other men who reported male-to-male sexual contact are disproportionately affected by HIV. Social and structural issues—such as HIV stigma, homophobia, discrimination, poverty, and limited access to high-quality health care—influence health outcomes and continue to drive inequities. Addressing these barriers and encouraging safe and supportive communities can help improve health outcomes for gay and bisexual men.

Fast facts
HIV incidence
HIV incidence refers to the estimated number of new HIV infections in a given year.
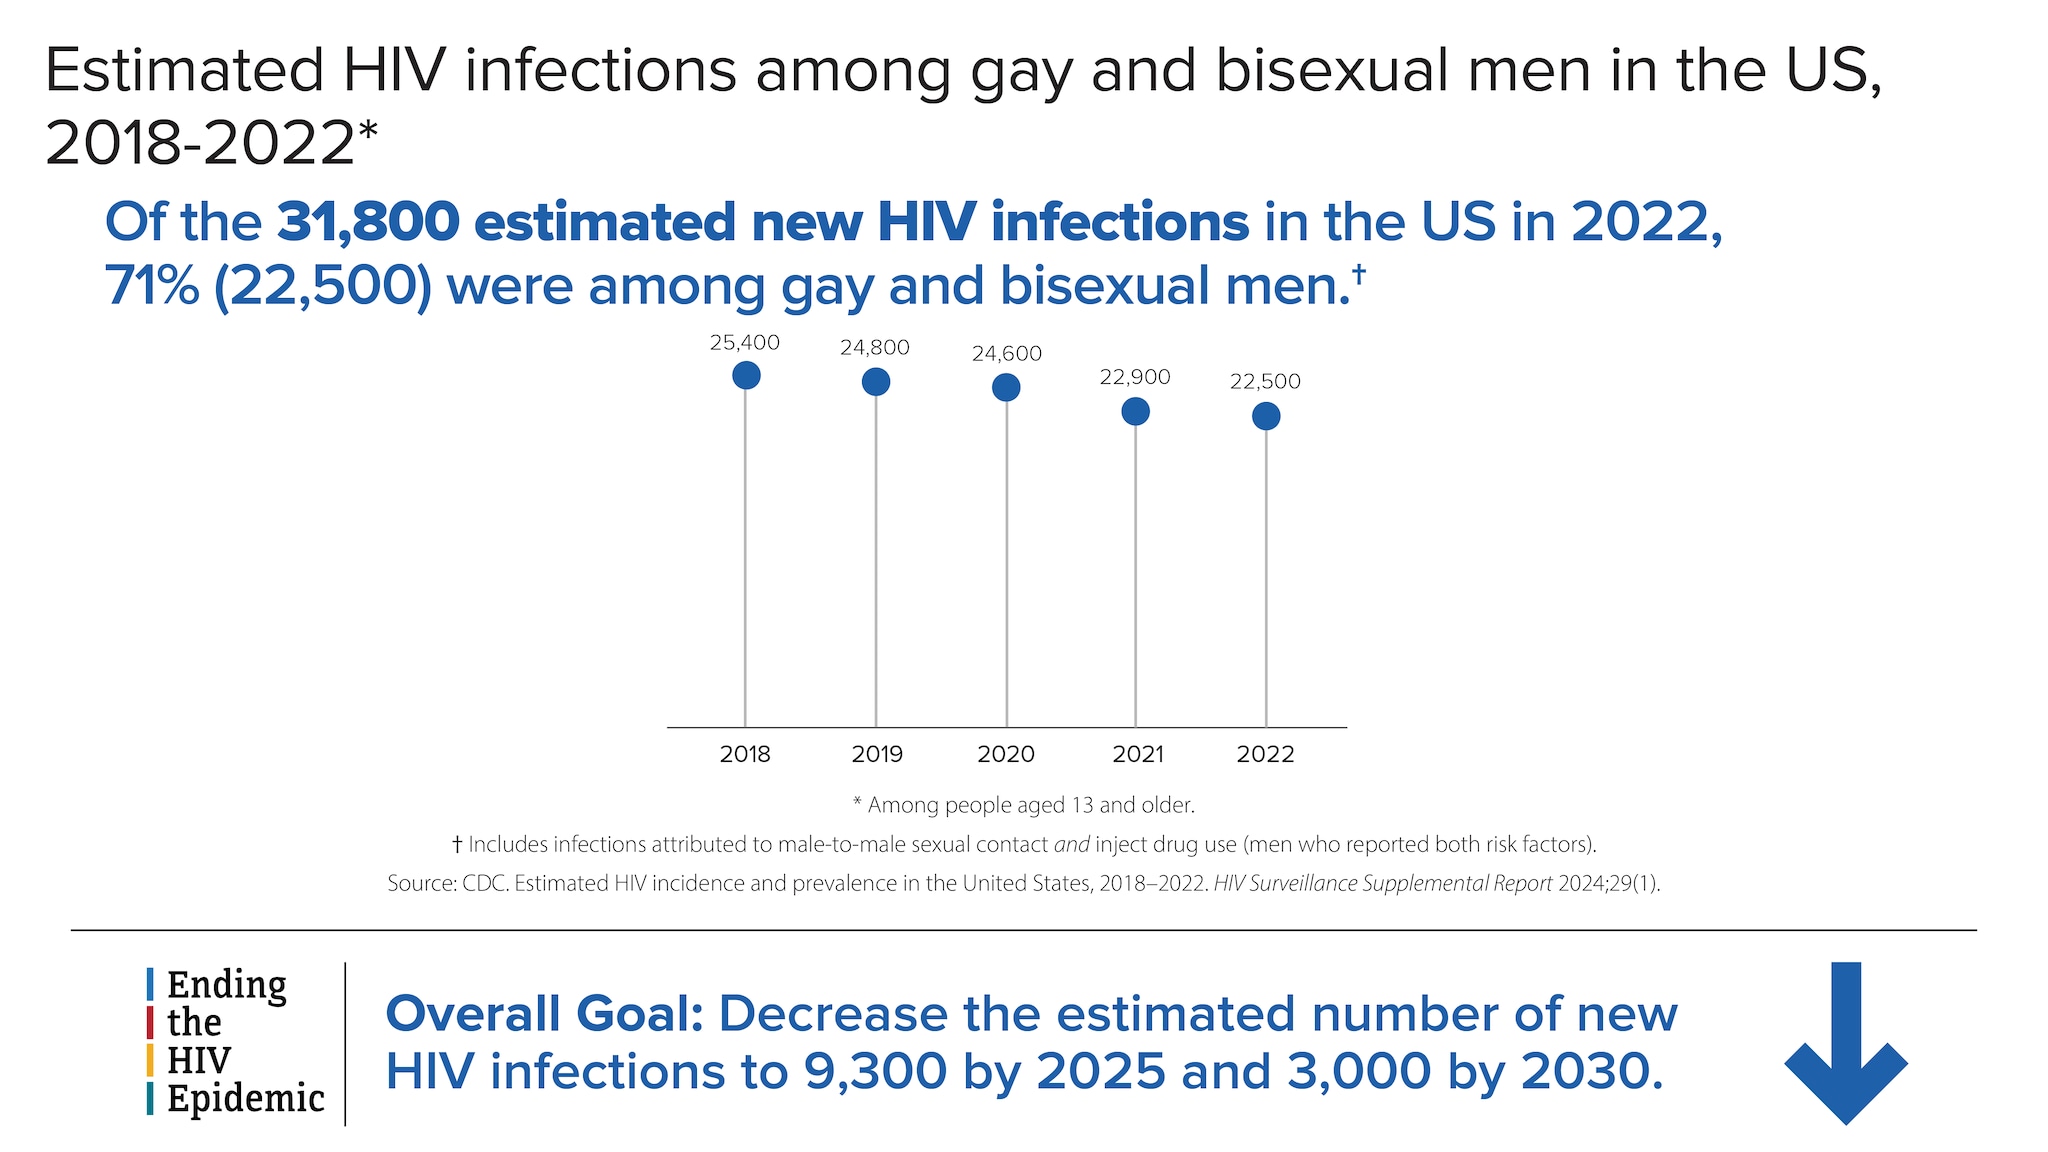
Estimated HIV infections among gay and bisexual men in the US, 2018-2022*
Of the 31,800 estimated new HIV infections in the US in 2022, 71% (22,500) were among gay and bisexual men.†
2018 - 25,400
2029- 24,800
2020 - 24,600
2021 - 22,900
2022 - 22,500
† Includes infections attributed to male-to-male sexual contact and inject drug use (men who reported both risk factors).
Source: CDC. Estimated HIV incidence and prevalence in the United States, 2018-2022. HIV Surveillance Supplemental Report 2024:29(1).
Ending the HIV Epidemic Overall Goal: Decrease the estimated number of new HIV infections to 9,300 by 2025 and 3,000 by 2030.
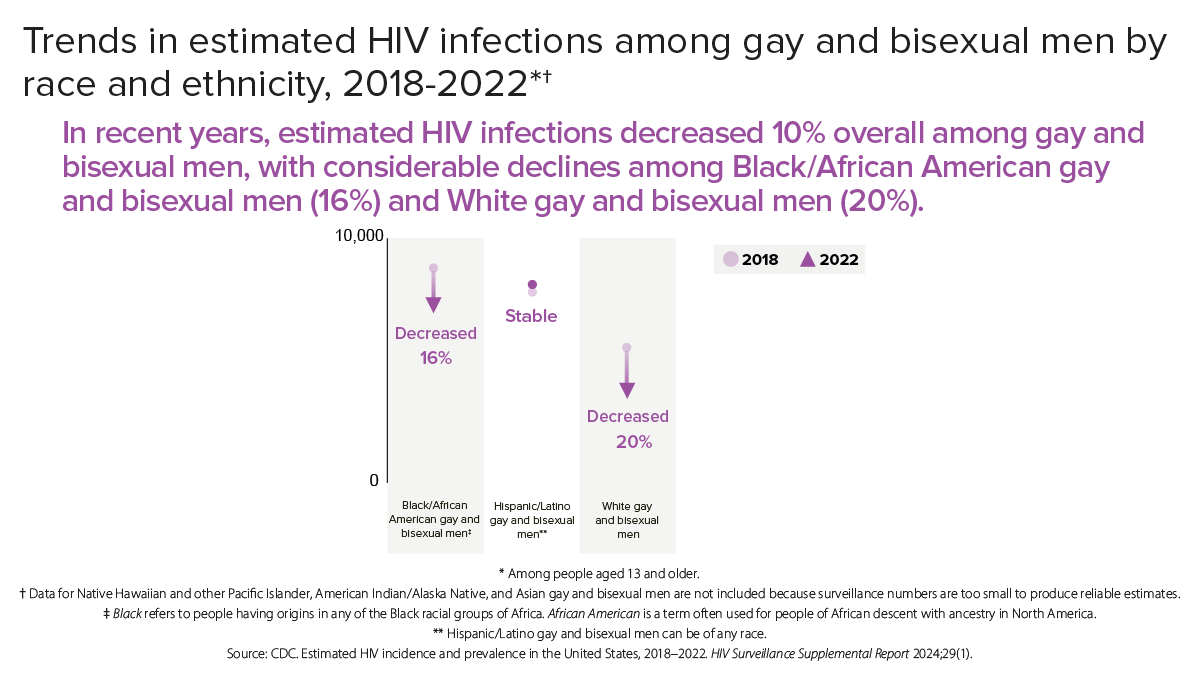
In recent years, estimated HIV infections decreased 10% overall among gay and bisexual men, with considerable declines among Black/African American gay and bisexual men (16%) and White gay and bisexual men (20%).
- Black/African American gay and bisexual men† - Decreased 16%
- Hispanic/Latino gay and bisexual men** - Stable
- White gay and bisexual men - Decreased 20%
Among people aged 13 and older.† Data for Native Hawaiian and other Pacific Islander, American Indian/Alaska Native, and Asian gay and bisexual men are not included because surveillance numbers are too small to produce reliable estimates.‡ Black refers to people having origins in any of the Black racial groups of Africa. African American is a term often used for people of African descent with ancestry in North America.** Hispanic/Latino gay and bisexual men can be of any race.
Source: CDC. Estimated HIV incidence and prevalence in the United States, 2018–2022. HIV Surveillance Supplemental Report 2024;29(1).
HIV diagnoses
HIV diagnoses refers to the number of people who received an HIV diagnosis during a given year.
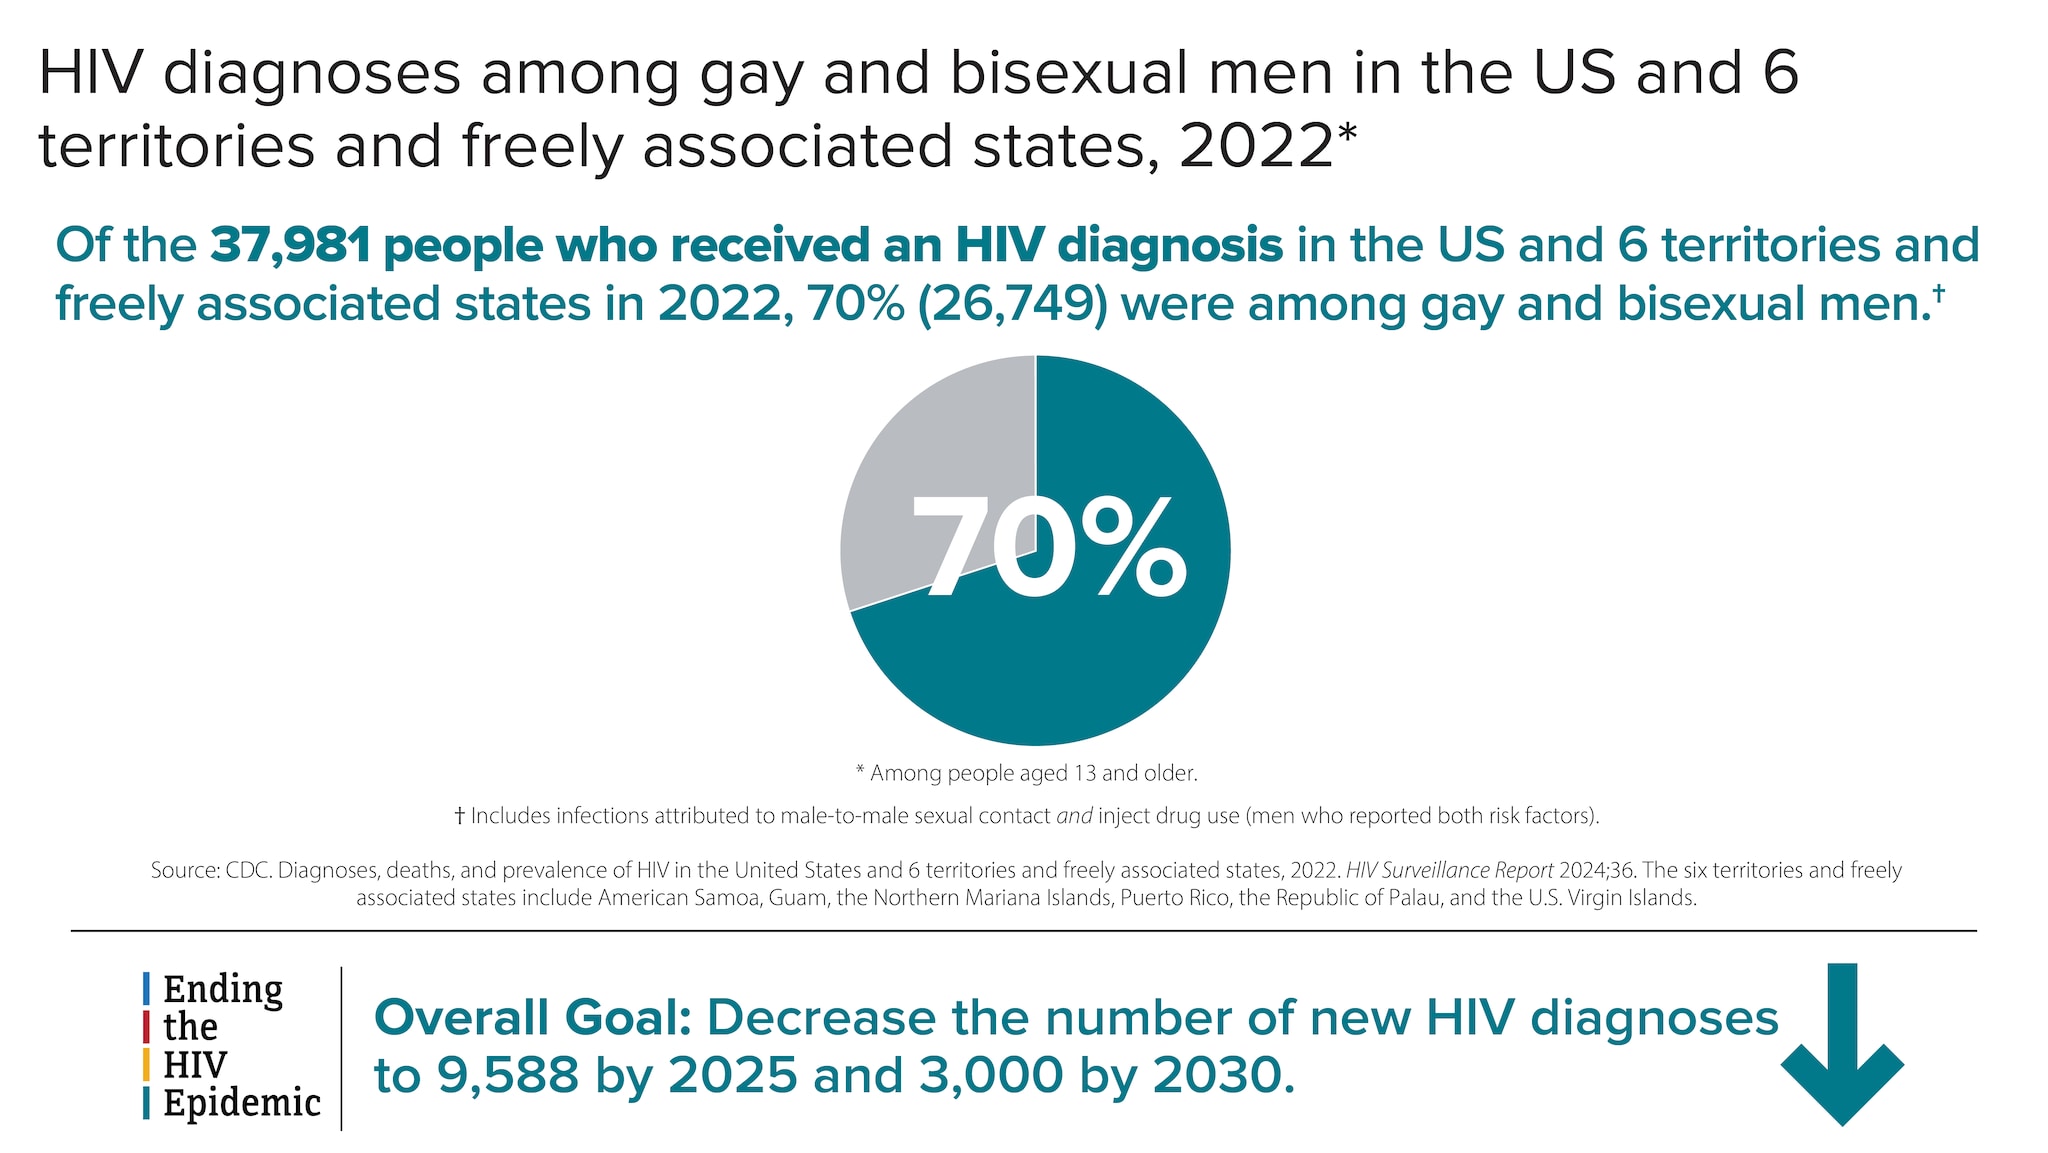
HIV diagnoses among gay and bisexual men in the US and 6 territories and freely associated states, 2022*
Of the 37,981 people who received an HIV diagnosis in the US and 6 territories and freely associated states in 2022, 70% (26,749) were among gay and bisexual men.†
*Among people aged 13 and older.
†Includes infections attributed to male-to-male sexual contact and inject drug use (men who reported both risk factors).
Source: CDC. Diagnoses, deaths, and prevalence of HIV in the United States and 6 territories and freely associated states, 2022. HIV Surveillance Report 2024;36. The six territories and freely associated states include American Samoa, Guam, the Northern Mariana Islands, Puerto Rico, the Republic of Palau, and the U.S. Virgin Islands.
Ending the HIV Epidemic: Overall Goal: Decrease the number of new HIV diagnoses to 9,588 by 2025 and 3,000 by 2030.
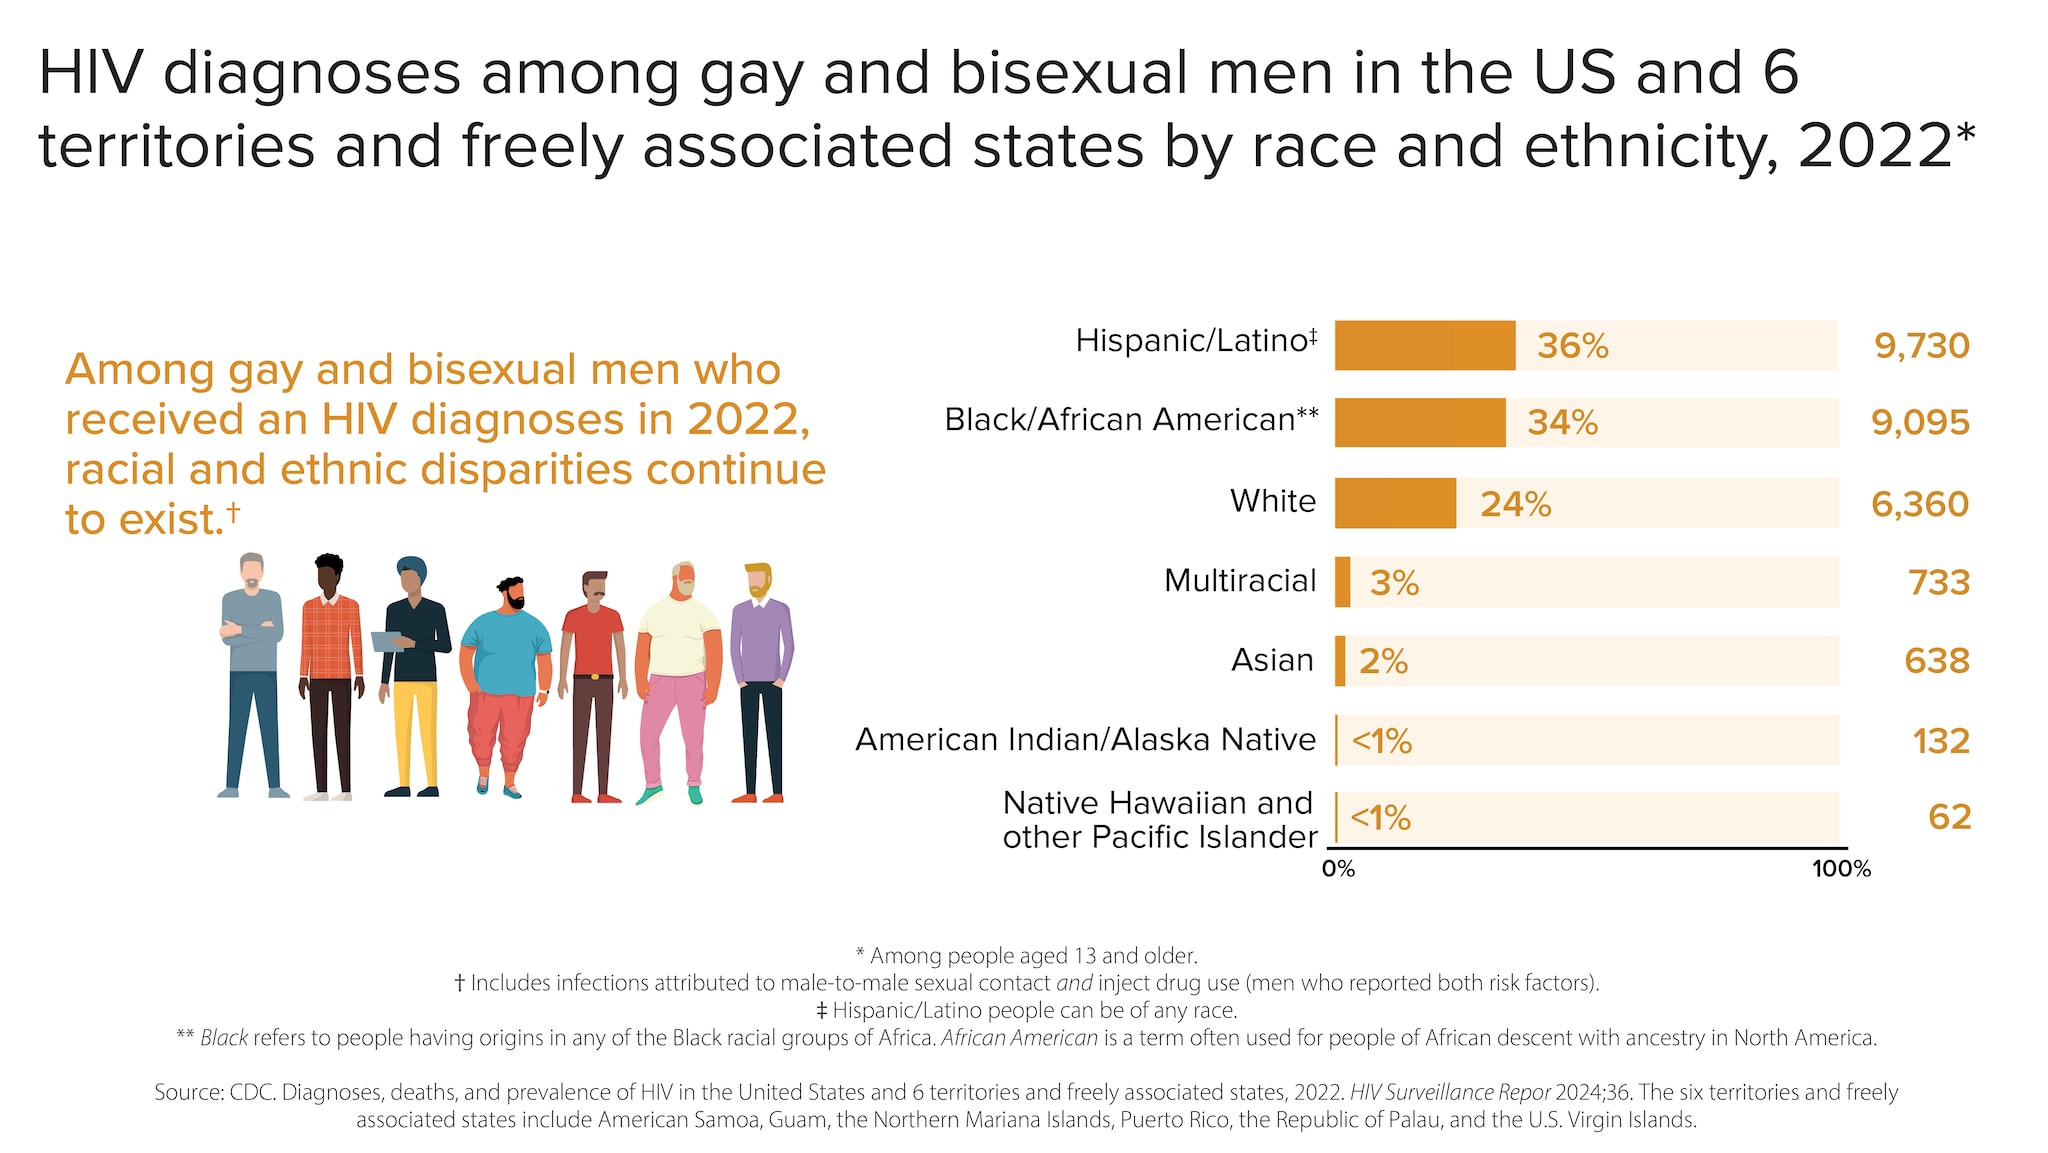
HIV diagnoses among gay and bisexual men in the US and 6 territories and freely associated states by race and ethnicity, 2022*
Among gay and bisexual men who received an HIV diagnosis in 2022, racial and ethnic disparities continue to exist.†
Hispanic/Latino‡36% 9,730
Black/African American**34% 9,095
White24% 6,360
Multiracial3% 733
Asian2% 638
American Indian/Alaska Native<1% 132
Native Hawaiian and other Pacific Islander<1% 62
† Includes infections attributed to male-to-male sexual contact and inject drug use (men who reported both risk factors).
** Black refers to people having origins in any of the Black racial groups of Africa. African American is a term often used for people of African descent with ancestry in North America.
Source: CDC. Diagnoses, deaths, and prevalence of HIV in the United States and 6 territories and freely associated states, 2022. HIV Surveillance Report 2024;36. The six territories and freely associated states include American Samoa, Guam, the Northern Mariana Islands, Puerto Rico, the Republic of Palau, and the U.S. Virgin Islands.
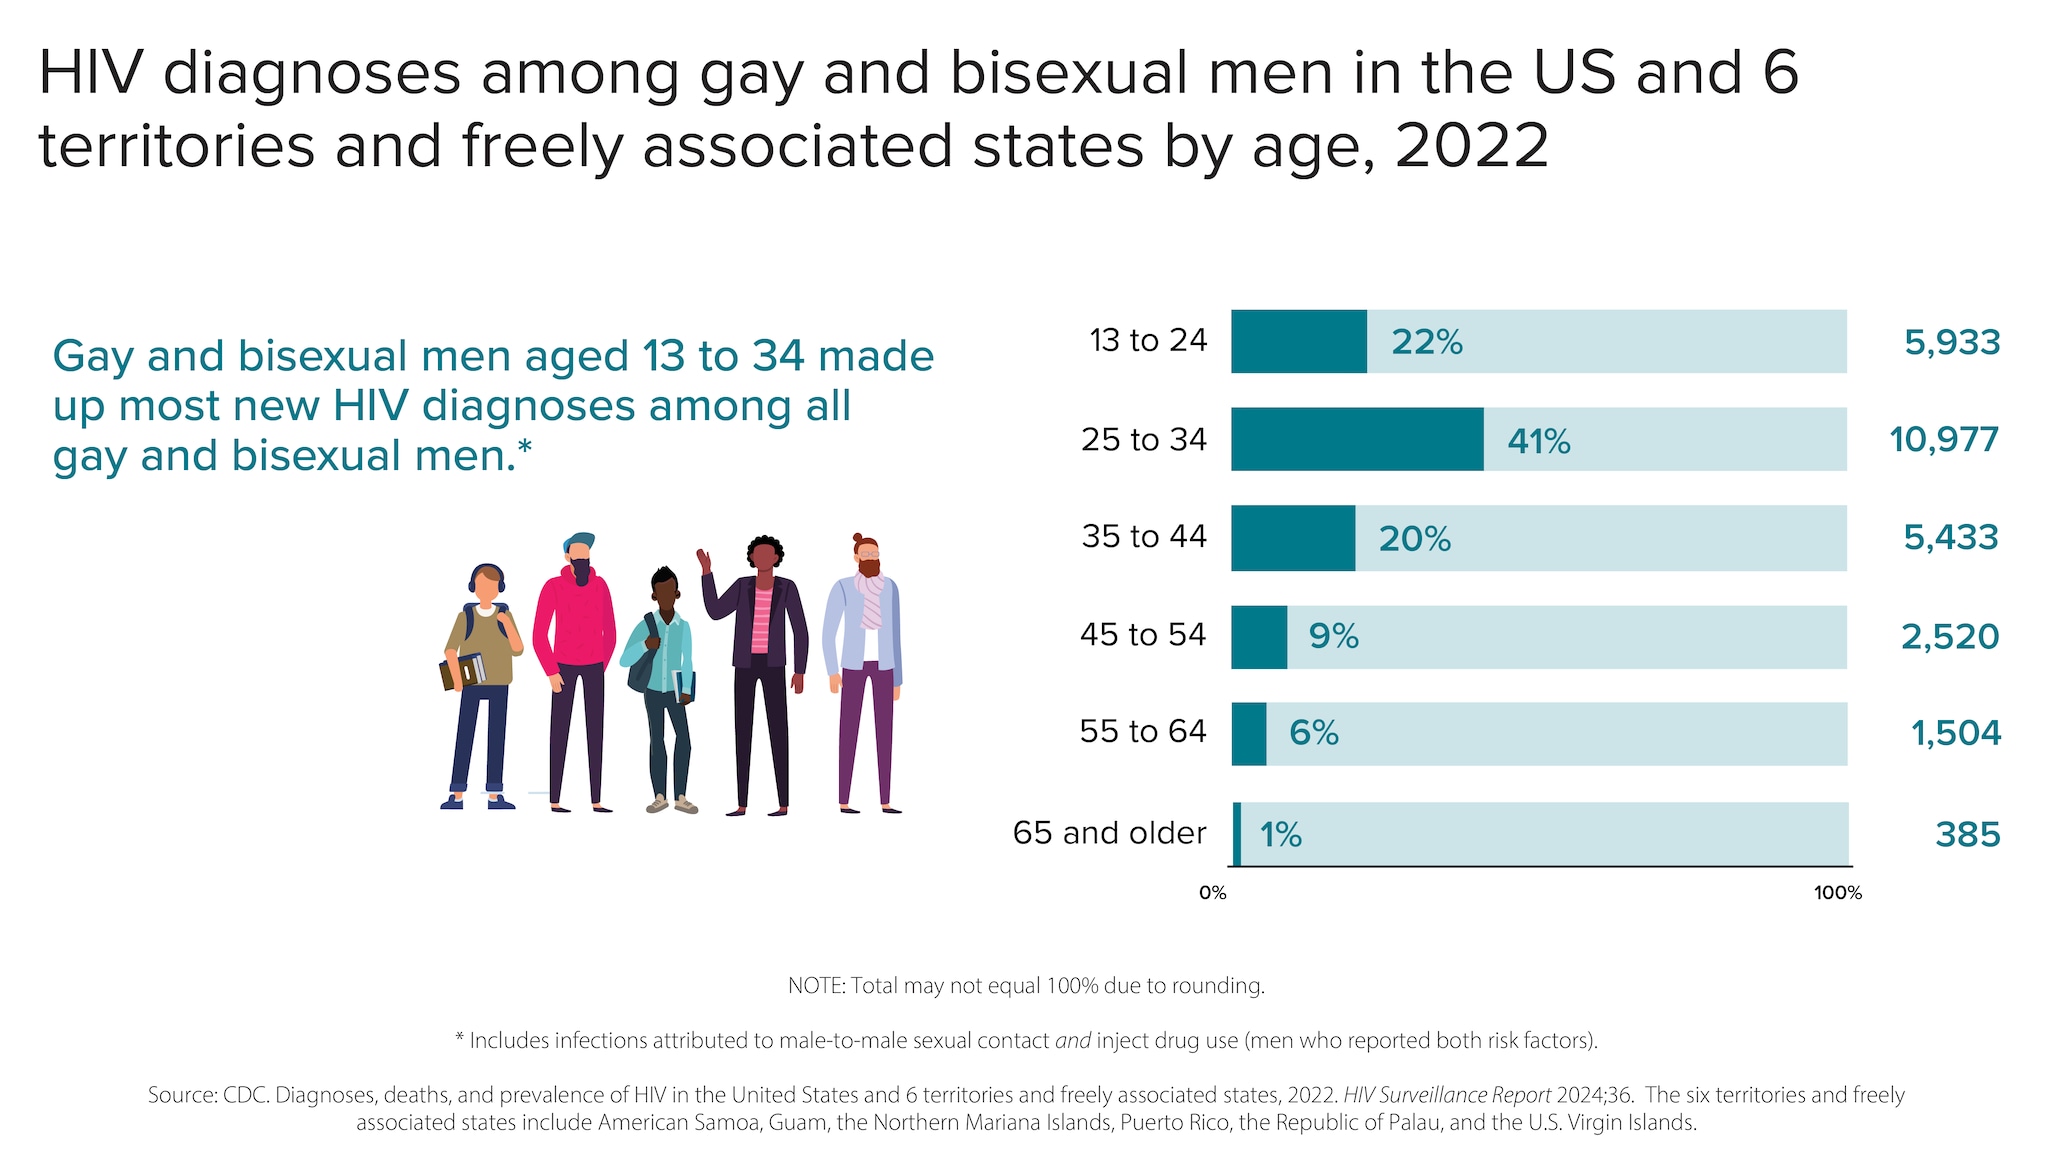
HIV diagnoses among gay and bisexual men in the US and 6 territories and freely associated states by age, 2022
Gay and bisexual men aged 13 to 34 made up most new HIV diagnoses among all gay and bisexual men.*
*Includes infections attributed to male-to-male sexual contact and inject drug use (men who reported both risk factors).
13 to 24: 22% (5,933); 25 to 34: 41% (10,977); 35 to 44: 20% (5,433); 45 to 54: 9% (2,520); 55 to 64: 6% (1,504); 65 and older: 1% (385)
NOTE: Total may not equal 100% due to rounding.
Source: CDC. Diagnoses, deaths, and prevalence of HIV in the United States and 6 territories and freely associated states, 2022. HIV Surveillance Report 2024:36. The six territories and freely associated states include American Samoa, Guam, the Northern Mariana Islands, Puerto Rico, the Republic of Palau, and the U.S. Virgin Islands.
From 2018 to 2022, HIV diagnoses remained stable among gay and bisexual men overall. But trends varied for different groups of gay and bisexual men.
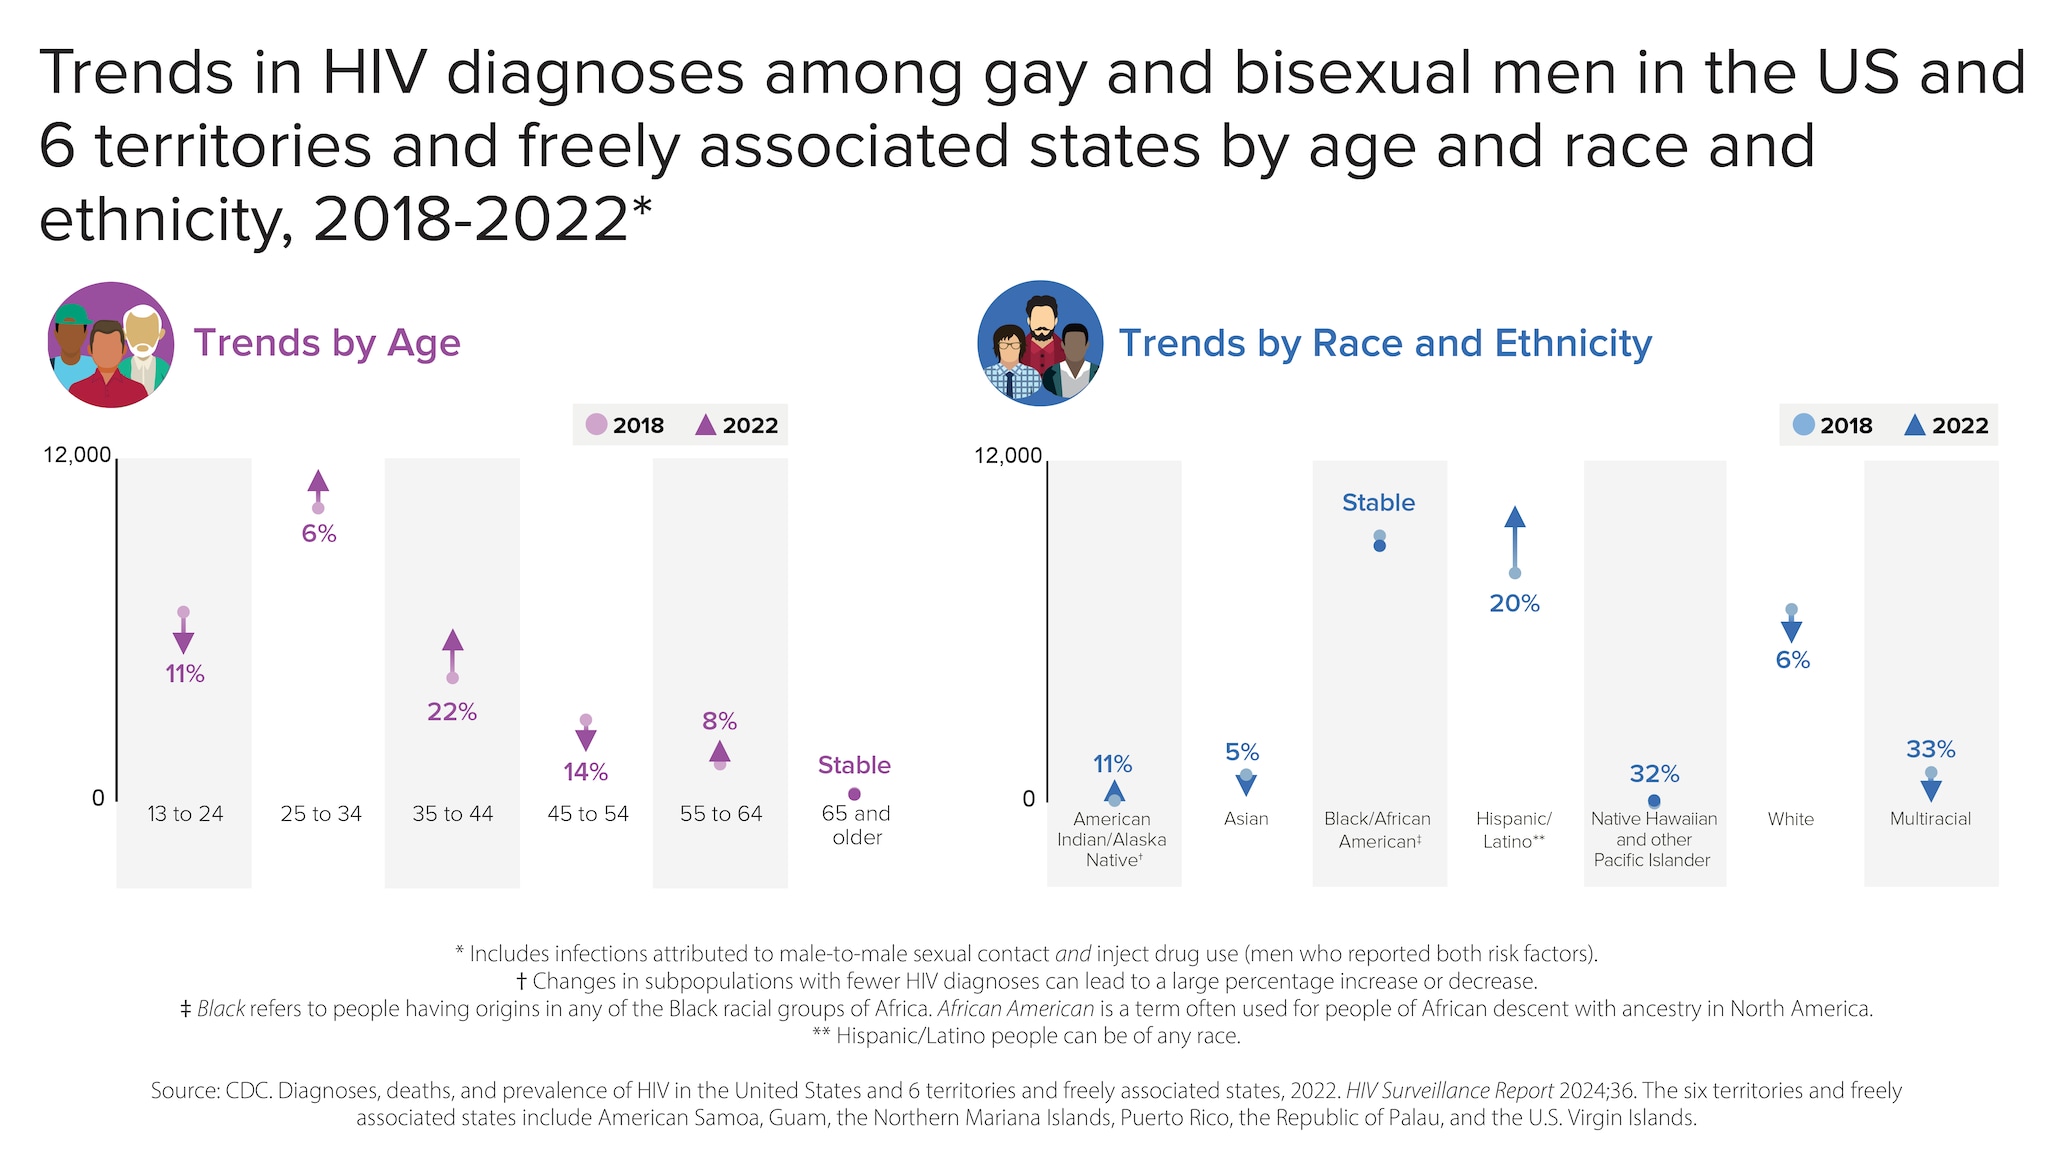
Trends in HIV diagnoses among gay and bisexual men in the US and 6 territories and freely associated states by age and race and ethnicity, 2018-2022*
Trends by Age
- 13 to 24 - 11% decrease
- 25 to 34 - 6% increase
- 35 to 44 - 22% increase
- 45 to 54 - 14% decrease
- 55 to 64 - 8% increase
- 65 and older - Stable
Trends by Race and Ethnicity
- American Indian/Alaska Native - 11% increase
- Asian - 5% decrease
- Black/African American - Stable
- Hispanic/Latino - 20% increase
- Native Hawaiian and other Pacific Islander - 32% increase
- White - 6% decrease
- Multiracial - 33% increase
*Includes infections attributed to male-to-male sexual contact and inject drug use (men who reported both risk factors).† Changes in subpopulations with fewer HIV diagnoses can lead to a large percentage increase or decrease.‡ Black refers to people having origins in any of the Black racial groups of Africa. African American is a term often used for people of African descent with ancestry in North America.** Hispanic/Latino people can be of any race.
Source: CDC. Diagnoses, deaths, and prevalence of HIV in the United States and 6 territories and freely associated states, 2022. HIV Surveillance Report 2024;36. The six territories and freely associated states include American Samoa, Guam, the Northern Mariana Islands, Puerto Rico, the Republic of Palau, and the U.S. Virgin Islands.
Knowledge of status
Knowledge of status refers to the estimated percentage of people with HIV who have received an HIV diagnosis.
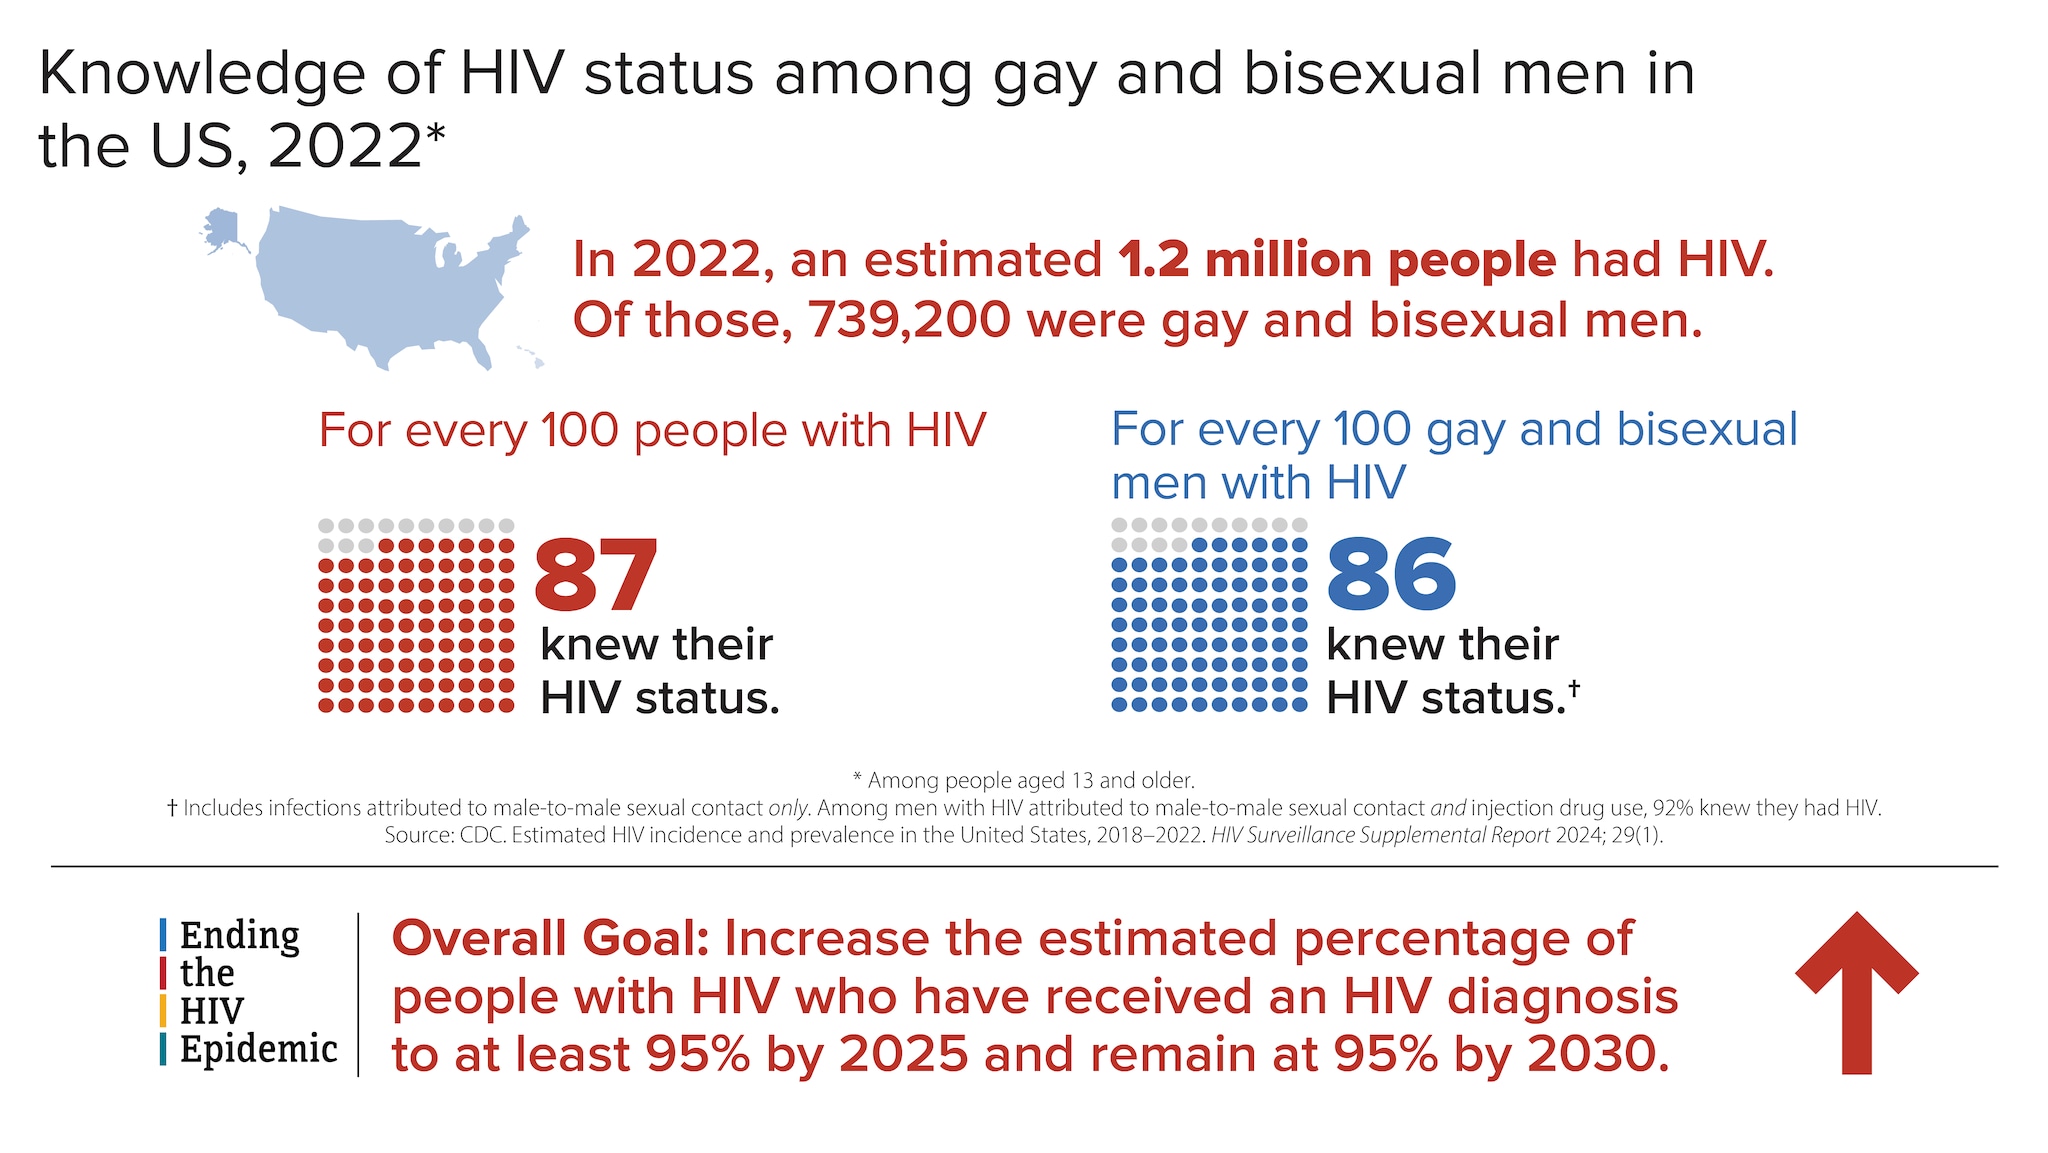
Knowledge of HIV status among gay and bisexual men in the US, 2022*
In 2022, an estimated 1.2 million people had HIV. Of those, 739,200 were gay and bisexual men. For every 100 people with HIV, 87 knew their HIV status.
For every 100 gay and bisexual men with HIV, 86 knew their HIV status.†
Among men with HIV attributed to male-to-male sexual contact and injection drug use, 92% knew they had HIV.
†Includes infections attributed to male-to-male sexual contact only.
Source: CDC. Estimated HIV incidence and prevalence in the United States, 2018-2022. HIV Surveillance Supplemental Report 2024; 29(1).
Ending the HIV Epidemic Overall Goal: Increase the estimated percentage of people with HIV who have received an HIV diagnosis to at least 95% by 2025 and remain at 95% by 2030.
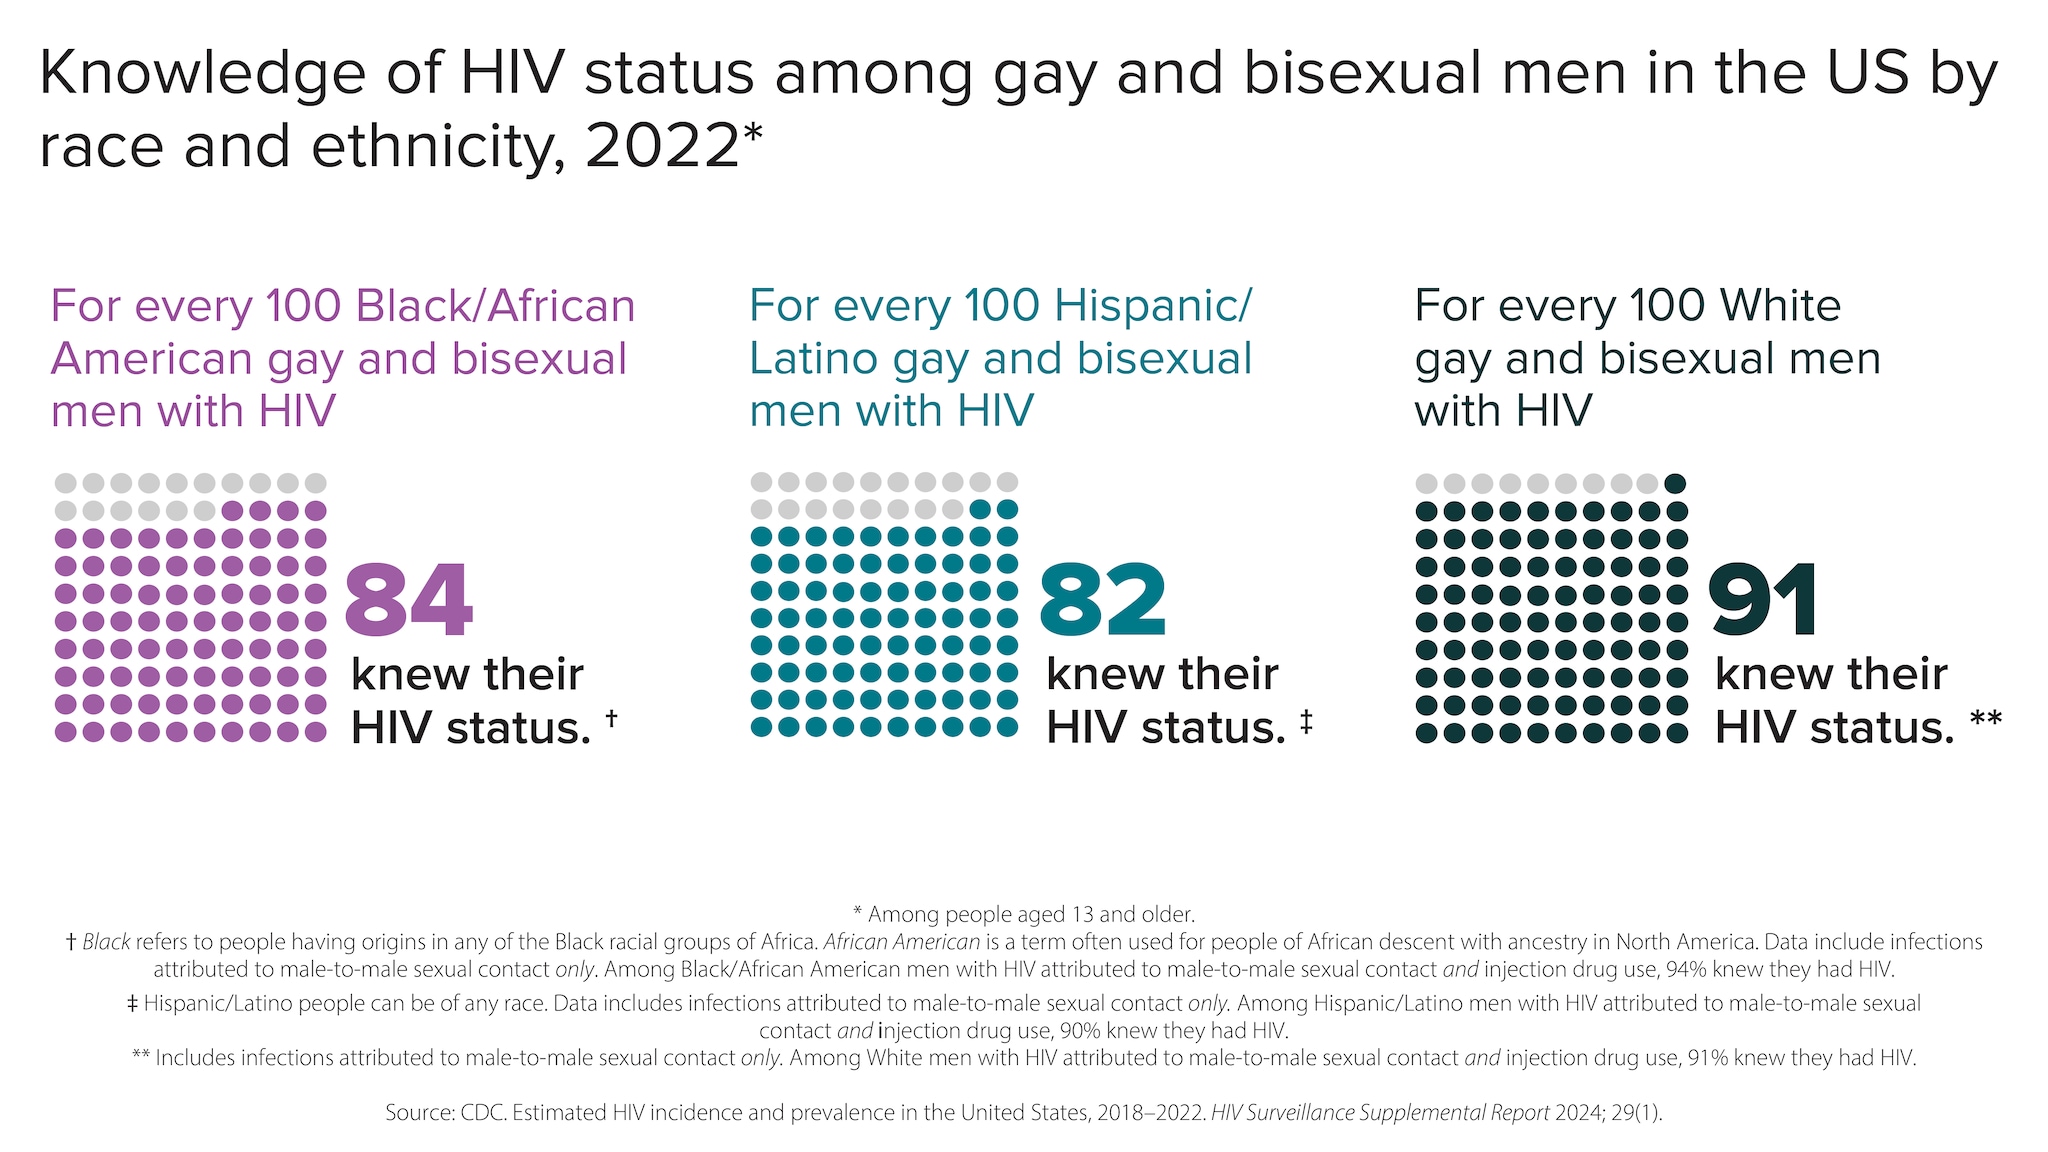
Knowledge of HIV status among gay and bisexual men in the US by race and ethnicity, 2022*
For every 100 Black/African American gay and bisexual men with HIV, 84 knew their HIV status. †
For every 100 Hispanic/Latino gay and bisexual men with HIV, 82 knew their HIV status. ‡
For every 100 White gay and bisexual men with HIV, 91 knew their HIV status. **
*Among people aged 13 and older.
† Black refers to people having origins in any of the Black racial groups of Africa. African American is a term often used for people of African descent with ancestry in North America. Data include infections attributed to male-to-male sexual contact only. Among Black/African American men with HIV attributed to male-to-male sexual contact and injection drug use, 94% knew they had HIV.
‡ Hispanic/Latino people can be of any race. Data includes infections attributed to male-to-male sexual contact only. Among Hispanic/Latino men with HIV attributed to male-to-male sexual contact and injection drug use, 90% knew they had HIV.
** Includes infections attributed to male-to-male sexual contact only. Among White men with HIV attributed to male-to-male sexual contact and injection drug use, 91% knew they had HIV.
Source: CDC. Estimated HIV incidence and prevalence in the United States, 2018–2022. HIV Surveillance Supplemental Report 2024; 29(1).
There are many HIV prevention strategies available, including condoms; pre-exposure prophylaxis (PrEP); post-exposure prophylaxis (PEP); as well as interventions focused on risk reduction; adherence to HIV medicine; linkage to, retention in, and re-engagement in care; structural approaches; and engagement in PrEP care. Additionally, for people with HIV, treatment provides substantial benefits for personal health and reduces HIV transmission to others. This is sometimes called HIV treatment as prevention.
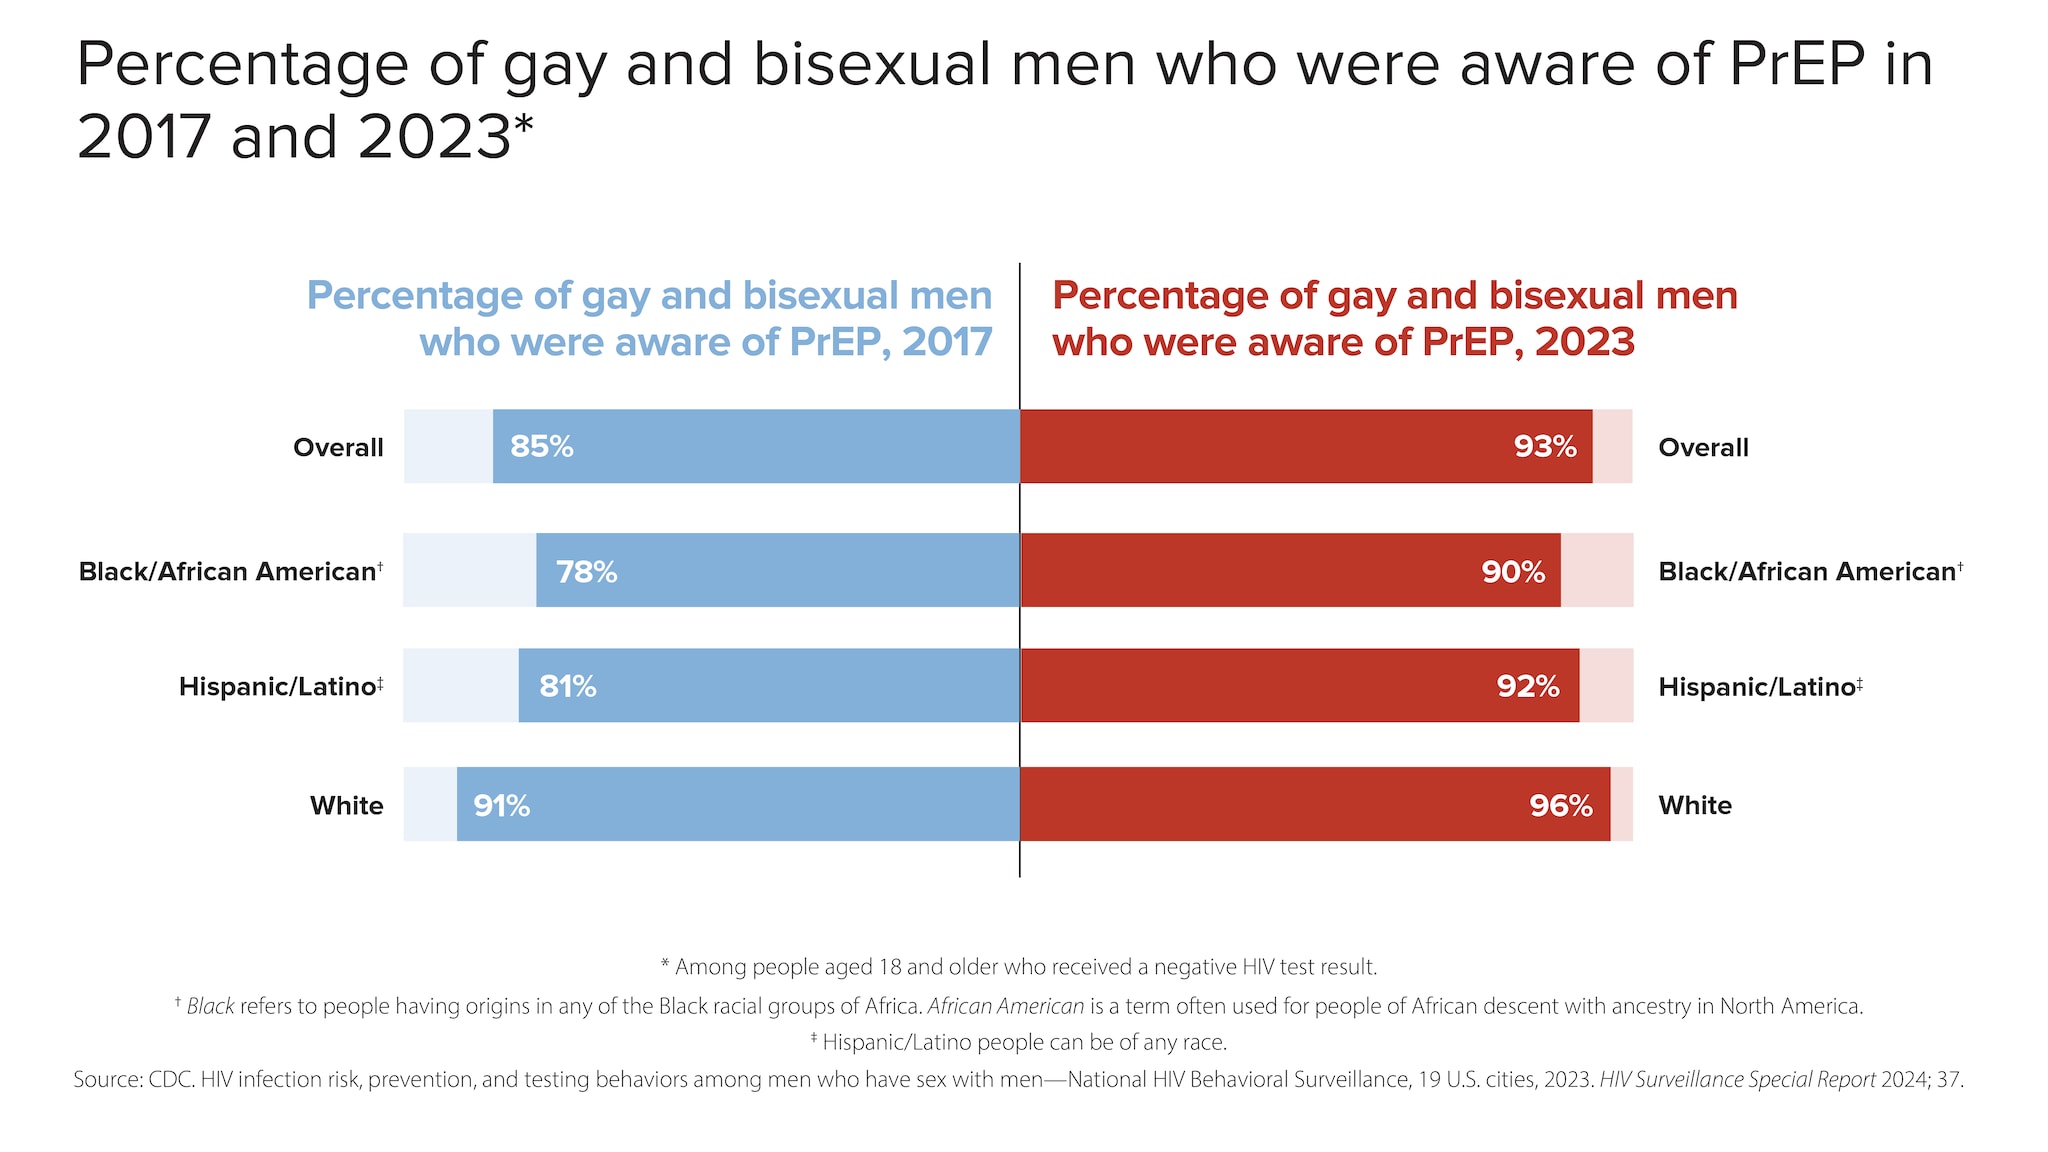
Percentage of gay and bisexual men who were aware of PrEP in 2017 and 2023*
Percentage of gay and bisexual men who were aware of PrEP, 2017
- Overall: 85%
- Black/African American†: 78%
- Hispanic/Latino‡: 81%
- White: 91%
Percentage of gay and bisexual men who were aware of PrEP, 2023
- Overall: 93%
- Black/African American†: 90%
- Hispanic/Latino‡: 92%
- White: 96%
*Among people aged 18 and older who received a negative HIV test result.
†Black refers to people having origins in any of the Black racial groups of Africa. African American is a term often used for people of African descent with ancestry in North America.
‡Hispanic/Latino people can be of any race.
Source: CDC. HIV infection risk, prevention, and testing behaviors among men who have sex with men—National HIV Behavioral Surveillance, 19 U.S. cities, 2023. HIV Surveillance Special Report 2024; 37.
Viral Suppression and barriers to care
Viral suppression refers to the percentage of people with diagnosed HIV who have less than 200 copies of HIV per milliliter of blood.
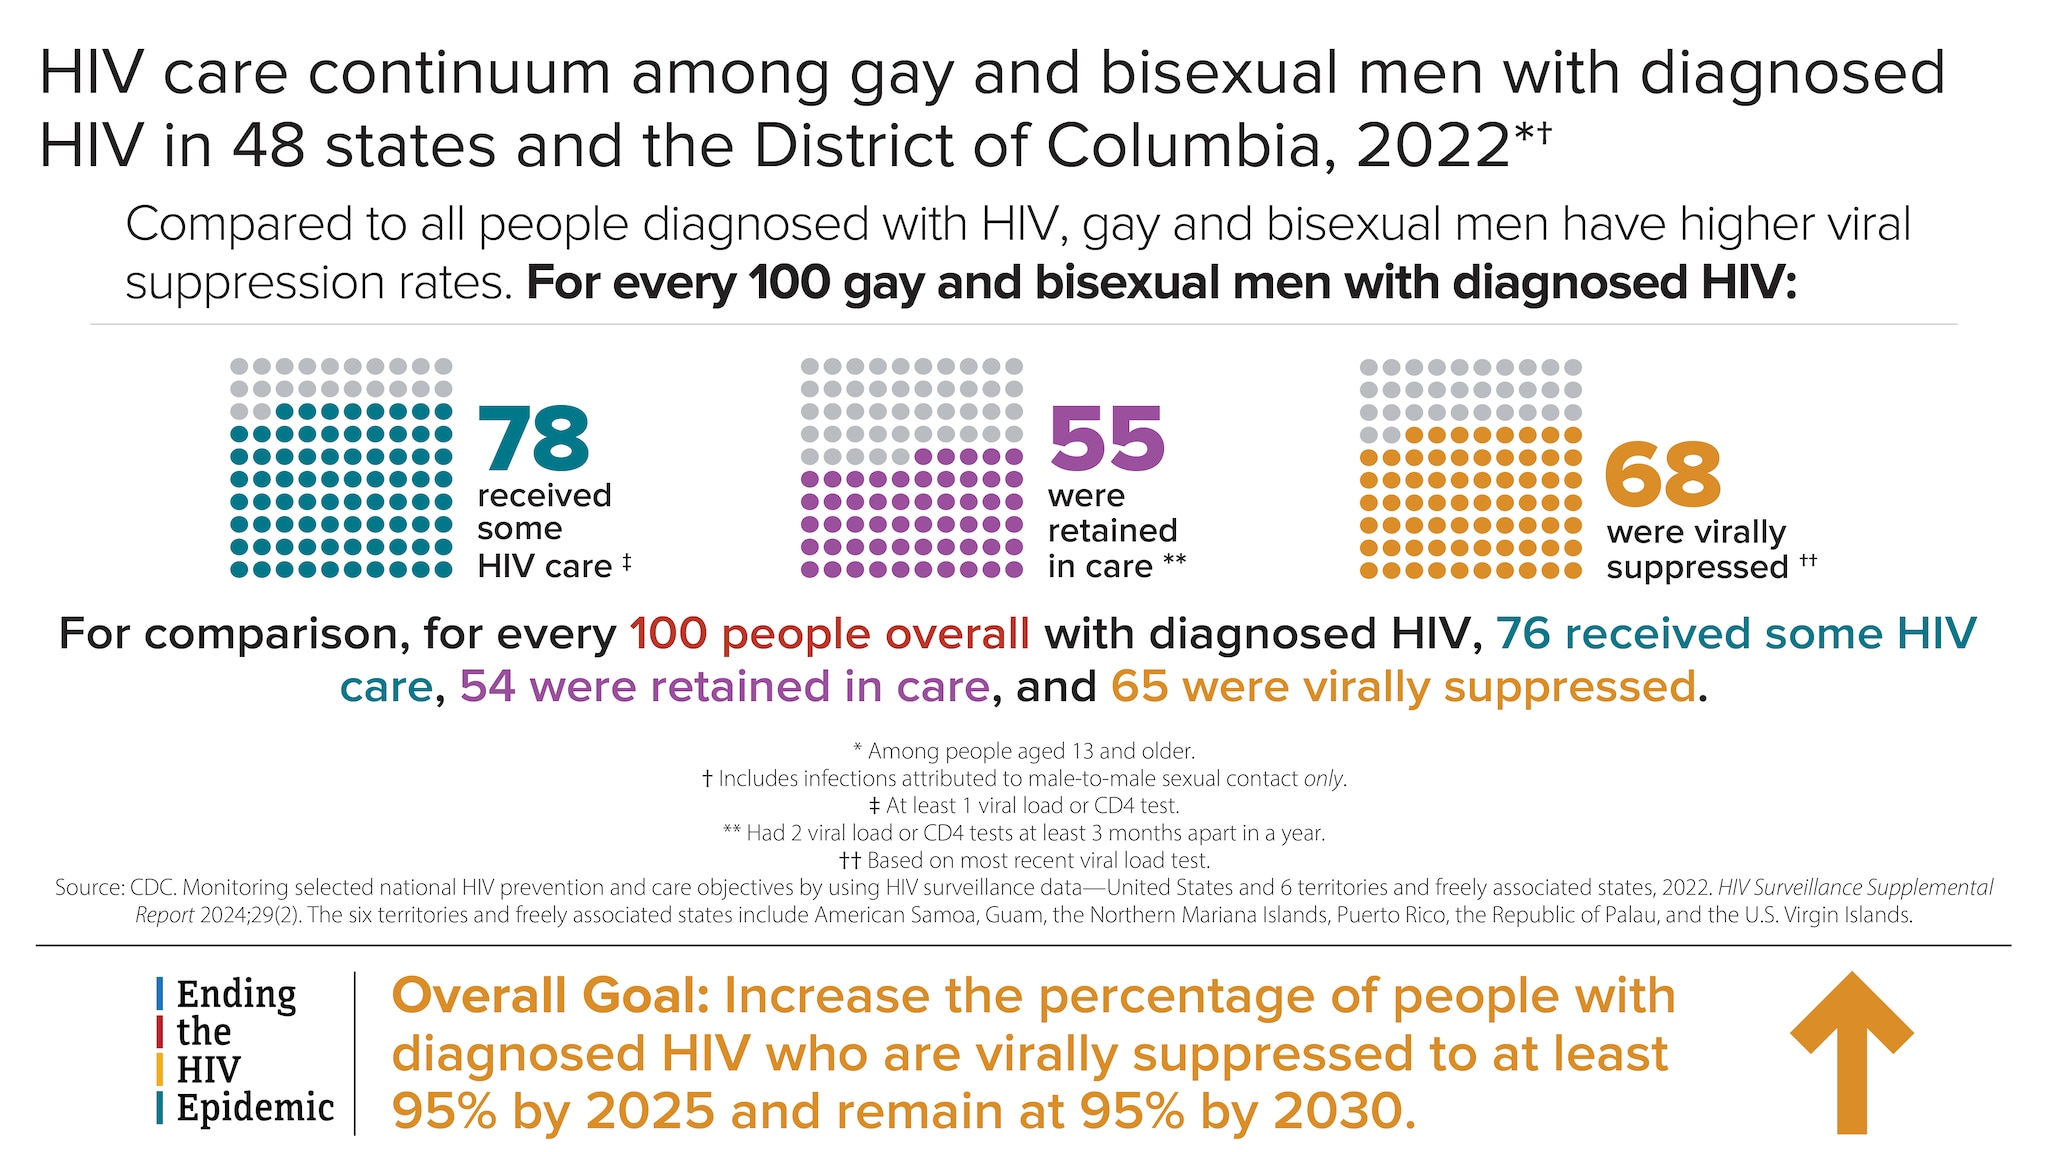
HIV care continuum among gay and bisexual men with diagnosed HIV in 48 states and the District of Columbia, 2022*†Compared to all people diagnosed with HIV, gay and bisexual men have higher viral suppression rates. For every 100 gay and bisexual men with diagnosed HIV:
[Image of dots representing a visual count] 78 received some HIV care ‡
[Image of dots representing a visual count] 55 were retained in care **
[Image of dots representing a visual count] 68 were virally suppressed ††
For comparison, for every 100 people overall with diagnosed HIV, 76 received some HIV care, 54 were retained in care, and 65 were virally suppressed.
*Among people aged 13 and older.
† Includes infections attributed to male-to-male sexual contact only.
‡ At least 1 viral load or CD4 test.
** Had 2 viral load or CD4 tests at least 3 months apart in a year.
†† Based on most recent viral load test.
Source: CDC. Monitoring selected national HIV prevention and care objectives by using HIV surveillance data—United States and 6 territories and freely associated states, 2022. HIV Surveillance Supplemental Report 2024;29(2). The six territories and freely associated states include American Samoa, Guam, the Northern Mariana Islands, Puerto Rico, the Republic of Palau, and the U.S. Virgin Islands.
Ending the HIV Epidemic Overall Goal: Increase the percentage of people with diagnosed HIV who are virally suppressed to at least 95% by 2025 and remain at 95% by 2030.
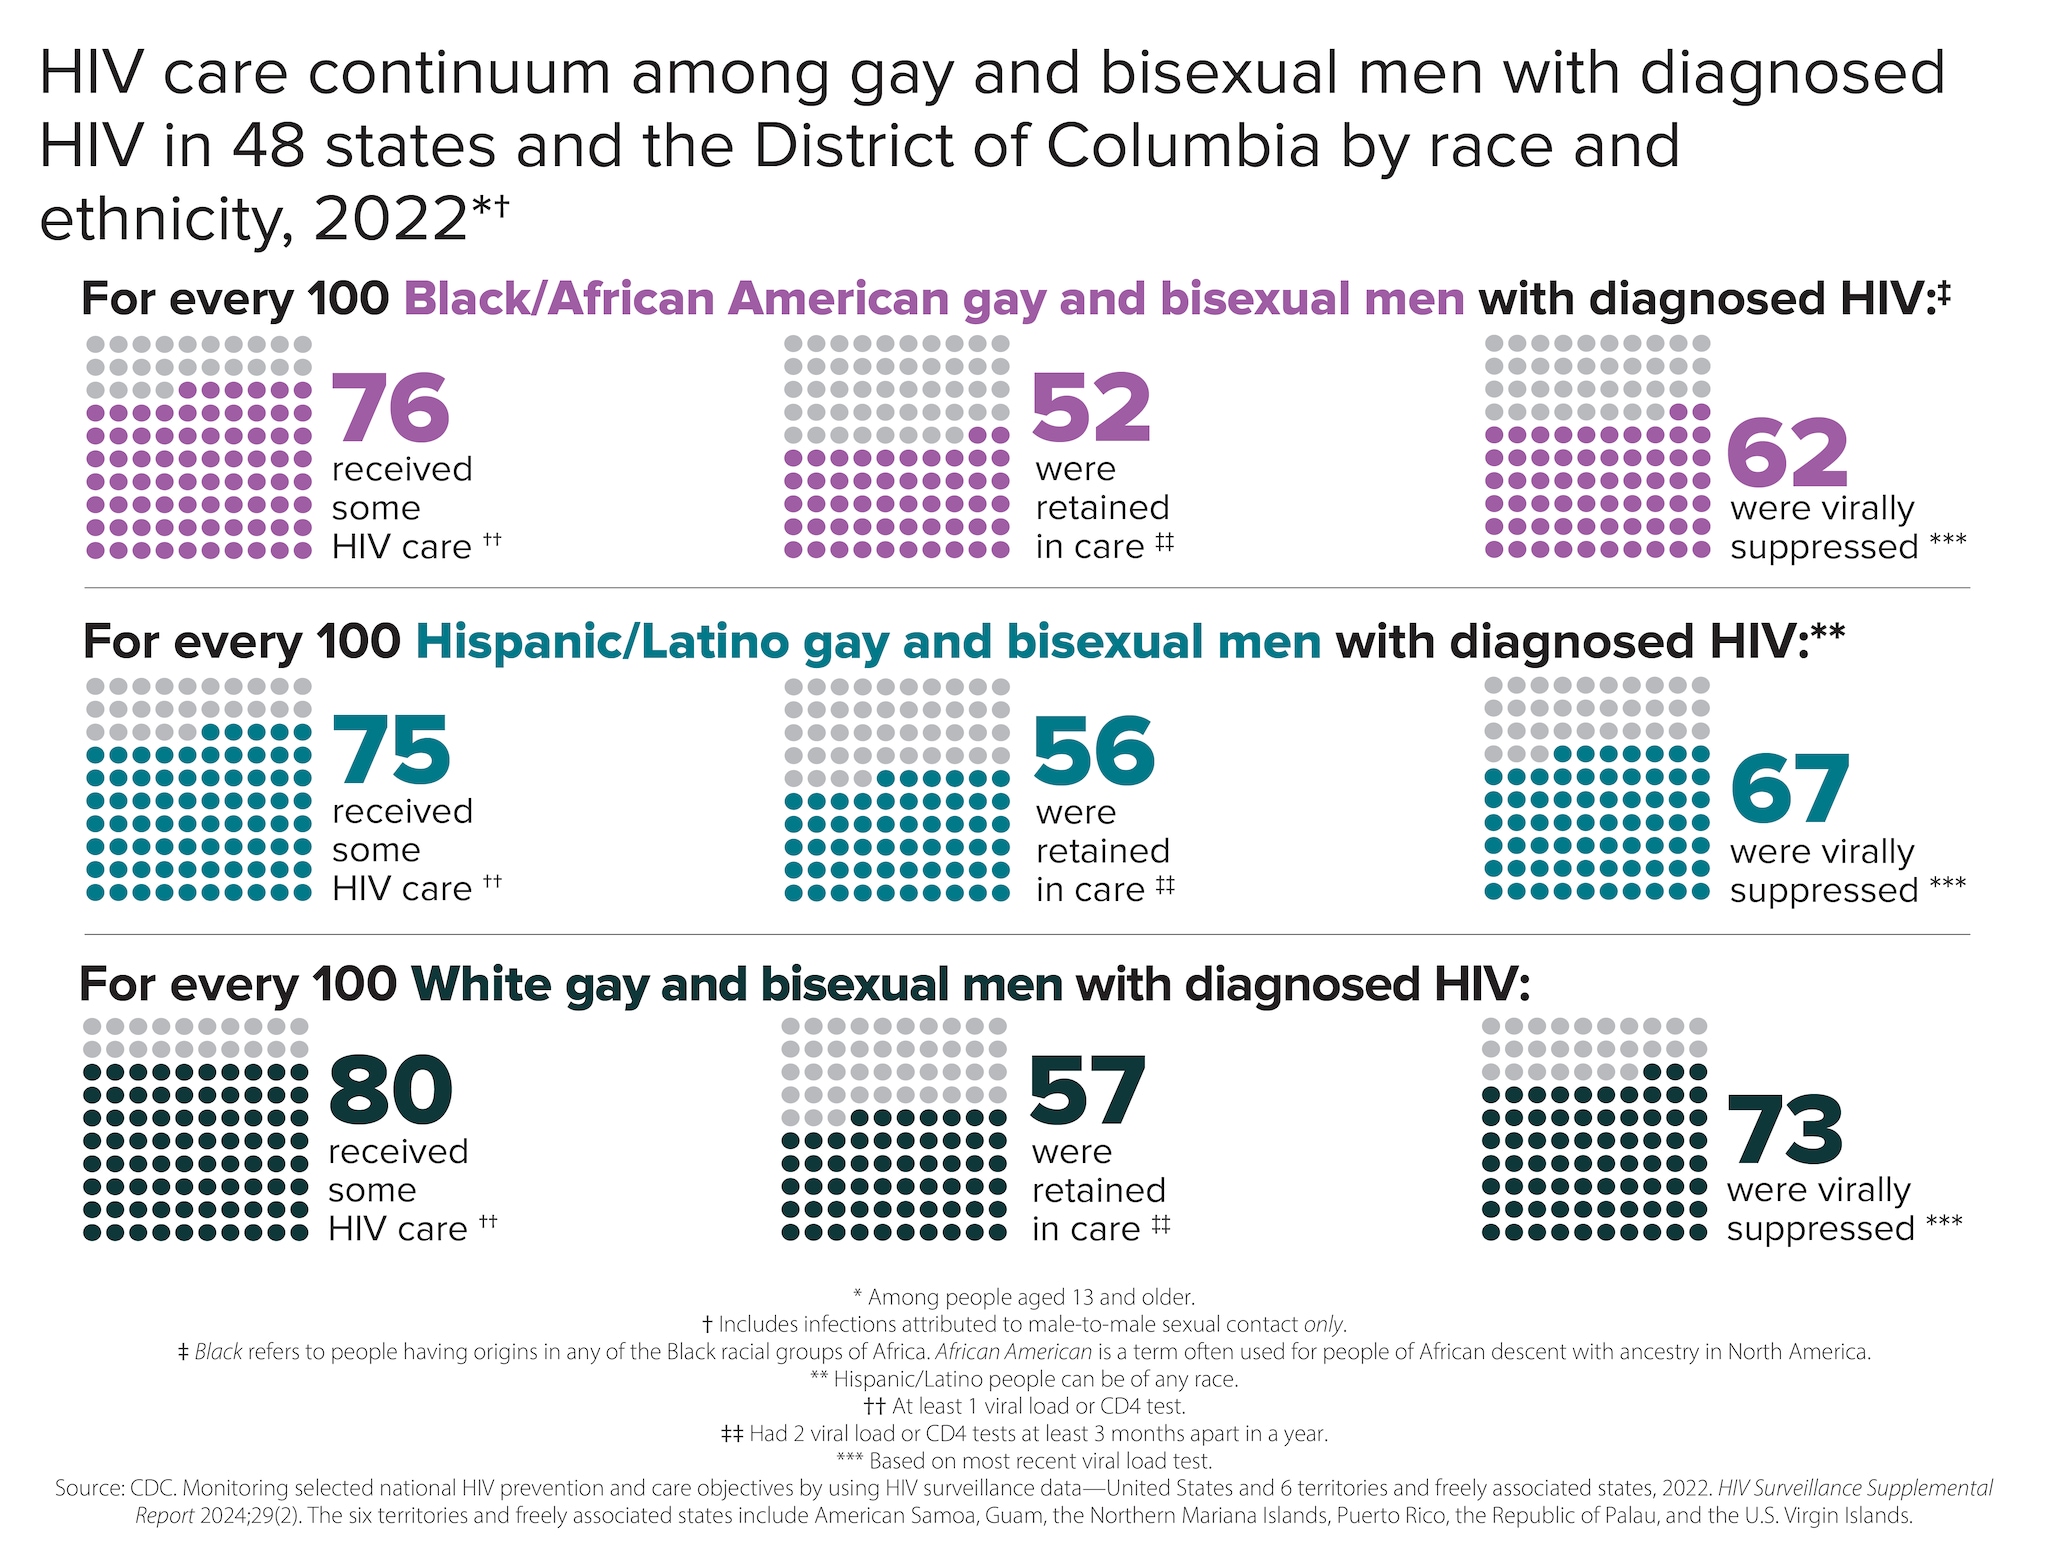
HIV care continuum among gay and bisexual men with diagnosed HIV in 48 states and the District of Columbia by race and ethnicity, 2022*†
For every 100 Black/African American gay and bisexual men with diagnosed HIV:
- ‡76 received some HIV care
- ††52 were retained in care
- ‡62 were virally suppressed ***
For every 100 Hispanic/Latino gay and bisexual men with diagnosed HIV:
- **75 received some HIV care
- ††56 were retained in care
- ‡67 were virally suppressed ***
For every 100 White gay and bisexual men with diagnosed HIV:
- 80 received some HIV care
- ††57 were retained in care
- ‡73 were virally suppressed ***
*Among people aged 13 and older.
† Includes infections attributed to male-to-male sexual contact only.
‡ Black refers to people having origins in any of the Black racial groups of Africa. African American is a term often used for people of African descent with ancestry in North America.
** Hispanic/Latino people can be of any race.
†† At least 1 viral load or CD4 test.
‡‡ Had 2 viral load or CD4 tests at least 3 months apart in a year.
*** Based on most recent viral load test.
Source: CDC. Monitoring selected national HIV prevention and care objectives by using HIV surveillance data—United States and 6 territories and freely associated states, 2022. HIV Surveillance Supplemental Report 2024;29(2). The six territories and freely associated states include American Samoa, Guam, the Northern Mariana Islands, Puerto Rico, the Republic of Palau, and the U.S. Virgin Islands.
Many people with HIV experience challenges with achieving and maintaining viral suppression over time. Some of these challenges include missing HIV medical appointments, needing but not receiving other important health care services, or missing doses of HIV treatment.
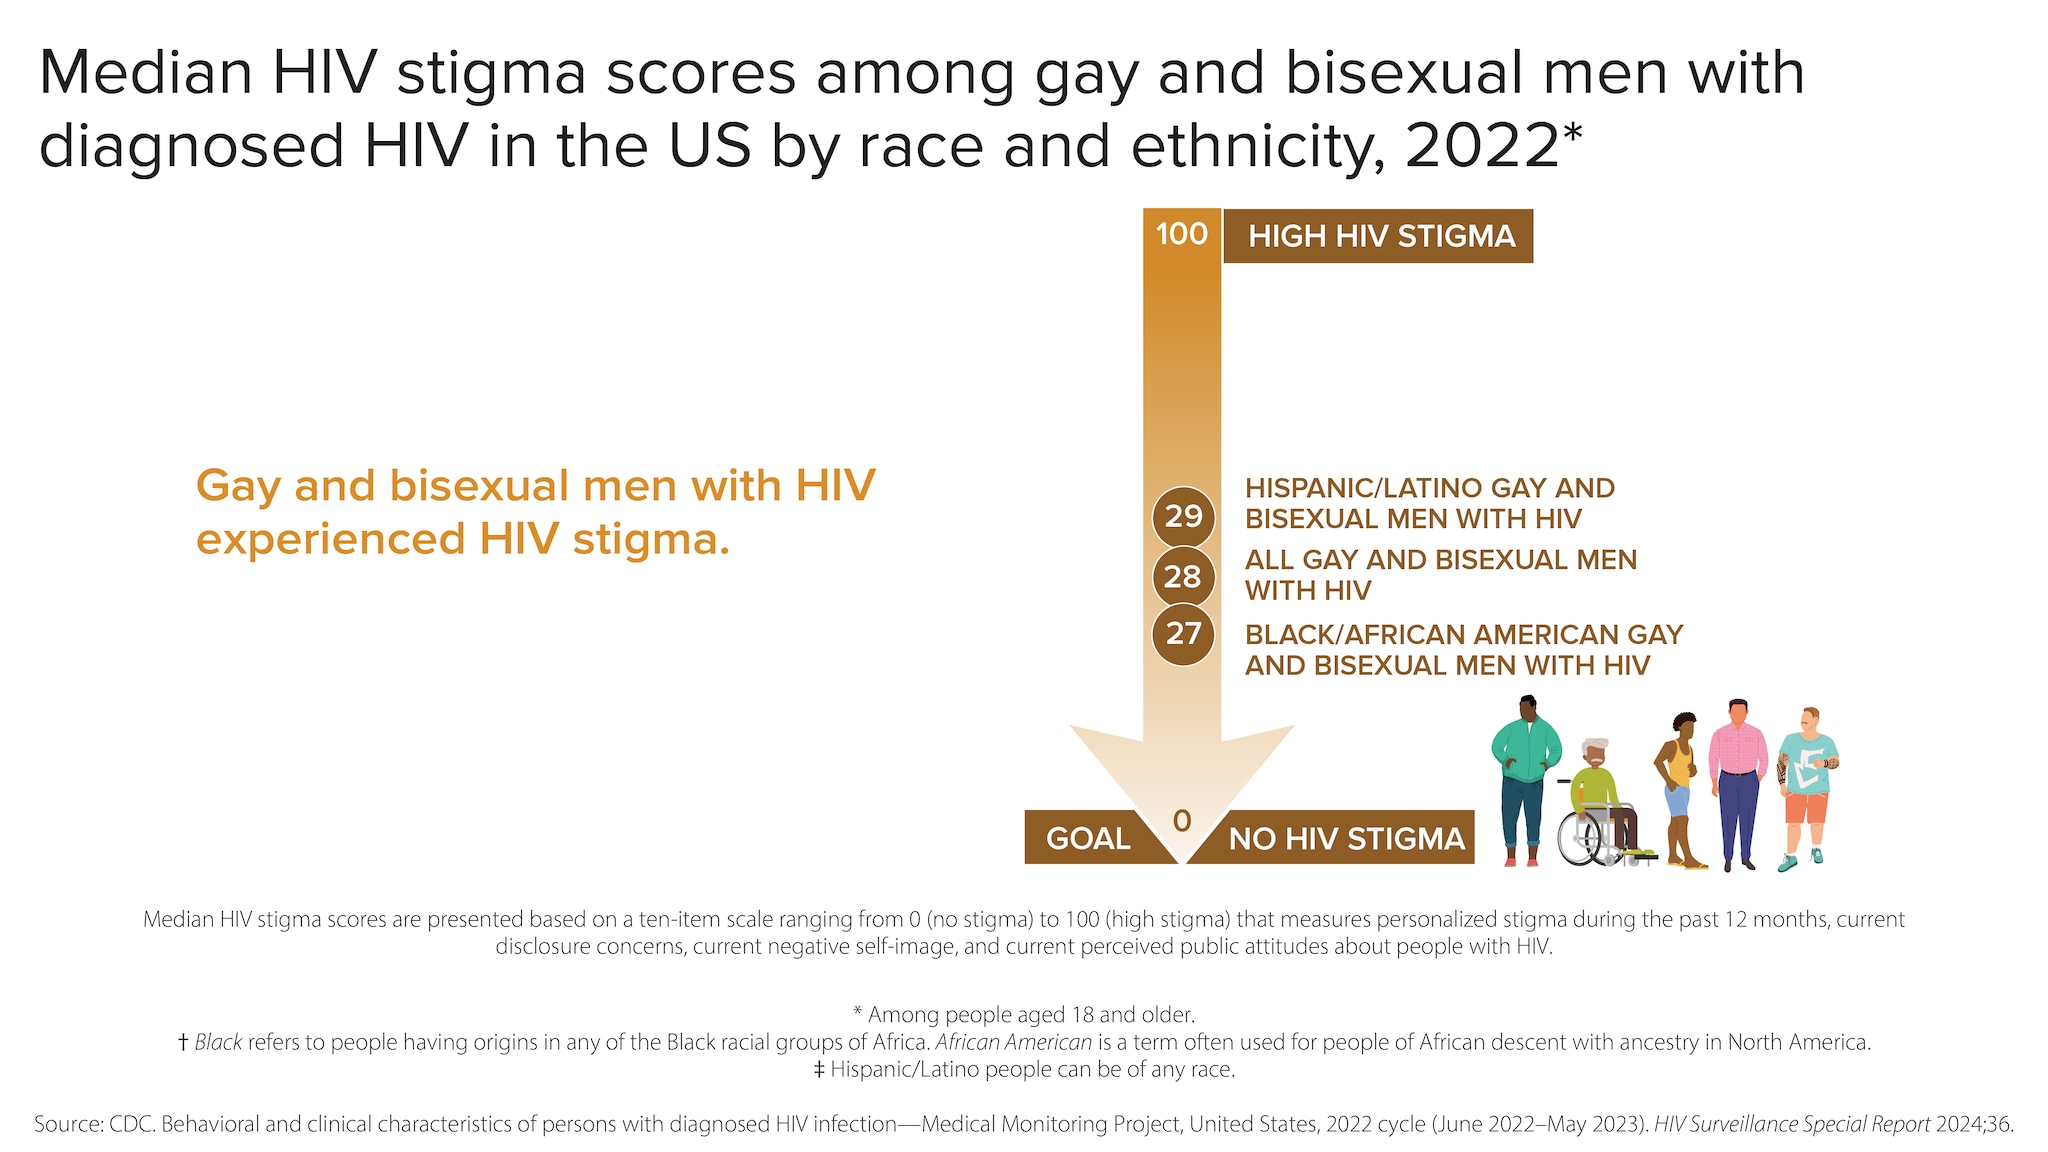
Median HIV stigma scores among gay and bisexual men with diagnosed HIV in the US by race and ethnicity, 2022*
Gay and bisexual men with HIV experienced HIV stigma.
- 29 HISPANIC/LATINO GAY AND BISEXUAL MEN WITH HIV
- 28 ALL GAY AND BISEXUAL MEN WITH HIV
- 27 BLACK/AFRICAN AMERICAN GAY AND BISEXUAL MEN WITH HIV
Median HIV stigma scores are presented based on a ten-item scale ranging from 0 (no stigma) to 100 (high stigma) that measures personalized stigma during the past 12 months, current disclosure concerns, current negative self-image, and current perceived public attitudes about people with HIV.
*Among people aged 18 and older.
† Black refers to people having origins in any of the Black racial groups of Africa. African American is a term often used for people of African descent with ancestry in North America.
‡ Hispanic/Latino people can be of any race.
Source: CDC. Behavioral and clinical characteristics of persons with diagnosed HIV infection—Medical Monitoring Project, United States, 2022 cycle (June 2022–May 2023). HIV Surveillance Special Report 2024;36.
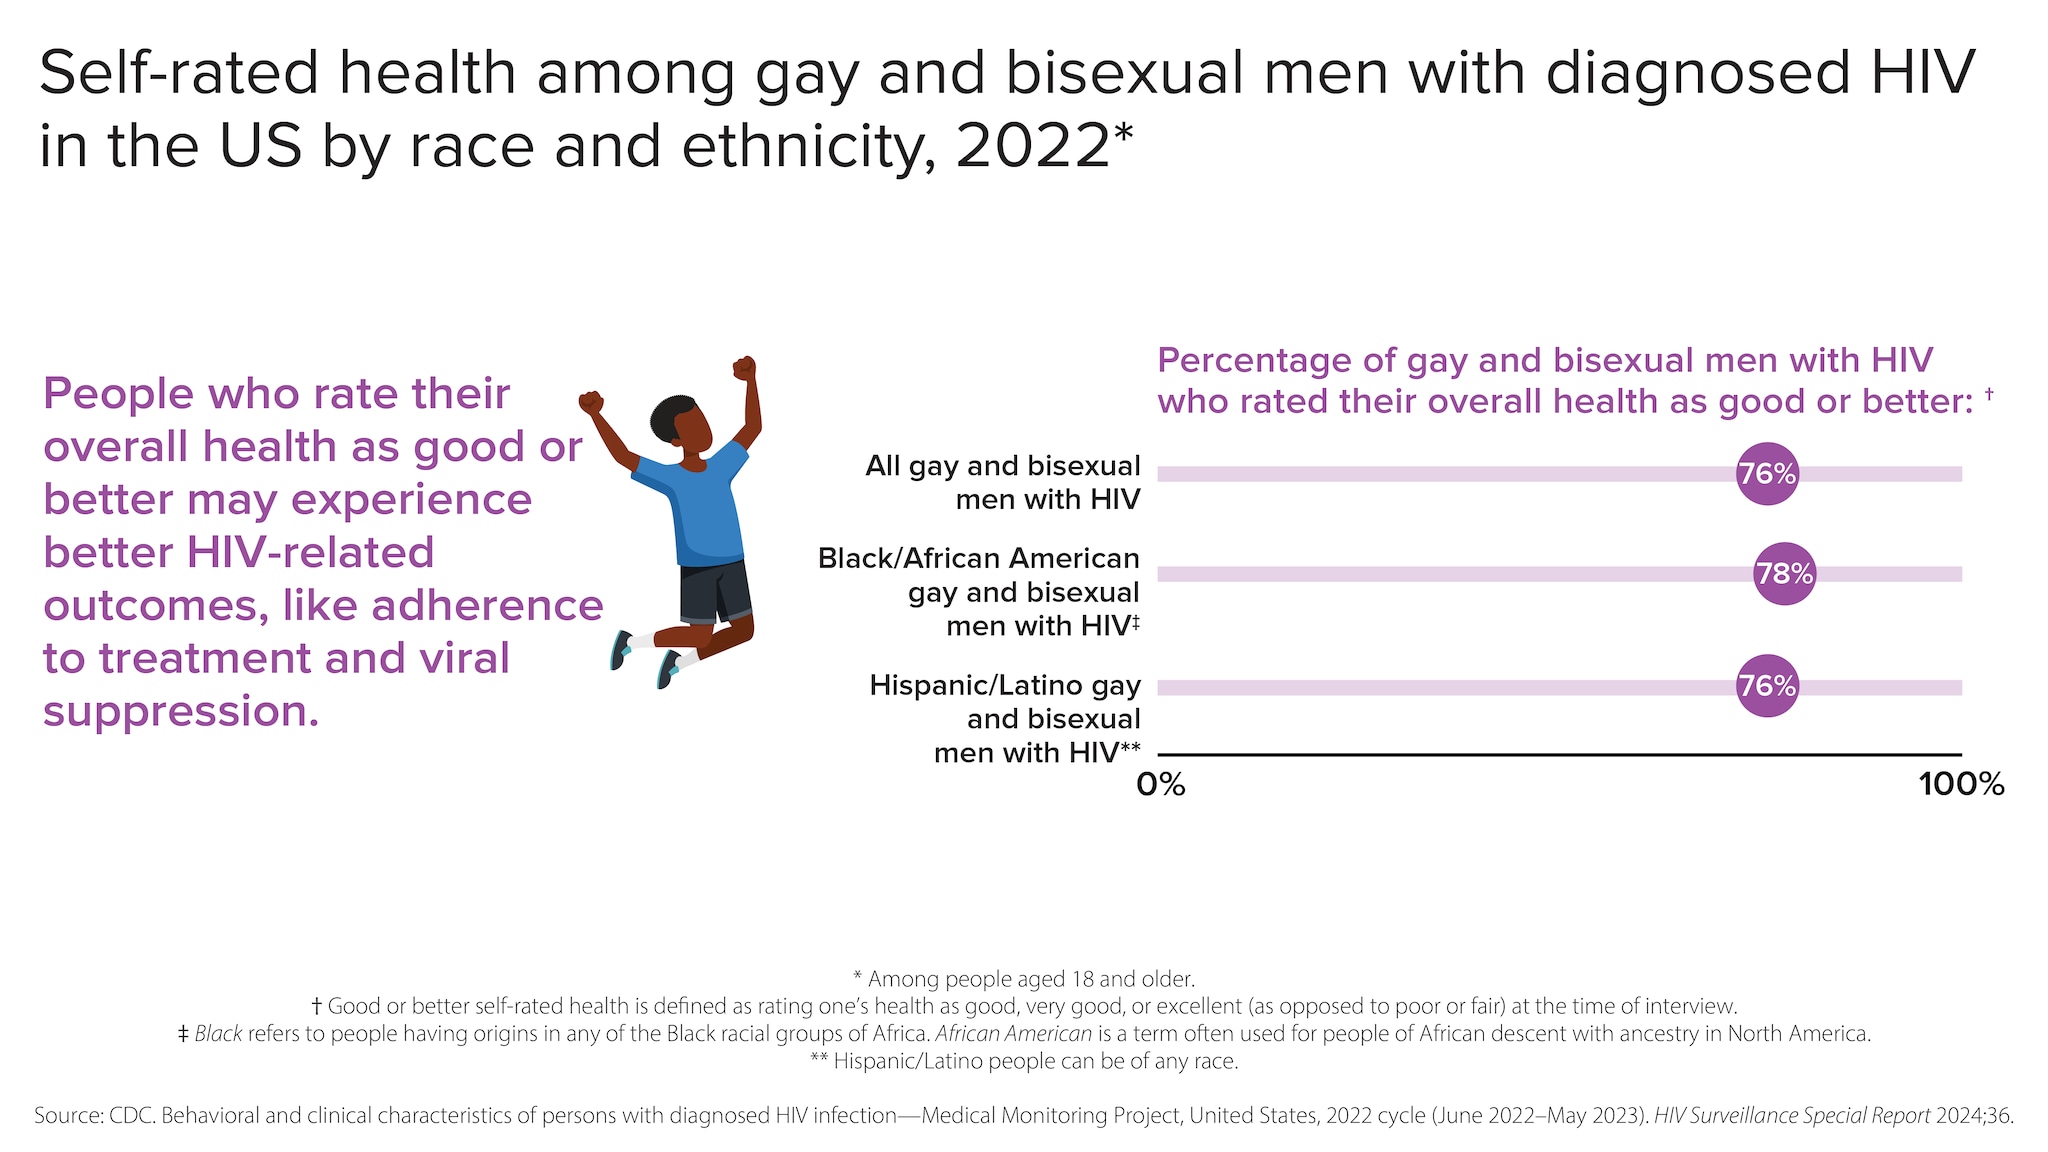
Self-rated health among gay and bisexual men with diagnosed HIV in the US by race and ethnicity, 2022*
People who rate their overall health as good or better may experience better HIV-related outcomes, like adherence to treatment and viral suppression.
Percentage of gay and bisexual men with HIV who rated their overall health as good or better: †
- All gay and bisexual men with HIV: 76%
- Black/African American gay and bisexual men with HIV‡: 78%
- Hispanic/Latino gay and bisexual men with HIV**: 76%
*Among people aged 18 and older.
† Good or better self-rated health is defined as rating one's health as good, very good, or excellent (as opposed to poor or fair) at the time of interview.
‡ Black refers to people having origins in any of the Black racial groups of Africa. African American is a term often used for people of African descent with ancestry in North America.
** Hispanic/Latino people can be of any race.
Source: CDC. Behavioral and clinical characteristics of persons with diagnosed HIV infection—Medical Monitoring Project, United States, 2022 cycle (June 2022–May 2023). HIV Surveillance Special Report 2024;36.
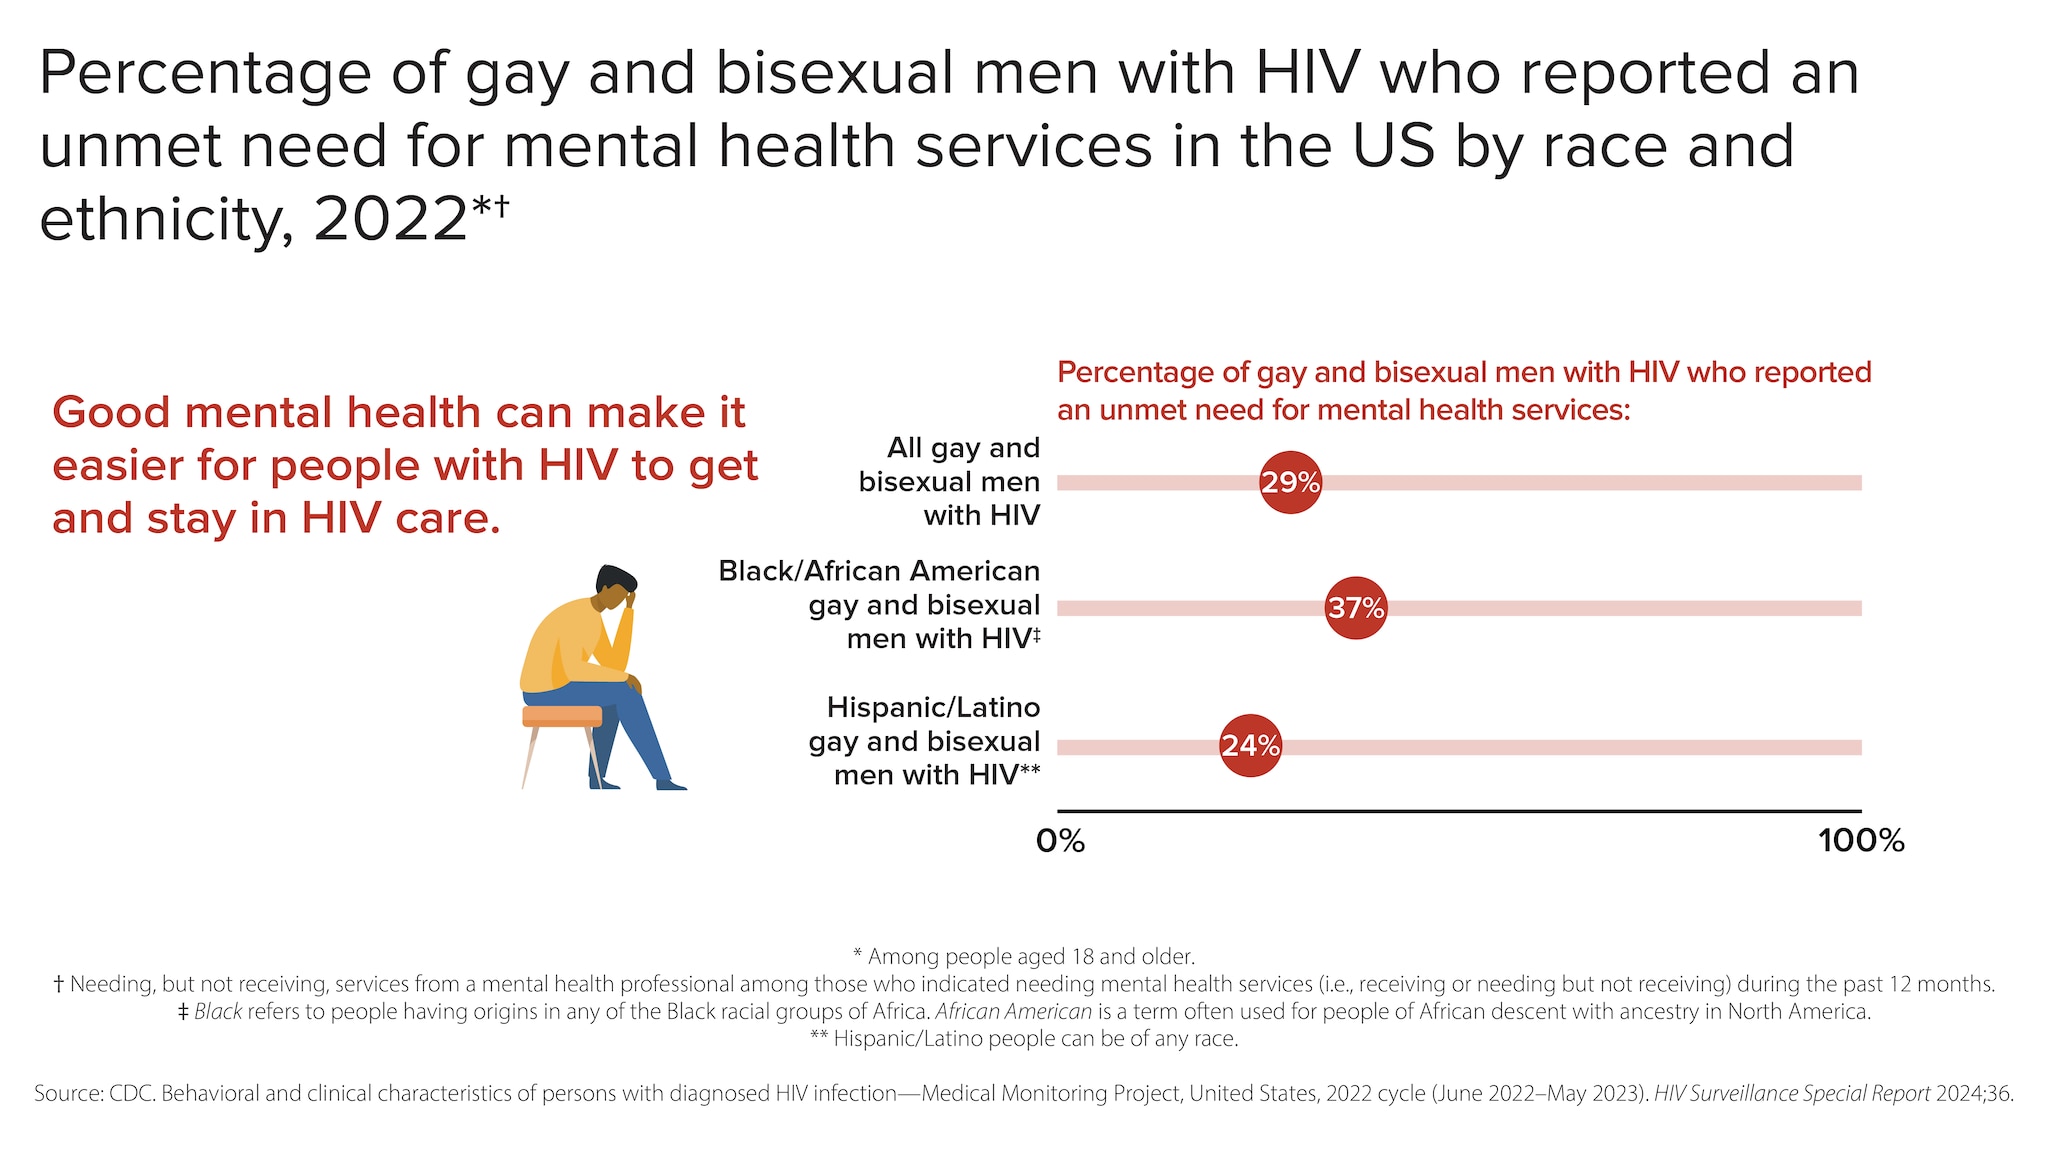
Percentage of gay and bisexual men with HIV who reported an unmet need for mental health services in the US by race and ethnicity, 2022*†
Good mental health can make it easier for people with HIV to get and stay in HIV care.
All gay and bisexual men with HIV - 29%
Black/African American gay and bisexual men with HIV‡ - 37%
Hispanic/Latino gay and bisexual men with HIV** - 24%
*Among people aged 18 and older.
† Needing, but not receiving, services from a mental health professional among those who indicated needing mental health services (i.e., receiving or needing but not receiving) during the past 12 months.
‡ Black refers to people having origins in any of the Black racial groups of Africa. African American is a term often used for people of African descent with ancestry in North America.
** Hispanic/Latino people can be of any race.
Source: CDC. Behavioral and clinical characteristics of persons with diagnosed HIV infection—Medical Monitoring Project, United States, 2022 cycle (June 2022–May 2023). HIV Surveillance Special Report 2024;36.
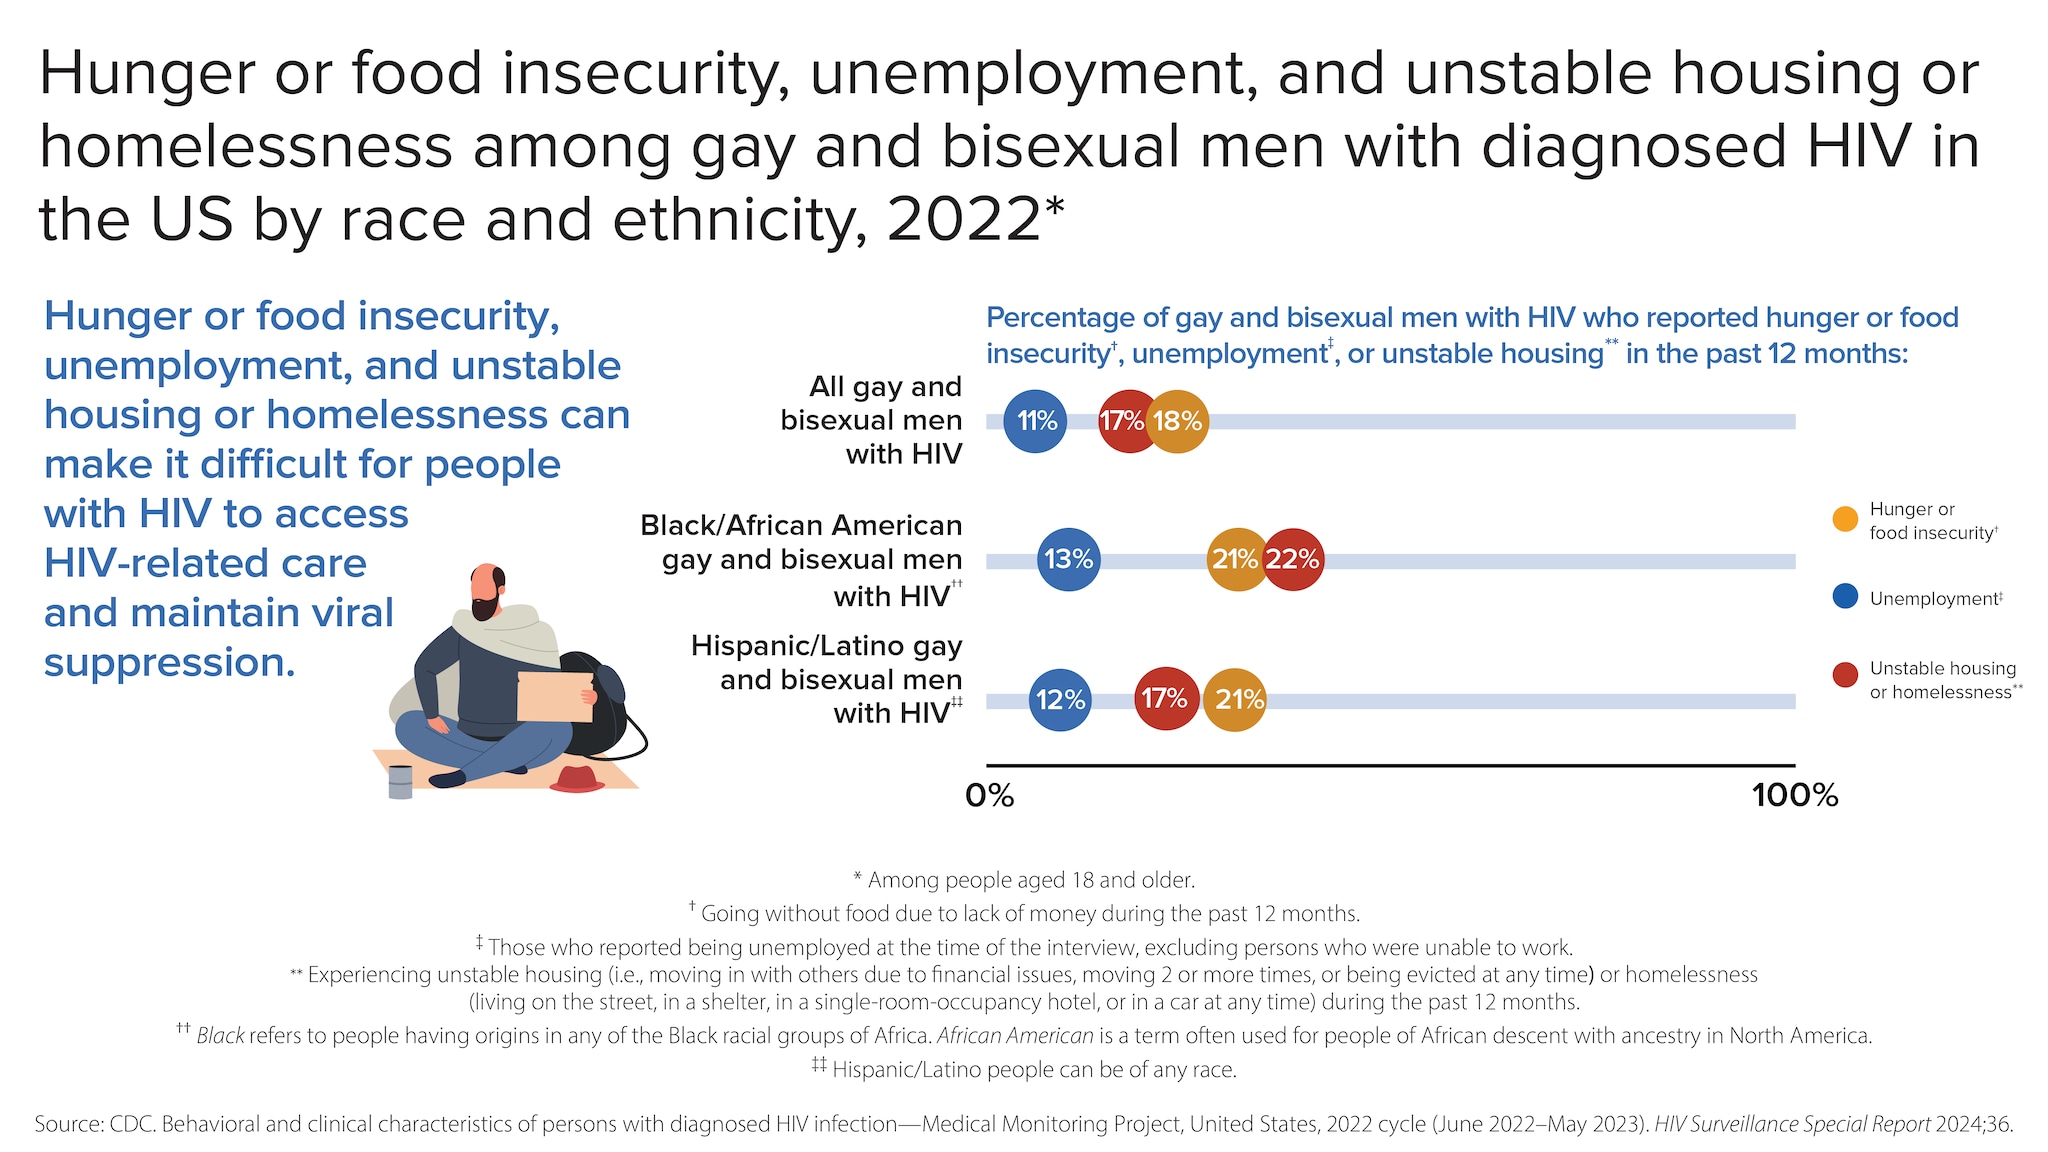
Hunger or food insecurity, unemployment, and unstable housing or homelessness among gay and bisexual men with diagnosed HIV in the US by race and ethnicity, 2022*
Hunger or food insecurity, unemployment, and unstable housing or homelessness can make it difficult for people with HIV to access HIV-related care and maintain viral suppression.
Percentage of gay and bisexual men with HIV who reported hunger or food insecurity†, unemployment‡, or unstable housing** in the past 12 months:
All gay and bisexual men with HIV
- 11% Unemployment
- 17% Unstable housing or homelessness
- 18% Hunger or food insecurity
Black/African American gay and bisexual men with HIV††
- 13% Unemployment
- 21% Hunger or food insecurity
- 22% Unstable housing or homelessness
Hispanic/Latino gay and bisexual men with HIV‡‡
- 12% Unemployment
- 17% Unstable housing or homelessness
- 21% Hunger or food insecurity
*Among people aged 18 and older.
†Going without food due to lack of money during the past 12 months.
‡Those who reported being unemployed at the time of the interview, excluding persons who were unable to work.
**Experiencing unstable housing (i.e., moving in with others due to financial issues, moving 2 or more times, or being evicted at any time) or homelessness (living on the street, in a shelter, in a single-room-occupancy hotel, or in a car at any time) during the past 12 months.
††Black refers to people having origins in any of the Black racial groups of Africa. African American is a term often used for people of African descent with ancestry in North America.
‡‡Hispanic/Latino people can be of any race.
Source: CDC. Behavioral and clinical characteristics of persons with diagnosed HIV infection—Medical Monitoring Project, United States, 2022 cycle (June 2022–May 2023). HIV Surveillance Special Report 2024;36.
What CDC is doing
CDC works every day to maximize the effectiveness of current HIV prevention interventions and strategies. CDC provides research and guidance on effective interventions to reach people in diverse communities, capacity building assistance for those working in HIV prevention and care services, and many other core components of public health, including data collection and reporting, community and partner engagement, and social marketing campaigns to reach people most affected by HIV.
Funding state, territorial, and local health departments is CDC's largest investment in HIV prevention for gay and bisexual men. Some key indicators are as follows:
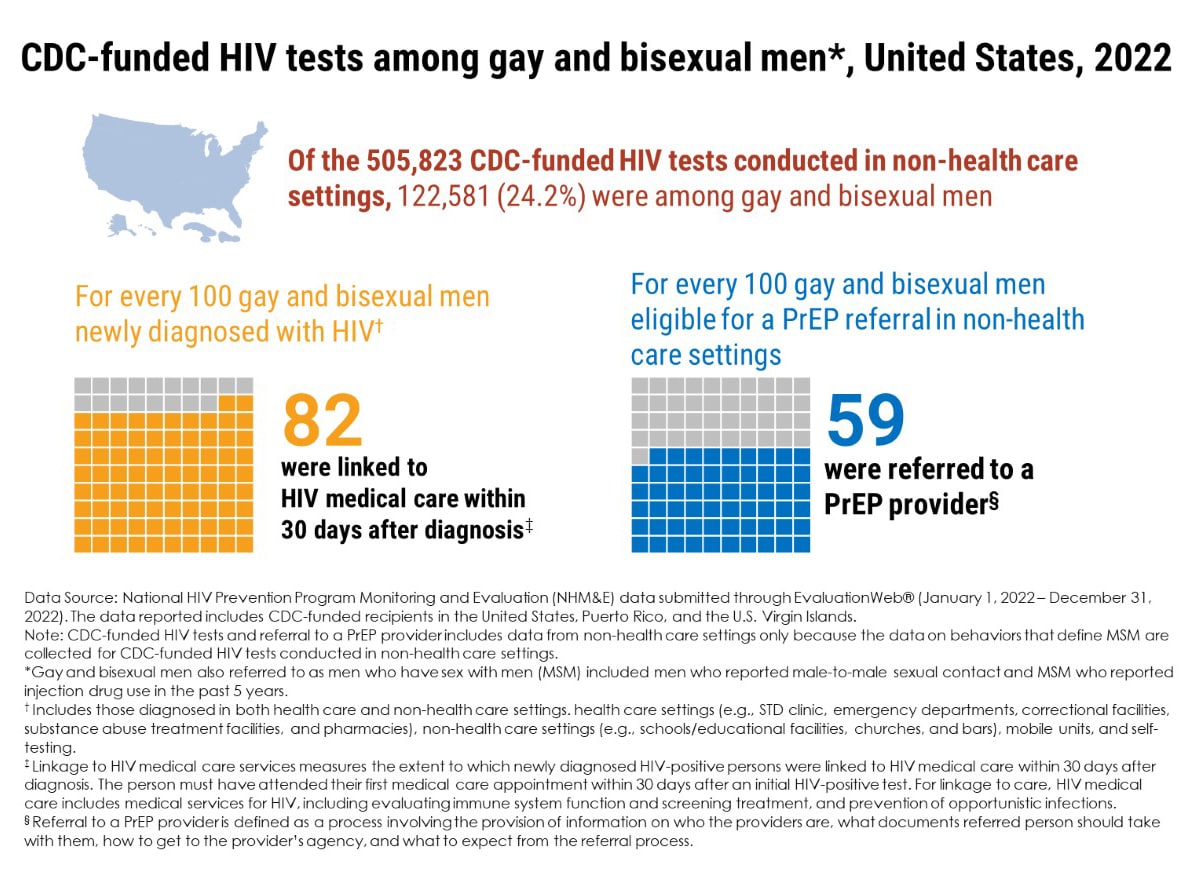
CDC-funded HIV tests among gay and bisexual men*, United States, 2022
Of the 505,823 CDC-funded HIV tests conducted in non-health care settings, 122,581 (24.2%) were among gay and bisexual men.
For every 100 gay and bisexual men newly diagnosed with HIV†82 were linked to HIV medical care within 30 days after diagnosis.‡
For every 100 gay and bisexual men eligible for a PrEP referral in non-health care settings59 were referred to a PrEP provider.§
Data Source: National HIV Prevention Program Monitoring and Evaluation (NHM&E) data submitted through EvaluationWeb® (January 1, 2022 – December 31, 2022). The data reported includes CDC-funded recipients in the United States, Puerto Rico, and the U.S. Virgin Islands.
Note: CDC-funded HIV tests and referral to a PrEP provider includes data from non-health care settings only because the data on behaviors that define MSM are collected for CDC-funded HIV tests conducted in non-health care settings.
*Gay and bisexual men also referred to as men who have sex with men (MSM) included men who reported male-to-male sexual contact and MSM who reported injection drug use in the past 5 years.
†Includes those diagnosed in both health care and non-health care settings. health care settings (e.g., STD clinic, emergency departments, correctional facilities, substance abuse treatment facilities, and pharmacies), non-health care settings (e.g., schools/educational facilities, churches, and bars), mobile units, and self-testing.
‡Linkage to HIV medical care services measures the extent to which newly diagnosed HIV-positive persons were linked to HIV medical care within 30 days after diagnosis. The person must have attended their first medical care appointment within 30 days after an initial HIV-positive test. For linkage to care, HIV medical care includes medical services for HIV, including evaluating immune system function and screening treatment, and prevention of opportunistic infections.
§Referral to a PrEP provider is defined as a process involving the provision of information on who the providers are, what documents referred persons should take with them, how to get to the provider's agency, and what to expect from the referral process.
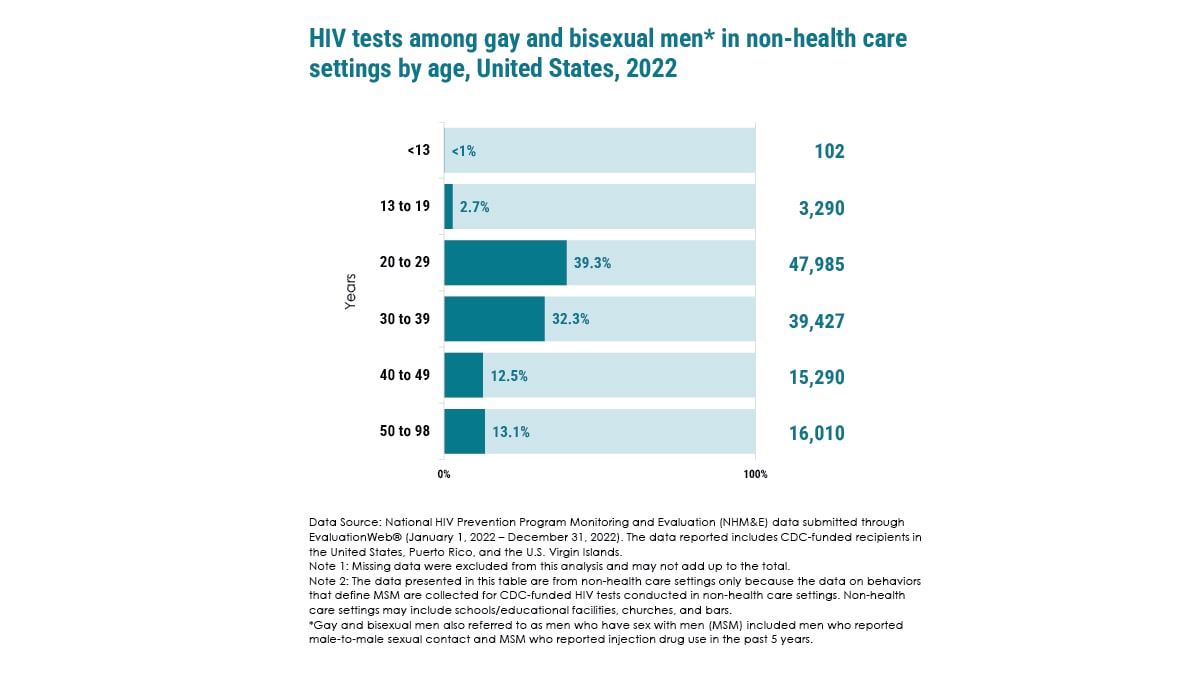
HIV tests among gay and bisexual men* in non-health care settings by age, United States, 2022
Years:<13 | <1% | 102
13 to 19 | 2.7% | 3,290
20 to 29 | 39.3% | 47,985
30 to 39 | 32.3% | 39,427
40 to 49 | 12.5% | 15,290
50 to 98 | 13.1% | 16,010
Data Source: National HIV Prevention Program Monitoring and Evaluation (NHM&E) data submitted through EvaluationWeb® (January 1, 2022 – December 31, 2022). The data reported includes CDC-funded recipients in the United States, Puerto Rico, and the U.S. Virgin Islands.
Note 1: Missing data were excluded from this analysis and may not add up to the total.
Note 2: The data presented in this table are from non-health care settings only because the data on behaviors that define MSM are collected for CDC-funded HIV tests conducted in non-health care settings. Non-health care settings may include schools/educational facilities, churches, and bars.
*Gay and bisexual men also referred to as men who have sex with men (MSM) included men who reported male-to-male sexual contact and MSM who reported injection drug use in the past 5 years.

HIV tests among gay and bisexual men* in non-health care settings by race and ethnicity, United States, 2022
- Black or African American Persons: 26.4% - 31,696
- White Persons: 32.1% - 38,451
- Hispanic or Latino Persons†: 34.0% - 40,800
- Other‡: 7.5% - 9,001
Data Source: National HIV Prevention Program Monitoring and Evaluation (NHM&E) data submitted through EvaluationWeb® (January 1, 2022 – December 31, 2022). The data reported includes CDC-funded recipients in the United States, Puerto Rico, and the U.S. Virgin Islands.
Note 1: Missing data were excluded from this analysis and may not add up to the total.
Note 2: The data presented in this table are from non-health care settings only because the data on behaviors that define MSM are collected for CDC-funded HIV tests conducted in non-health care settings. Non-health care settings may include schools/educational facilities, churches, and bars.
*Gay and bisexual men also referred to as men who have sex with men (MSM) included men who reported male-to-male sexual contact and MSM who reported injection drug use in the past 5 years.
† Hispanic or Latino Persons can be of any race
‡ Other race/ethnicity includes Asian, Native Hawaiian or Pacific Islander, American Indian and Alaska Native, or persons reporting multiple races.
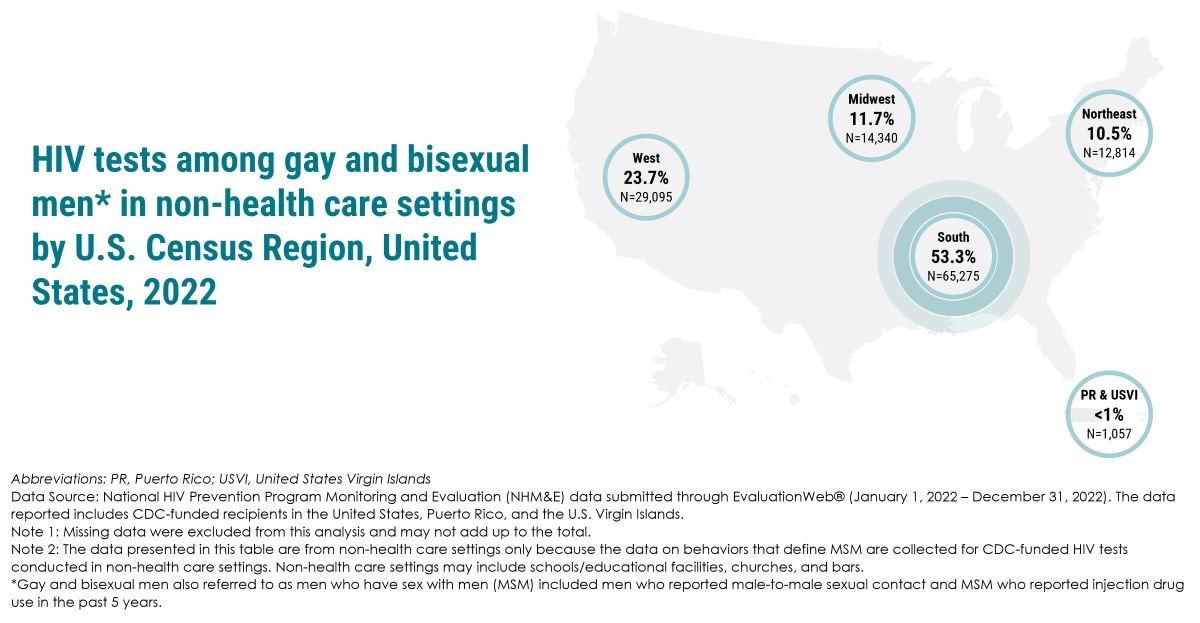
HIV tests among gay and bisexual men* in non-health care settings by U.S. Census Region, United States, 2022
West - 23.7% N=29,095
Midwest - 11.7% N=14,340
Northeast - 10.5% N=12,814
South - 53.3% N=65,275
PR & USVI - <1% =1,057
Abbreviations: PR, Puerto Rico; USVI, United States Virgin Islands
Data Source: National HIV Prevention Program Monitoring and Evaluation (NHM&E) data submitted through EvaluationWeb® (January 1, 2022 – December 31, 2022). The data reported includes CDC-funded recipients in the United States, Puerto Rico, and the U.S. Virgin Islands.
Note 1: Missing data were excluded from this analysis and may not add up to the total.
Note 2: The data presented in this table are from non-health care settings only because the data on behaviors that define MSM are collected for CDC-funded HIV tests conducted in non-health care settings. Non-health care settings may include schools/educational facilities, churches, and bars.
*Gay and bisexual men also referred to as men who have sex with men (MSM) included men who reported male-to-male sexual contact and MSM who reported injection drug use in the past 5 years.
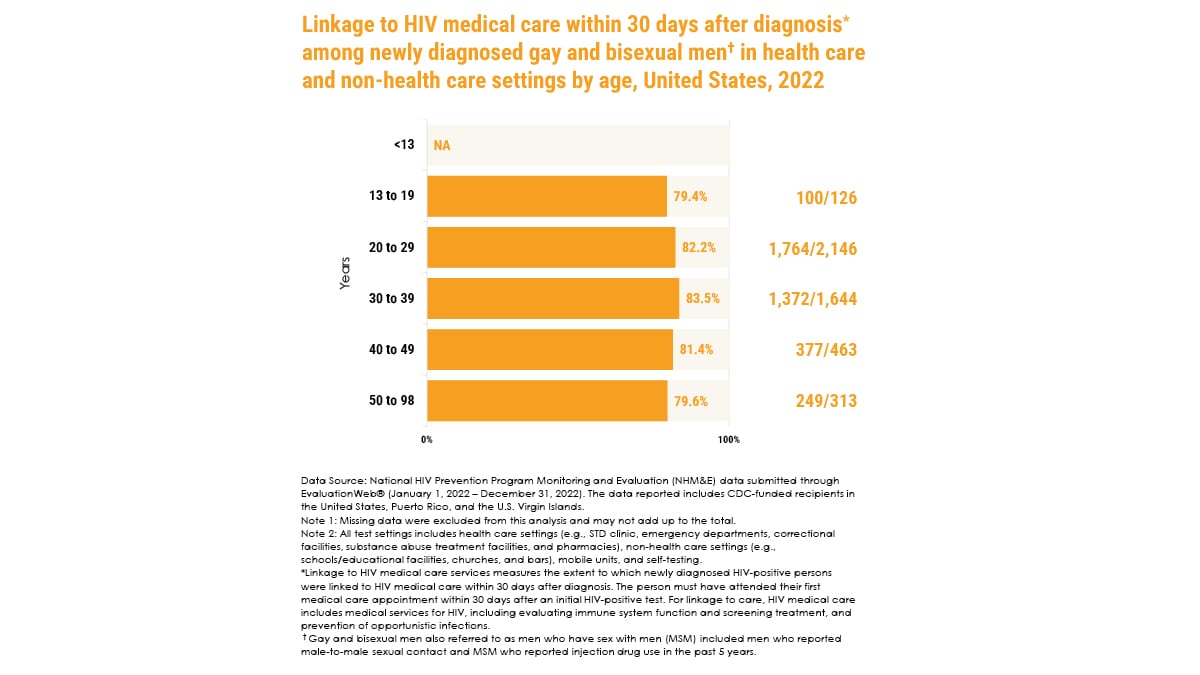
Linkage to HIV medical care within 30 days after diagnosis* among newly diagnosed gay and bisexual men† in health care and non-health care settings by age, United States, 2022
Years Percentage
<13 NA
13 to 19 79.4% (100/126)
20 to 29 82.2% (1,764/2,146)
30 to 39 83.5% (1,372/1,644)
40 to 49 81.4% (377/463)
50 to 98 79.6% (249/313)
Data Source: National HIV Prevention Program Monitoring and Evaluation (NHM&E) data submitted through EvaluationWeb® (January 1, 2022 – December 31, 2022). The data reported includes CDC-funded recipients in the United States, Puerto Rico, and the U.S. Virgin Islands.
Note 1: Missing data were excluded from this analysis and may not add up to the total.
Note 2: All test settings includes health care settings (e.g., STD clinic, emergency departments, correctional facilities, substance abuse treatment facilities, and pharmacies), non-health care settings (e.g., schools/educational facilities, churches, and bars), mobile units, and self-testing.
*Linkage to HIV medical care services measures the extent to which newly diagnosed HIV-positive persons were linked to HIV medical care within 30 days after diagnosis. The person must have attended their first medical care appointment within 30 days after an initial HIV-positive test. For linkage to care, HIV medical care includes medical services for HIV, including evaluating immune function and screening treatment, and prevention of opportunistic infections.
†Gay and bisexual men also referred to as men who have sex with men (MSM) included men who reported male-to-male sexual contact and MSM who reported injection drug use in the past 5 years.
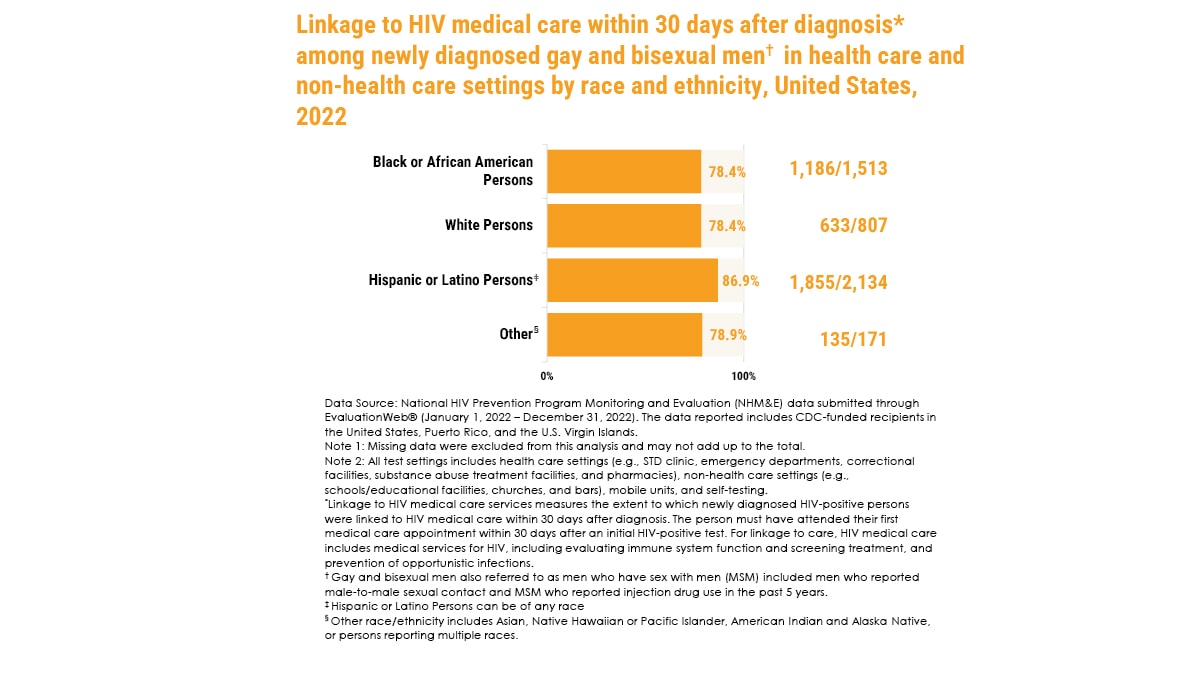
Linkage to HIV medical care within 30 days after diagnosis* among newly diagnosed gay and bisexual men† in health care and non-health care settings by race and ethnicity, United States, 2022
Black or African American Persons - 78.4% (1,186/1,513)
White Persons - 78.4% (633/807)
Hispanic or Latino Persons‡ - 86.9% (1,855/2,134)
Other§ - 78.9% (135/171)
Data Source: National HIV Prevention Program Monitoring and Evaluation (NHM&E) data submitted through EvaluationWeb® (January 1, 2022 – December 31, 2022). The data reported includes CDC-funded recipients in the United States, Puerto Rico, and the U.S. Virgin Islands.
Note 1: Missing data were excluded from this analysis and may not add up to the total.
Note 2: All test settings includes health care settings (e.g., STD clinic, emergency departments, correctional facilities, substance abuse treatment facilities, and pharmacies), non-health care settings (e.g., schools/educational facilities, churches, and bars), mobile units, and self-testing.
*Linkage to HIV medical care services measures the extent to which newly diagnosed HIV-positive persons were linked to HIV medical care within 30 days after diagnosis. The person must have attended their first medical care appointment within 30 days after an initial HIV-positive test. For linkage to care, HIV medical care includes medical services for HIV, including evaluating immune system function and screening treatment, and prevention of opportunistic infections.
† Gay and bisexual men also referred to as men who have sex with men (MSM) included men who reported male-to-male sexual contact and MSM who reported injection drug use in the past 5 years.
‡ Hispanic or Latino Persons can be of any race§ Other race/ethnicity includes Asian, Native Hawaiian or Pacific Islander, American Indian and Alaska Native, or persons reporting multiple races.
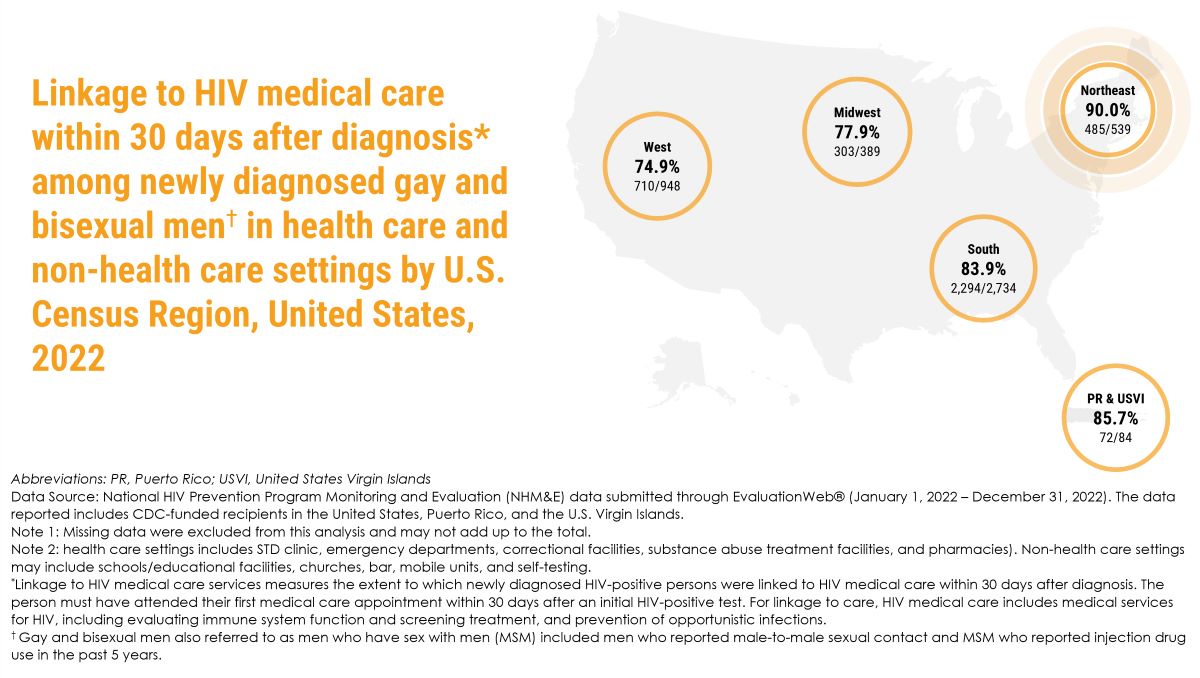
Linkage to HIV medical care within 30 days after diagnosis* among newly diagnosed gay and bisexual men† in health care and non-health care settings by U.S. Census Region, United States, 2022
West - 74.9% (710/948)
Midwest - 77.9% (303/389)
Northeast - 90.0% (485/539)
South - 83.9% (2,294/2,734)
PR & USVI - 85.7% (72/84)
Abbreviations: PR, Puerto Rico; USVI, United States Virgin Islands
Data Source: National HIV Prevention Program Monitoring and Evaluation (NHM&E) data submitted through EvaluationWeb® (January 1, 2022 – December 31, 2022). The data reported includes CDC-funded recipients in the United States, Puerto Rico, and the U.S. Virgin Islands.
Note 1: Missing data were excluded from this analysis and may not add up to the total.
Note 2: health care settings include STD clinic, emergency departments, correctional facilities, substance abuse treatment facilities, and pharmacies). Non-health care settings may include schools/educational facilities, churches, bar, mobile units, and self-testing.
*Linkage to HIV medical care services measures the extent to which newly diagnosed HIV-positive persons were linked to HIV medical care within 30 days after diagnosis. The person must have attended their first medical care appointment within 30 days after an initial HIV-positive test. For linkage to care, HIV medical care includes medical services for HIV, including evaluating immune system function and screening treatment, and prevention of opportunistic infections.
† Gay and bisexual men also referred to as men who have sex with men (MSM) included men who reported male-to-male sexual contact and MSM who reported injection drug use in the past 5 years.
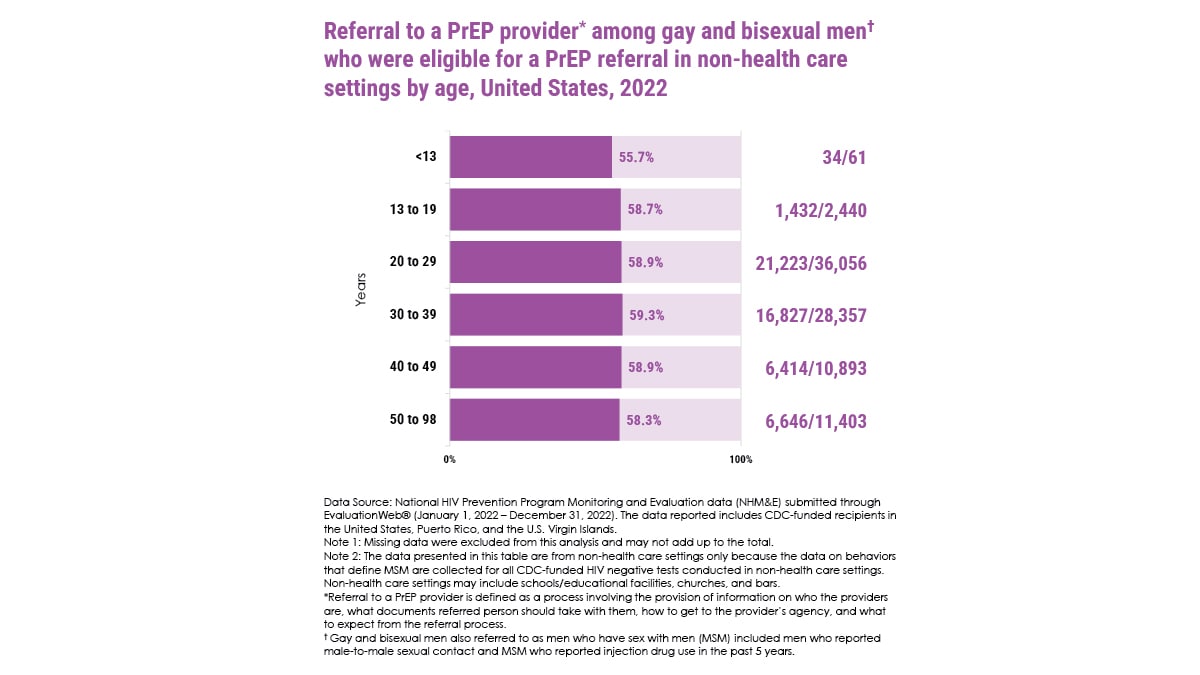
Referral to a PrEP provider* among gay and bisexual men† who were eligible for a PrEP referral in non-health care settings by age, United States, 2022
<13 - 55.7% (34/61)
13 to 19 - 58.7% (1,432/2,440)
20 to 29 - 58.9% (21,223/36,056)
30 to 39 - 59.3% (16,827/28,357)
40 to 49 - 58.9% (6,414/10,893)
50 to 98 - 58.3% (6,646/11,403)
Data Source: National HIV Prevention Program Monitoring and Evaluation data (NHM&E) submitted through EvaluationWeb® (January 1, 2022 - December 31, 2022). The data reported includes CDC-funded recipients in the United States, Puerto Rico, and the U.S. Virgin Islands.
Note 1: Missing data were excluded from this analysis and may not add up to the total.
Note 2: The data presented in this table are from non-health care settings only because the data on behaviors that define MSM are collected for all CDC-funded HIV negative tests conducted in non-health care settings. Non-health care settings may include schools/educational facilities, churches, and bars.
*Referral to a PrEP provider is defined as a process involving the provision of information on who the providers are, what documents referred person should take with them, how to get to the provider's agency, and what to expect from the referral process.
† Gay and bisexual men also referred to as men who have sex with men (MSM) included men who reported male-to-male sexual contact and MSM who reported injection drug use in the past 5 years.
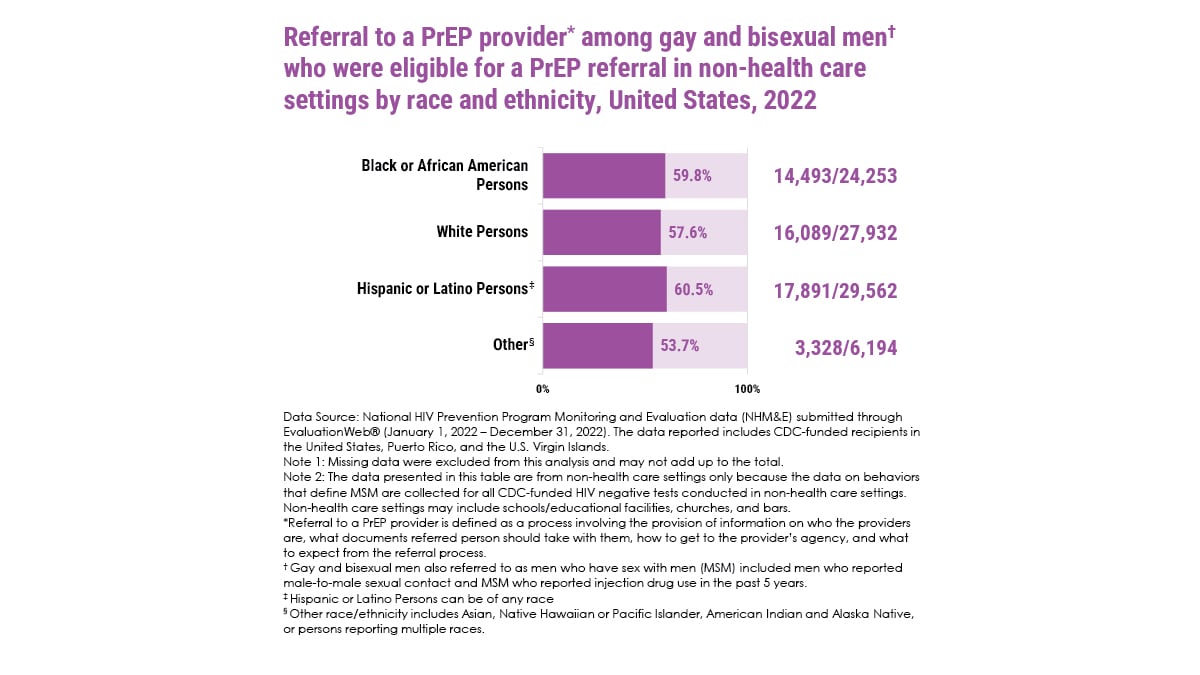
Referral to a PrEP provider* among gay and bisexual men† who were eligible for a PrEP referral in non-health care settings by race and ethnicity, United States, 2022
Black or African American Persons - 59.8% (14,493/24,253)
White Persons - 57.6% (16,089/27,932)
Hispanic or Latino Persons‡ - 60.5% (17,891/29,562)
Other§ - 53.7% (3,328/6,194)
Data Source: National HIV Prevention Program Monitoring and Evaluation data (NHM&E) submitted through EvaluationWeb® (January 1, 2022 – December 31, 2022). The data reported includes CDC-funded recipients in the United States, Puerto Rico, and the U.S. Virgin Islands.
Note 1: Missing data were excluded from this analysis and may not add up to the total.
Note 2: The data presented in this table are from non-health care settings only because the data on behaviors that define MSM are collected for all CDC-funded HIV negative tests conducted in non-health care settings. Non-health care settings may include schools/educational facilities, churches, and bars.
*Referral to a PrEP provider is defined as a process involving the provision of information on who the providers are, what documents referred persons should take with them, how to get to the provider's agency, and what to expect from the referral process.
† Gay and bisexual men also referred to as men who have sex with men (MSM) included men who reported male-to-male sexual contact and MSM who reported injection drug use in the past 5 years.
‡ Hispanic or Latino Persons can be of any race
§ Other race/ethnicity includes Asian, Native Hawaiian or Pacific Islander, American Indian and Alaska Native, or persons reporting multiple races.
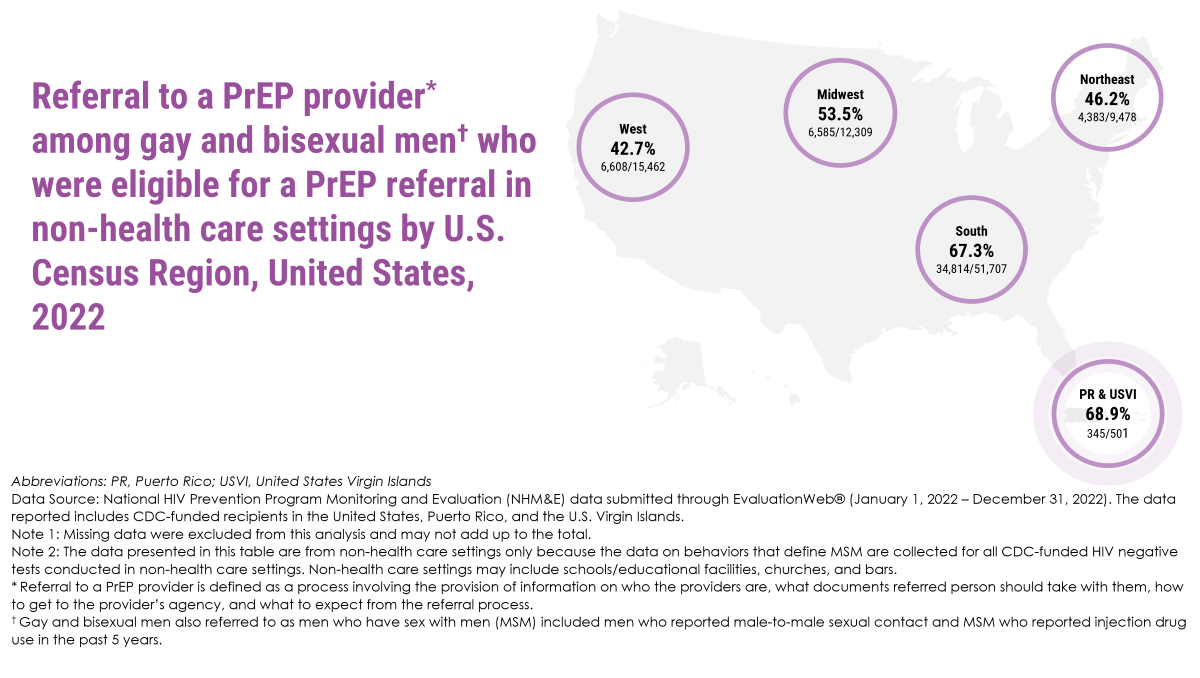
Referral to a PrEP provider* among gay and bisexual men† who were eligible for a PrEP referral in non-health care settings by U.S. Census Region, United States, 2022
West - 42.7% (6,608/15,462)
Midwest - 53.5% (6,585/12,309)
Northeast - 46.2% (4,383/9,478)
South - 67.3% (34,814/51,707)
PR & USVI - 68.9% (345/501)
Abbreviations: PR, Puerto Rico; USVI, United States Virgin Islands
Data Source: National HIV Prevention Program Monitoring and Evaluation (NHM&E) data submitted through EvaluationWeb® (January 1, 2022 – December 31, 2022). The data reported includes CDC-funded recipients in the United States, Puerto Rico, and the U.S. Virgin Islands.
Note 1: Missing data were excluded from this analysis and may not add up to the total.
Note 2: The data presented in this table are from non-health care settings only because the data on behaviors that define MSM are collected for all CDC-funded HIV negative tests conducted in non-health care settings. Non-health care settings may include schools/educational facilities, churches, and bars.
*Referral to a PrEP provider is defined as a process involving the provision of information on who the providers are, what documents referred person should take with them, how to get to the provider's agency, and what to expect from the referral process.
† Gay and bisexual men also referred to as men who have sex with men (MSM) included men who reported male-to-male sexual contact and MSM who reported injection drug use in the past 5 years.
- CDC. Estimated HIV incidence and prevalence in the United States, 2018–2022.HIV Surveillance Supplemental Report 2024;29(1).
- CDC. Diagnoses, deaths, and prevalence of HIV in the United States and 6 territories and freely associated states, 2022.HIV Surveillance Report 2024;35.
- CDC. Behavioral and clinical characteristics of persons with diagnosed HIV infection—Medical Monitoring Project, United States 2022 cycle (June 2022–May 2023). HIV Surveillance Special Report 2024;36.
- CDC. Monitoring selected national HIV prevention and care objectives by using HIV surveillance data—United States and 6 territories and freely associated states, 2022.HIV Surveillance Supplemental Report 2024;29(2).
- CDC. HIV infection risk, prevention, and testing behaviors among men who have sex with men—National HIV Behavioral Surveillance, 19 U.S. cities, 2023. HIV Surveillance Supplemental Report 2024;37.
- CDC. National HIV Prevention Program Monitoring and Evaluation data from EvaluationWeb® (January 1, 2022 – December 31, 2022, as of September 15, 2023
