At a glance
FoodNet Fast's Diagnostic Laboratory Practices Tool lets you find out how testing practices of about 700 diagnostic laboratories in FoodNet's surveillance area have changed over time for 10 pathogens transmitted commonly through food: Campylobacter, Cryptosporidium*, Cyclospora, Listeria, norovirus, Salmonella, Shiga toxin-producing E. coli (STEC), Shigella, Vibrio, and Yersinia.

Information about the data
This tool includes the following information:
- Types of specimens most commonly submitted to labs
- Detection methods most often used, including culture and culture-independent diagnostic tests (CIDTs)
- Reflex culture practices by pathogen, year, and geographic area in FoodNet's surveillance area
*As of January 1, 2018, FoodNet no longer collects information on laboratory practices for Cryptosporidium.
The data in FoodNet Fast come from diagnostic laboratories that serve FoodNet’s surveillance area. These include hospital, outpatient, and reference laboratories.
Each year, FoodNet sites contact diagnostic laboratories to collect data on testing practices. FoodNet sites also collect additional data throughout the year. Sites submit this data annually to an online database maintained at CDC.
FoodNet collects these data to better understand how changes in diagnostic practices affect:
- Data reported through active surveillance
- Surveillance functions, such as case investigation, assessment of trends in illness, and outbreak detection
FoodNet sites collect and review the data throughout the year. After sites send data to CDC, CDC reviews data received for missing information and works with the sites to correct any errors. CDC updates the tool after finalizing the data for a given year.
Using the Diagnostic Laboratory Practices Tool
A detection method is a way of diagnosing infections. Detection methods can be traditional or non-traditional.
- Traditional methods include culture for bacteria and microscopy for parasites.
- Non-traditional methods include culture-independent diagnostic tests (CIDTs) that target specific antigens or nucleic acids.
Culture following a detection by CIDT is when a specimen is tested using a laboratory method called microbiological culture after a positive CIDT result. This practice is often used to confirm CIDT results and to provide information not available using a CIDT alone. This information is vital to monitoring disease trends and answering important questions, such as
- Is the organism a particularly virulent strain?
- Is a particular antibiotic a good choice for treatment?
- Has this particular strain recently been found in others who are sick, suggesting a common source?
The main reasons for this practice are diagnostic laboratory testing limitations and public health practice.
For many infections, it's important to obtain additional information on the organism causing illness. This information includes subtype, antimicrobial resistance, and gene sequence, which helps in outbreak detection. Yet, diagnostic laboratories often perform only limited testing based on what the clinician orders.
When public health laboratories receive specimens from diagnostic laboratories, they can perform additional tests necessary for public health practice, including surveillance and outbreak response. For these reasons, most states have regulations requiring diagnostic laboratories to forward specimens to public health laboratories. However, these regulations are not standardized across all states.
Diagnostic laboratories use various types of CIDTs. Within this tool, the types have been classified into four categories: immunoassay, syndromic panel polymerase chain reaction (PCR), laboratory-developed PCR, and immunoassay plus any PCR.
- An immunoassay test uses enzymes linked to an antibody or antigen as a marker for the detection of a specific protein in a specimen.
- A polymerase chain reaction (PCR) test targets nucleic acid sequences, and a syndromic panel PCR test targets several nucleic acid sequences simultaneously.
- A laboratory-developed PCR is a diagnostic PCR test developed and used by a single laboratory.
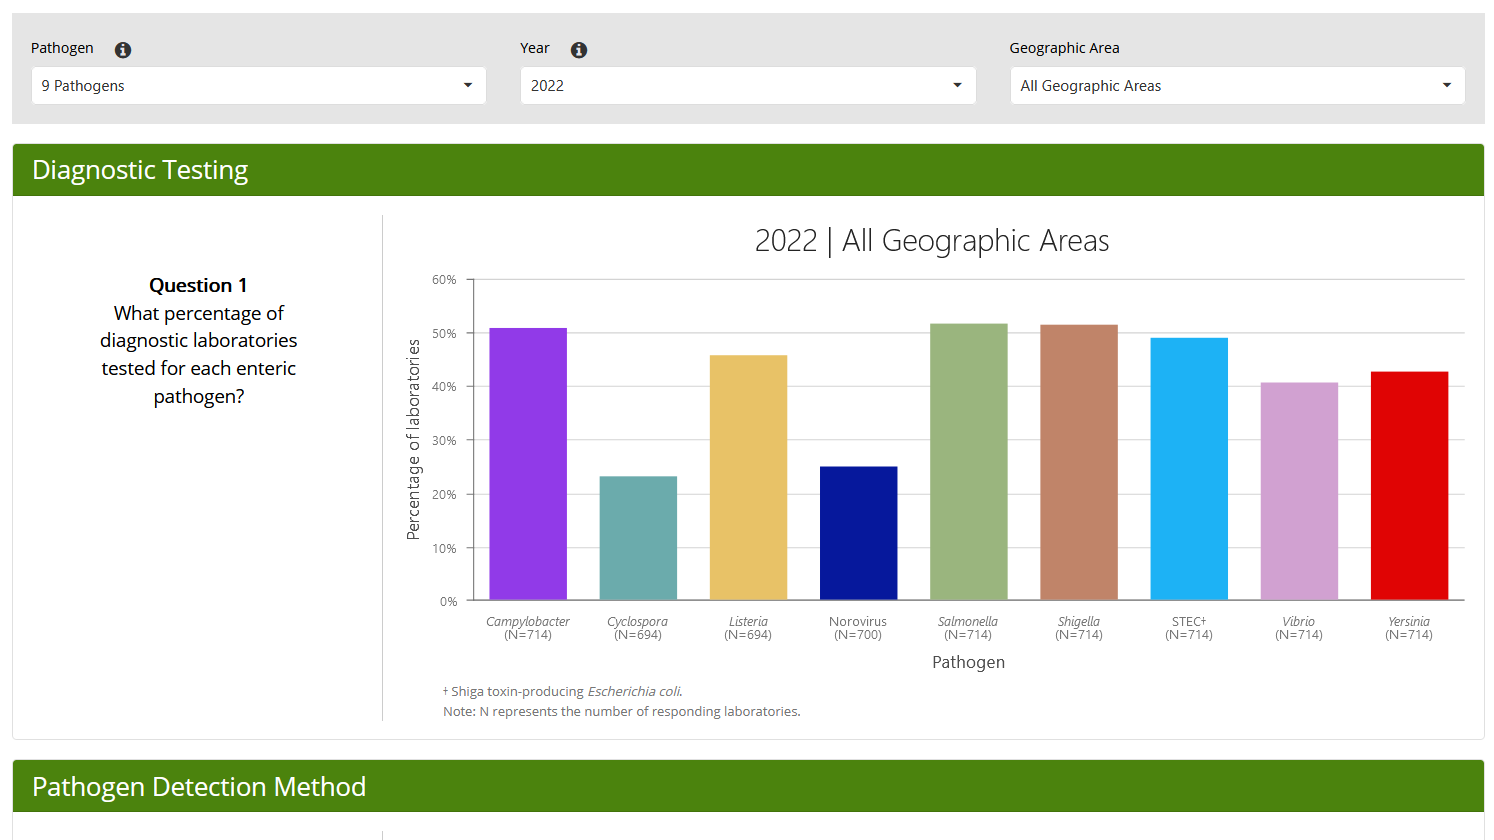
The tool’s graphs display quantities as percentages. If you hover over a data point on a graph, the numerator and denominator used to calculate the percentage are displayed.
For example, in Question 1, the numerator indicates the number of laboratories that test for each pathogen, and the denominator indicates the total number of laboratories that provided information, equal to the sum of laboratories that do and do not test for each pathogen. The total number of laboratories surveyed is also displayed below each pathogen.
