What to know
Interpretation of forecasts
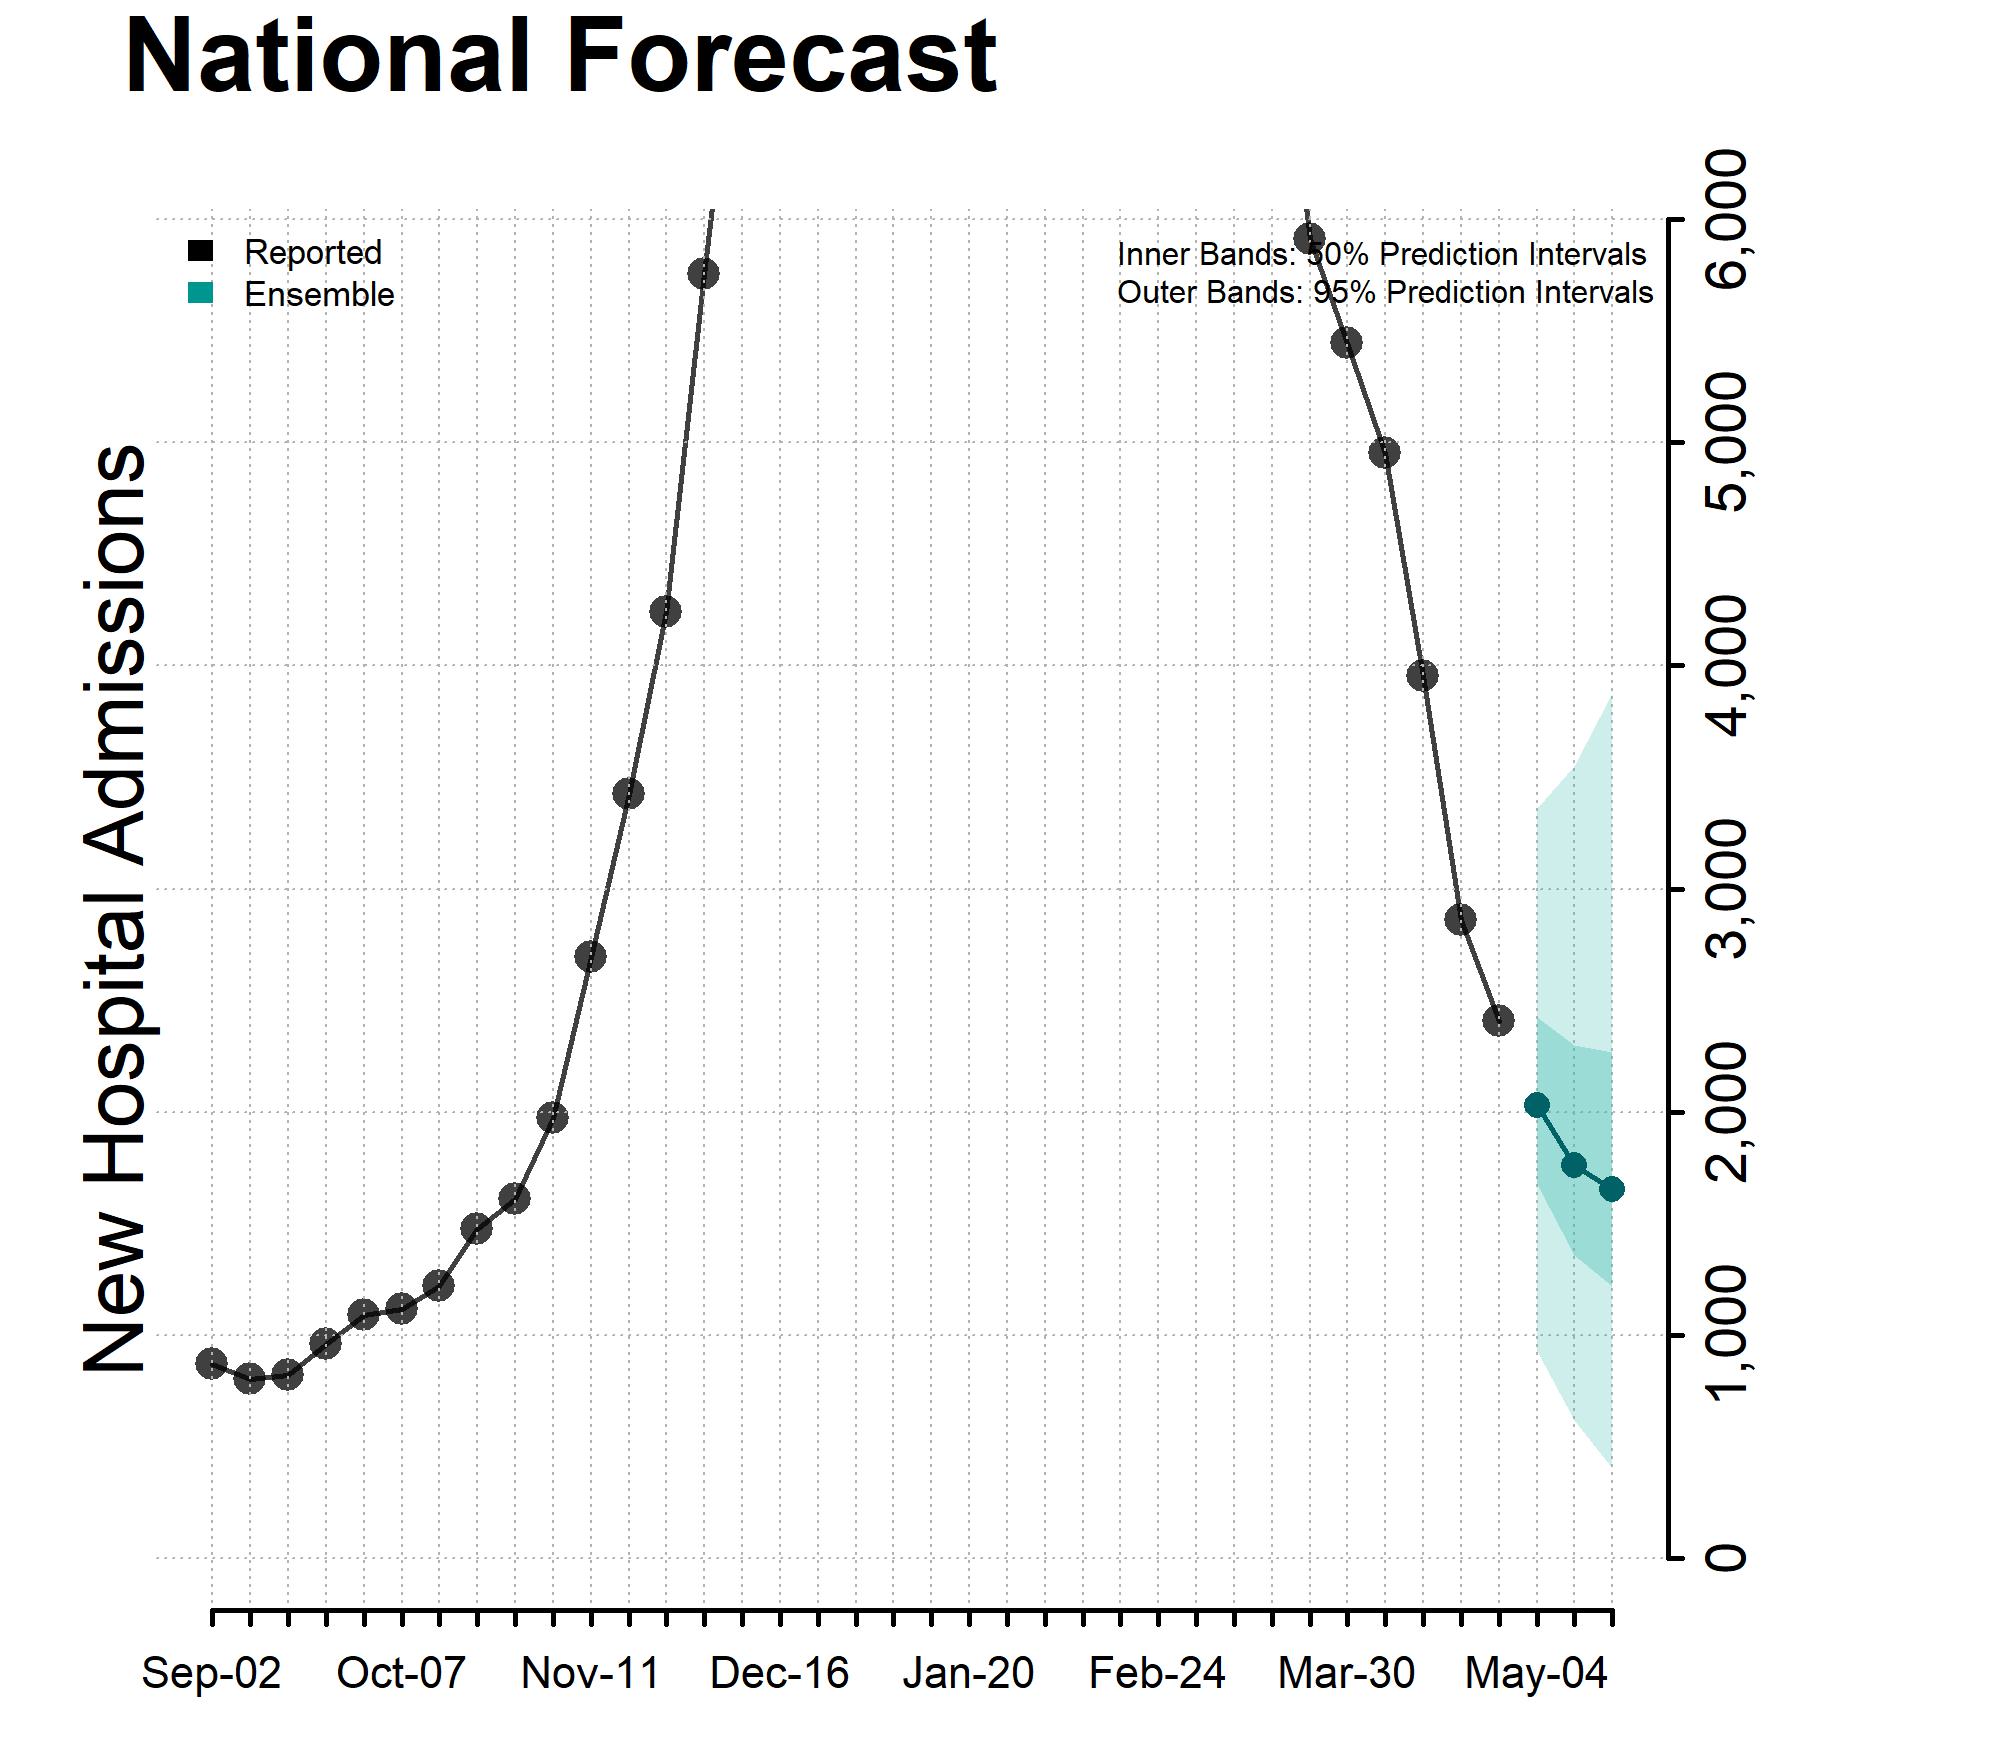
- Reported and forecasted new influenza hospital admissions as of May 1, 2024.
- This week, 24 modeling groups contributed 28 forecasts that were eligible for inclusion in the ensemble forecasts for at least one jurisdiction. Contributing teams are listed below.
- Ensemble forecasts combine forecasts from diverse models into one forecast. They have been among the most reliable forecasts in performance for previous influenza and COVID-19 forecasting efforts, but even the ensemble forecasts may not reliably predict rapid changes.
- The figure shows the number of new laboratory confirmed influenza hospital admissions reported in the United States each week from September 1 through April 27 and forecasted new influenza hospital admissions per week for this week and the next 2 weeks, through May 18. Hospitals are required to report daily laboratory-confirmed influenza hospitalizations to the National Healthcare Safety Network (NHSN). Review COVID-19 Guidance for Hospital Reporting and FAQs [658 KB, 52 pages] for additional details on this guidance.

State Forecasts
State-level forecasts show the predicted number of new laboratory confirmed influenza hospital admissions per week for this week and the next 2 weeks by state. Each state forecast figure uses a different scale due to differences in the number of new influenza hospital admissions per week between states and only forecasts included in the ensemble are shown. Plots of the state-level ensemble forecasts and the underlying data can be downloaded below.
Additional forecast data and information about submitting forecasts are available.
