At a glance
In addition to the robust data searchable on our Data Explorer tool, the Tracking Program has developed several topic-specific dashboards to put information into the hands of public health planners, the media, and the public. These interactive data tools provide a more complete, detailed picture of important environmental health topics all in one place. View our “Powered by Tracking” dashboards and learn more about important issues that affect environmental health below.
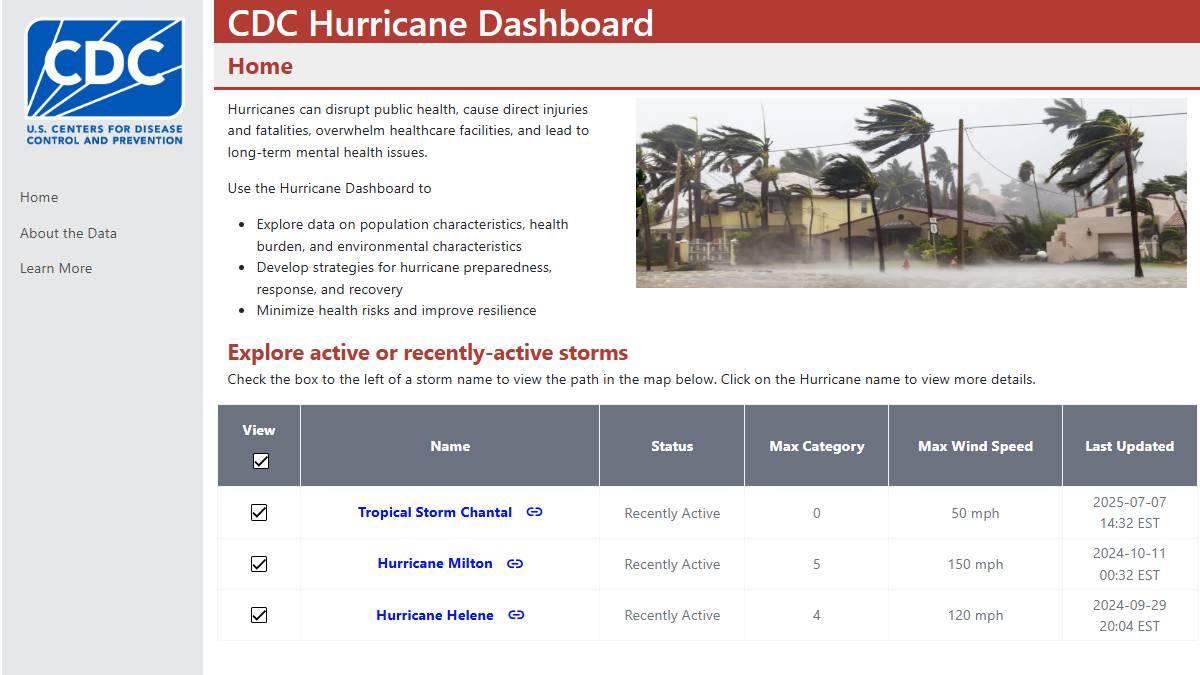
CDC Hurricane Dashboard
CDC's Environmental Public Health Tracking Program (Tracking), in partnership with CDC's Geospatial Research, Analysis, and Services Program (GRASP), have created the all-new CDC Hurricane Dashboard, a pre- and post- hurricane event tracking tool. This tool is a resource for preparedness and response planning and offers a wide variety of information in one place. CDC's new Hurricane Dashboard allows users to:
- identify and track active and recently active hurricanes and tropical storms,
- investigate geographies and populations of at-risk or affected areas using Tracking's robust data,
- add relevant points-of-interest layers to maps including nursing homes, pharmacies, and wastewater treatment plants, among others,
- and track real-time power outages.
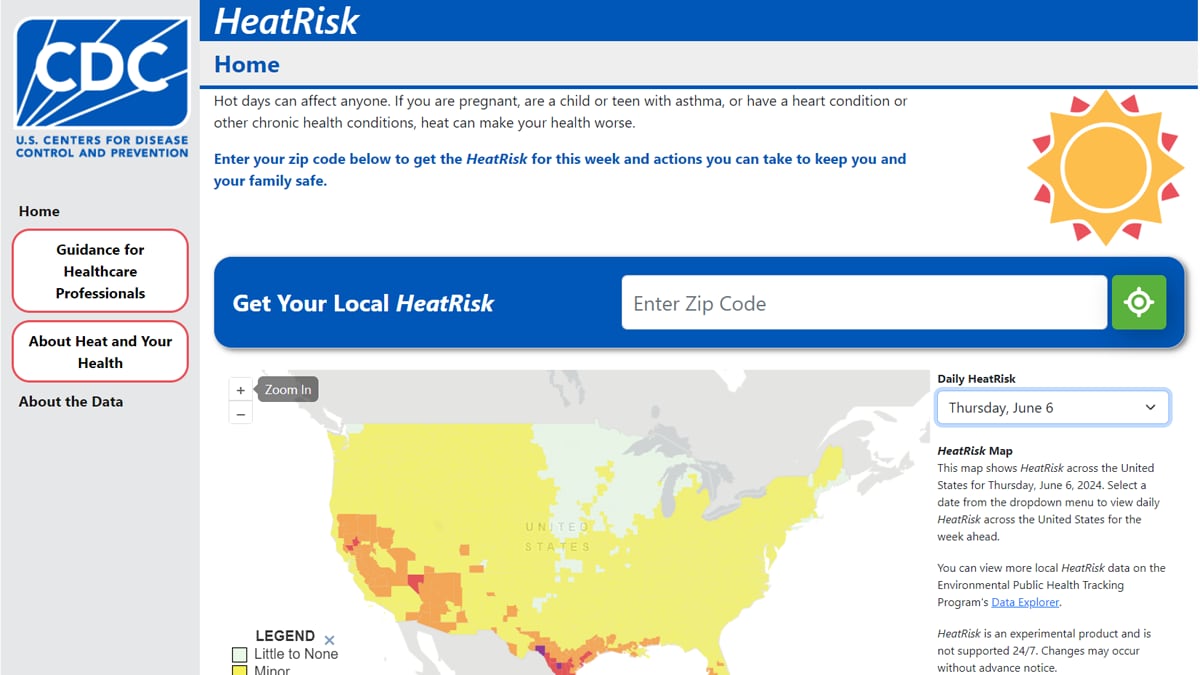
HeatRisk Dashboard
CDC's HeatRisk Dashboard, developed by CDC in partnership with the National Oceanic and Atmospheric Administration (NOAA), allows people to access important heat and health information in an easy-to-use, intuitive, mobile-friendly interface. Pulling in data from the HeatRisk Forecast Tool, in the Dashboard people can enter their zip code and get personalized heat forecast information for their location alongside protective actions to take. The HeatRisk Dashboard is further supported by the U.S. Environmental Protection Agency’s AIR NOW Air Quality Index, which provides information on local air quality, specifically the presence of pollutants in the air. The Dashboard provides important heat and health information right alongside CDC’s new clinical guidance materials for people at higher risk from heat-related health effects who may need to take more protective actions.
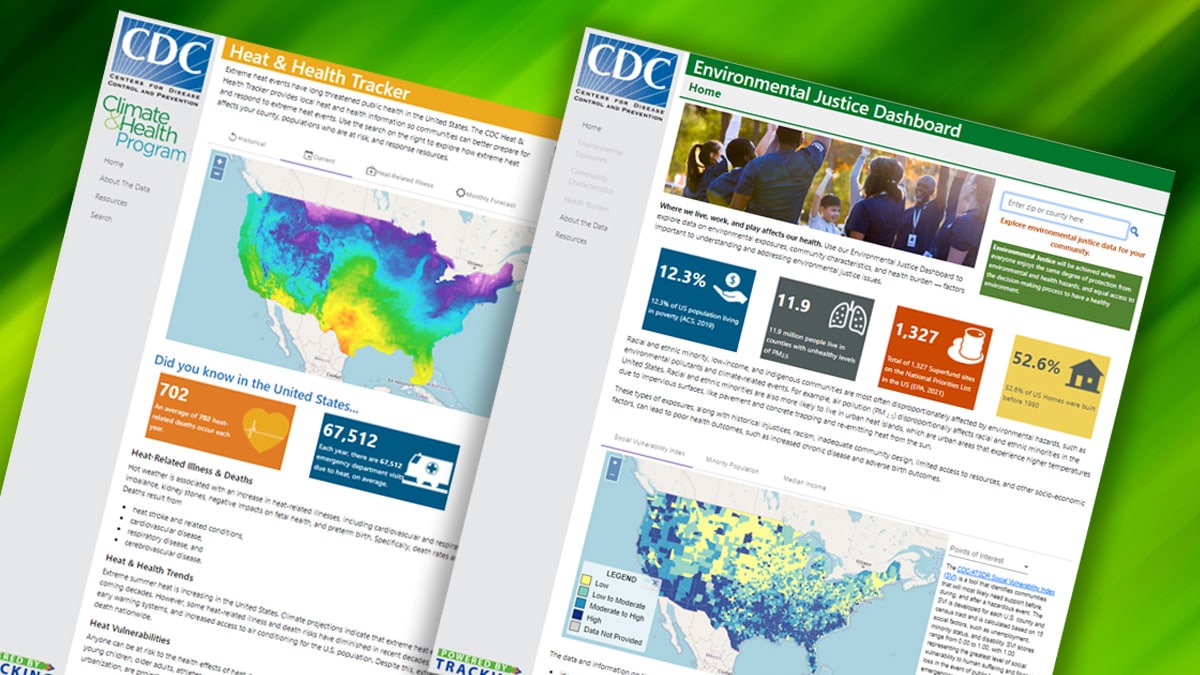
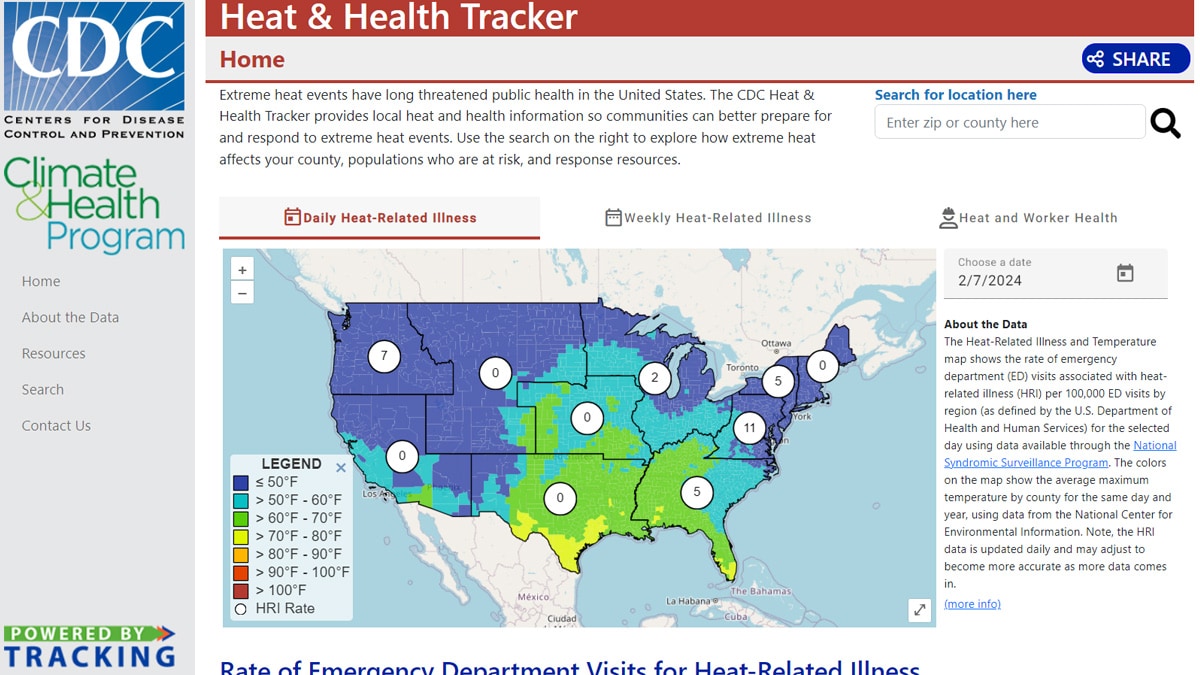
Heat & Health Tracker
The Tracking Program partnered with CDC's Climate & Health Program to develop the Heat and Health Tracker. This tool allows you to see how extreme heat affects your county. View local, timely data and info to help communities to prepare for and respond to extreme heat events. Search to explore your county, populations who are at risk, and response resources.
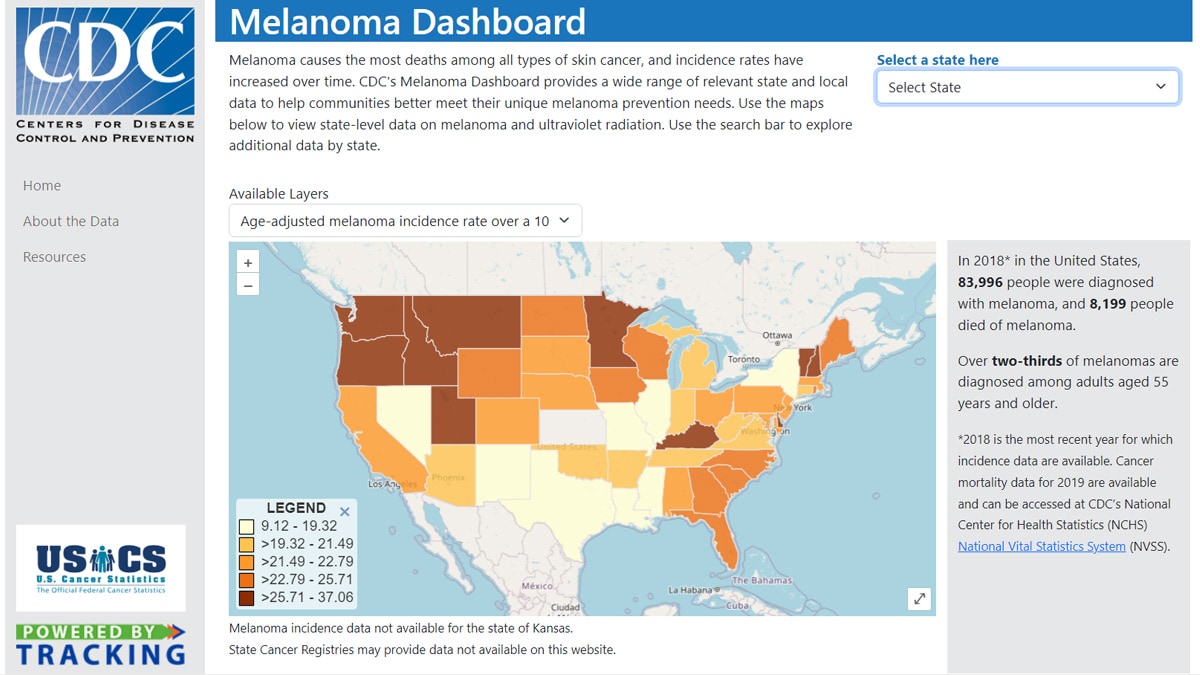
Melanoma Dashboard
The Melanoma Dashboard was created through a partnership between the Tracking Program and CDC's Division of Cancer Prevention and Control. It provides a wide range of relevant state and local data to help communities address their unique melanoma prevention needs. Get quick facts and information or use maps to view state-level data on melanoma and ultraviolet radiation.
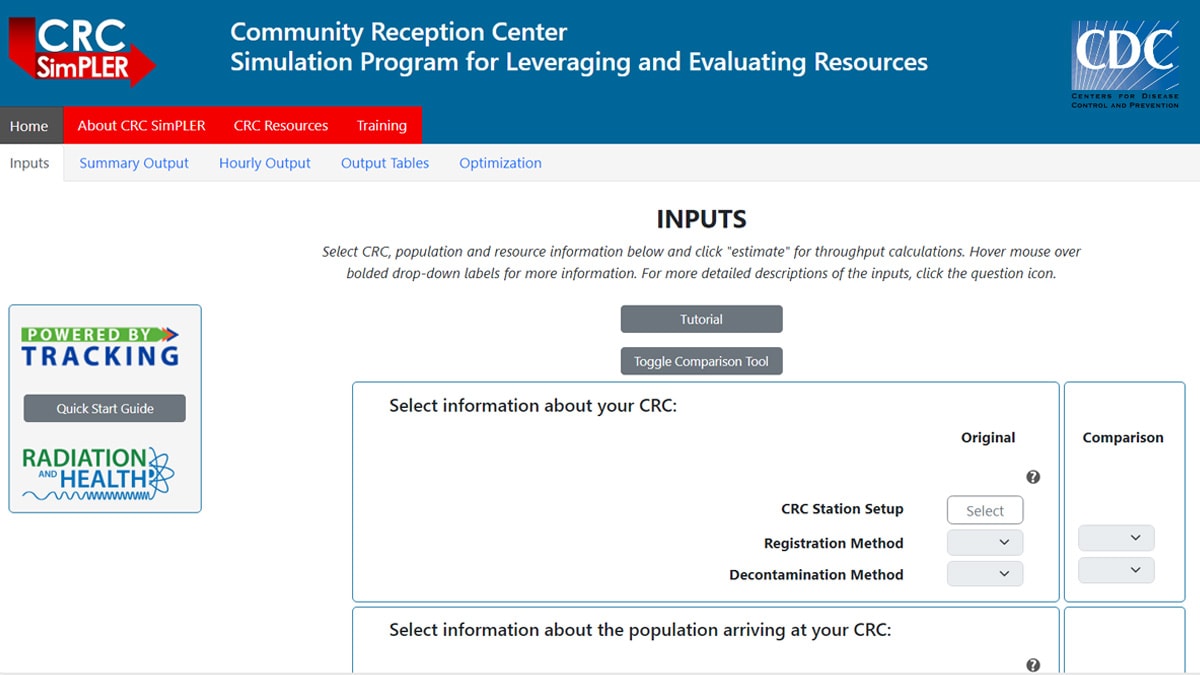
CRC SimPLER
CRC SimPLER: "Community Reception Center Simulation Program for Leveraging and Evaluating Resources."
It is a free online tool for emergency planners. They can use CRC SimPLER when planning for population monitoring during response to a radiation emergency. This tool helps them understand current capacity, potential bottlenecks, and additional resource needs. The Tracking Program created it in partnership with CDC's Radiation and Health Program.