At a glance

Supplementary Table 1
Vaccination coverage estimates for bridging cohort,* National Immunization Survey-Child, United States, 2017-2018
| Children Born January 2015 through May 2016 | ||||||||
|---|---|---|---|---|---|---|---|---|
| Survey Year 2017 | Survey Year 2018 | Difference (2018 – 2017) | P-value for Test of Difference=0 | |||||
| Vaccine | Estimate | SE | Estimate | SE | Estimate | SE | ||
| ≥3 DTaP by 19 months† | 93.2 | 0.57 | 93.2 | 0.45 | 0.0 | 0.73 | 0.963 | |
| ≥4 DTaP by 19 months† | 71.4 | 1.14 | 70.1 | 1.05 | -1.2 | 1.55 | 0.423 | |
| ≥3 Poliovirus by 19 months | 91.1 | 0.75 | 91.4 | 0.53 | 0.3 | 0.92 | 0.756 | |
| ≥1 MMR by 19 months§ | 87.1 | 0.82 | 88.1 | 0.67 | 1.0 | 1.06 | 0.355 | |
| Hib primary series by 19 months¶ | 92.9 | 0.54 | 92.0 | 0.56 | -0.9 | 0.78 | 0.262 | |
| Hib full series by 19 months¶ | 75.6 | 0.99 | 74.6 | 0.99 | -0.9 | 1.40 | 0.505 | |
| HepB birth dose** | 75.3 | 1.16 | 74.4 | 1.03 | -0.9 | 1.55 | 0.555 | |
| ≥3 HepB by 19 months | 90.9 | 0.62 | 90.4 | 0.68 | -0.5 | 0.92 | 0.595 | |
| ≥1 VAR by 19 months§ | 87.0 | 0.77 | 87.1 | 0.69 | 0.0 | 1.04 | 0.977 | |
| ≥3 PCV by 19 months | 91.7 | 0.65 | 91.4 | 0.59 | -0.3 | 0.88 | 0.703 | |
| ≥4 PCV by 19 months | 78.2 | 0.97 | 77.0 | 0.97 | -1.2 | 1.37 | 0.383 | |
| ≥1 HepA by 19 months | 80.9 | 0.85 | 80.4 | 0.86 | -0.5 | 1.21 | 0.663 | |
| ≥2 HepA by 19 months | 23.9 | 0.98 | 25.6 | 1.00 | 1.7 | 1.40 | 0.234 | |
| Rotavirus by 19 months†† | 74.5 | 1.15 | 74.1 | 1.05 | -0.4 | 1.55 | 0.806 | |
| Combined 7-vaccine series by 19 months§§ | 60.4 | 1.21 | 59.7 | 1.15 | -0.7 | 1.67 | 0.682 | |
| No vaccinations | 1.0 | 0.12 | 1.1 | 0.16 | 0.1 | 0.20 | 0.521 | |
Abbreviations: DTaP = diphtheria, tetanus toxoids, and acellular pertussis vaccine; HepA = hepatitis A vaccine; HepB = hepatitis B vaccine; Hib = Haemophilus influenzae type b conjugate vaccine; MMR = measles, mumps, and rubella vaccine; PCV = pneumococcal conjugate vaccine; SE = standard error; VAR = varicella vaccine.
* The bridging birth cohort used for this analysis includes children born between January 2015 and May 2016.
† Includes children who may have been vaccinated with diphtheria and tetanus toxoids vaccine or diphtheria, tetanus toxoids, and pertussis vaccine.
§ Includes children who may have been vaccinated with measles, mumps, rubella, and varicella combination vaccine.
¶ Hib primary series: receipt of ≥2 or ≥3 doses, depending on product type received; full series: primary series and booster dose, which includes receipt of ≥3 or ≥4 doses, depending on product type received.
** One dose HepB administered from birth through age 3 days.
†† Includes ≥2 doses of Rotarix monovalent rotavirus vaccine (RV1), or ≥3 doses of RotaTeq pentavalent rotavirus vaccine (RV5). The maximum age for the final rotavirus dose is 8 months, 0 days.
§§ The combined 7-vaccine series (4:3:1:3*:3:1:4) includes ≥4 doses of DTaP, ≥3 doses of poliovirus vaccine, ≥1 dose of measles-containing vaccine, the full series of Hib (≥3 or ≥4 doses, depending on product type), ≥3 doses of HepB, ≥1 dose of VAR, and ≥4 doses of PCV.
Supplementary Figure 1
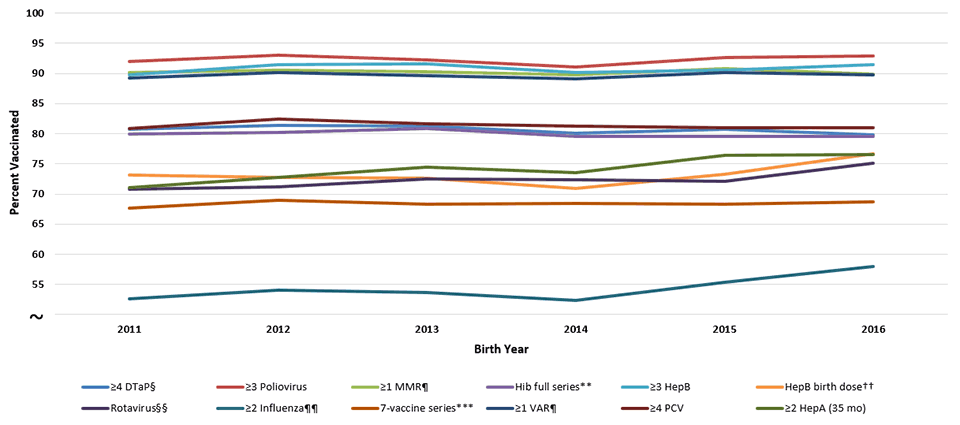
Estimated Vaccination Coverage by Age 24 Months,* by Birth Year,† National Immunization Survey-Child 2012-2018, United States

Abbreviations: DTaP = diphtheria, tetanus toxoids, and acellular pertussis vaccine; HepA = hepatitis A vaccine; HepB = hepatitis B vaccine; Hib = Haemophilus influenzae type b conjugate vaccine; MMR = measles, mumps, and rubella vaccine; PCV = pneumococcal conjugate vaccine; VAR = varicella vaccine.
* Includes vaccinations received by age 24 months (before the day the child turns 24 months), except for the HepB birth dose, rotavirus vaccination, and ≥2 HepA doses by 35 months. For all vaccines except the HepB birth dose and rotavirus vaccination, the Kaplan-Meier method was used to estimate vaccination coverage to account for children whose vaccination history was ascertained before age 24 months (35 months for ≥2 HepA doses).
† Children born in 2011 are included in survey years 2012, 2013, and 2014; children born in 2012 are included in survey years 2013, 2014, and 2015; children born in 2013 are included in survey years 2014, 2015, and 2016, children born in 2014 are included in survey years 2015, 2016, and 2017; children born in 2015 are included in survey years 2016, 2017, and 2018; children born in 2016 are included in survey years 2017 and 2018 (data from survey year 2019 are not yet available). Linear relationship between year of birth and vaccination status was estimated based on weighted linear regression analysis using the inverse of the estimated variance of each point estimate to construct the weights. Estimated percentage point change over one birth year (95% confidence interval): ≥4 DTaP -0.2 (-0.6-0.2) ; ≥3 Poliovirus 0.0 (-0.6-0.5); ≥1 MMR 0.0 (-0.3-0.3); Hib full series -0.1 (-0.5-0.3); HepB birth dose 0.4 (-0.8-1.6); ≥3 HepB 0.1 (-0.6-0.7) ; ≥1 Varicella 0.1 (-0.3-0.4) ; ≥4 PCV -0.1(-0.6-0.4); ≥2 HepA (35 mo) 1.1 (0.4-1.8); Rotavirus 0.6 (0.0-1.2); ≥2 Influenza 0.7 (-0.4-1.8); 7-vaccine series 0.1 (-0.3-0.4).
§ Includes children who may have been vaccinated with diphtheria and tetanus toxoids vaccine or diphtheria, tetanus toxoids, and pertussis vaccine.
¶ Includes children who may have been vaccinated with measles, mumps, rubella, and varicella combination vaccine.
** Hib full series: primary series and booster dose, which includes receipt of ≥3 or ≥4 doses, depending on product type received.
†† One dose HepB administered from birth through age 3 days.
§§ Includes ≥2 doses of Rotarix monovalent rotavirus vaccine (RV1), or ≥3 doses of RotaTeq pentavalent rotavirus vaccine (RV5). The maximum age for the final rotavirus dose is 8 months, 0 days.
¶¶ Doses must be at least 24 days apart (four weeks with a four-day grace period).
*** The combined 7-vaccine series (4:3:1:3*:3:1:4) includes ≥4 doses of DTaP, ≥3 doses of poliovirus vaccine, ≥1 dose of measles-containing vaccine, the full series of Hib (≥3 or ≥4 doses, depending on product type), ≥3 doses of HepB, ≥1 dose of VAR, and ≥4 doses of PCV.
Supplementary Figure 2
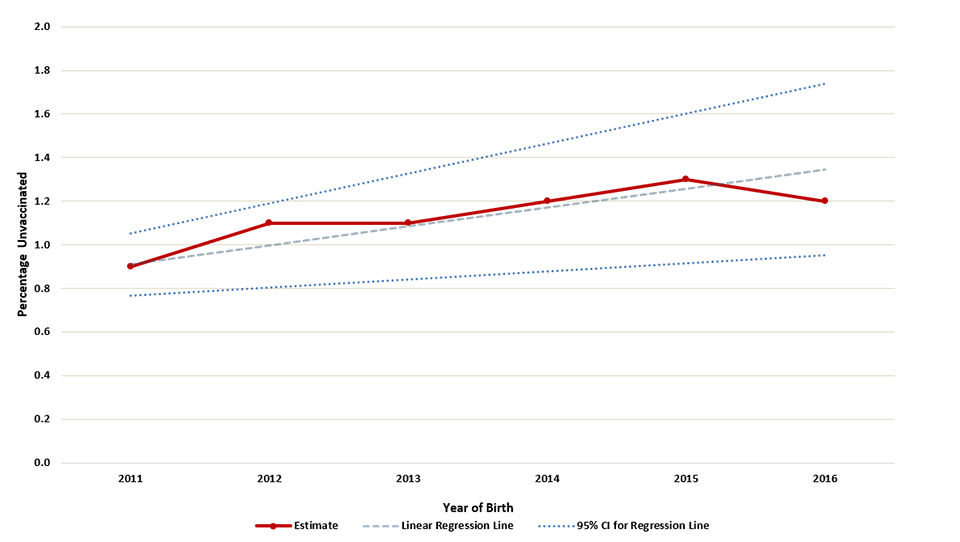
Estimated percentage of children who received no vaccinations by age 24 months,* by birth year†–National Immunization Survey-Child 2012-2018, United States

Abbreviations: CI = confidence interval
* Kaplan-Meier techniques are used to calculate estimates by age 24 months.
† Children born in 2011 are included in survey years 2012, 2013, and 2014; children born in 2012 are included in survey years 2013, 2014, and 2015; children born in 2013 are included in survey years 2014, 2015, and 2016, children born in 2014 are included in survey years 2015, 2016, and 2017; children born in 2015 are included in survey years 2016, 2017, and 2018; children born in 2016 are included in survey years 2017 and 2018 (data from survey year 2019 are not yet available). Estimated linear relationship between year of birth and vaccination status, based on weighted linear regression analysis using the inverse of the estimated variance of each point estimate to construct the weights. Observed percent unvaccinated (95% confidence interval): 2011 0.9 (0.7-1.1); 2012 1.1 (0.8-1.4); 2013 1.1 (0.8-1.4), 2014 1.2 (1.0-1.5); 2015 1.3 (1.1-1.6); 2016 1.2 (0.9-1.6). Estimated percentage point change per year: 0.09 (0.04-0.14).
