2016 Adult Asthma Data: Prevalence Tables and Maps
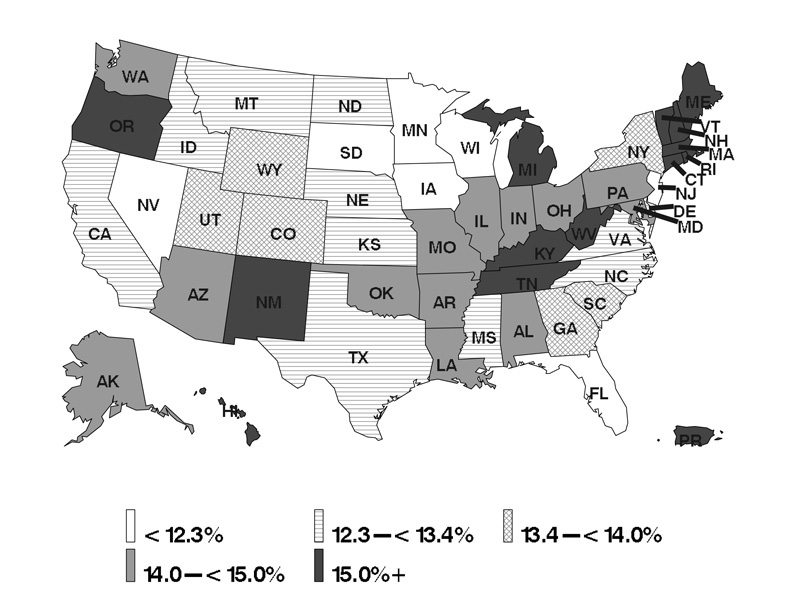
Map L1
Adult* Self-Reported Lifetime Asthma
Prevalence by State: BRFSS 2016
* Aged 18+ year
Legends are based on percentiles of the overall lifetime asthma prevalence estimates from year 2011 data: 0%, 20%, 40%, 60%, 80%, 100%
Asthma and Community Health Branch, National Center for Environmental Health
Centers for Disease Control and Prevention
| Asthma Prevalence Rate (%) | State |
|---|---|
| <12.3% | FL, IA, MN, NV, NJ, SD, WI |
| 12.3-<13.4% | CA, DE, ID, KS, MS, MT, NC, ND, NE, TX, VA |
| 13.4-<14.0% | CO, GA, NY, SC, UT, WY |
| 14.0-<15.0% | AK, AL, AR, AZ, IL, IN, LA, MD, MO, OH, OK, PA, WA |
| 15.0%+ | CT, HI, KY, MA, ME, MI, NH, NM, OR, PR, RI, TN, VT, WV |
View Page In: PDF [145K]
