At a glance
Targeted promotion of vaccination and efforts to increase vaccine confidence that take into account sociodemographic factors might increase vaccination coverage. Addressing the most common concerns of the unvaccinated, such as side effects and vaccine safety, could increase confidence in vaccines and help some to choose to get vaccinated.
Summary
By May 15, 2021, 59.4% of adults had received ≥1 dose based on administration data reported to CDC, and the number of daily vaccinations was slowing1. Data from the U.S. Census Bureau’s Household Pulse Survey (HPS) collected during April 28–May 10, 2021, were used to measure self-reported receipt of COVID-19 vaccination and intent to receive a vaccine if not already vaccinated among adults aged ≥18 years, by sociodemographic characteristics, and reasons for not intending to receive a vaccine2. The vaccination coverage estimates from HPS are higher than the official CDC estimates based on vaccine administration data1 but may provide useful information about the relative levels of coverage and intent by demographic characteristics that are not measured in the vaccine administration data (e.g., income, education, essential worker status), and reasons unvaccinated people report for not definitely planning to get vaccinated.
Survey-based coverage with ≥1 COVID-19 vaccine dose was 74.6%; an additional 4.3% and 3.5% of respondents reported they definitely would or probably would get vaccinated, respectively. Prevalence of vaccination and definite intent to get vaccinated varied by age group, race/ethnicity, income, education, previous COVID-19 diagnosis, and other person-level characteristics. Among adults aged ≥65 years, 91.7% reported they were either already vaccinated or definitely intended to get vaccinated; 69.9% of adults aged 18–24 years and 66.3% of adults aged 25–29 years had been vaccinated or definitely intended to get vaccinated. Among unvaccinated adults who reported they were unsure about getting a vaccine, or probably would get a vaccine, the most common reasons were planning to wait to see if the vaccine is safe (65.1%, 50.2%) and concern about possible side effects (56.5%, 48.4%), respectively. Efforts to increase vaccine confidence among those who are undecided can increase vaccination coverage.
Methods
HPS is a rapid-response survey of adults aged ≥18 years led by the U.S. Census Bureau, in partnership with seven other federal statistical agencies, to measure household experiences during the COVID-19 pandemic. Detailed information on probability sampling using the Census’ Master Address File, questionnaires, response rates, and bias assessment is available on the Census Bureau website2. Data from the HPS collected April 28–May 10, 2021 were analyzed. The response rate for the survey period used in this analysis was 7%, with a sample size of 77,946 respondents who completed the survey through the vaccination question.
Vaccination coverage (reported receipt of ≥1 dose of vaccine) was based on response to the question, “Have you received a COVID-19 vaccine?” Adults reporting not receiving a vaccine were asked “Once a vaccine to prevent COVID-19 is available to you, would you: definitely get a vaccine, probably get a vaccine, be unsure about getting a vaccine, probably not get a vaccine, definitely not get a vaccine.” * Adults who reported being vaccinated or who were unvaccinated and reported they definitely would get vaccinated are grouped together as a single outcome measure. Reasons for not intending to get a vaccine were asked of all unvaccinated respondents who reported any intent level other than ‘would definitely get a vaccine’. All sociodemographic variables included are self-reported by respondents. Unadjusted proportions with 95% confidence intervals (CI) were computed taking survey design and replicate weights into account, using the balanced repeated replication method with SAS-callable SUDAAN software (version 11.0.1, RTI) and using SAS (version 9.4, SAS Institute, Inc.) for other data processing. Contrast tests for proportions, comparing each level to the level selected as the referent, were conducted at α=0.05; all reported differences are statistically significant.
Results
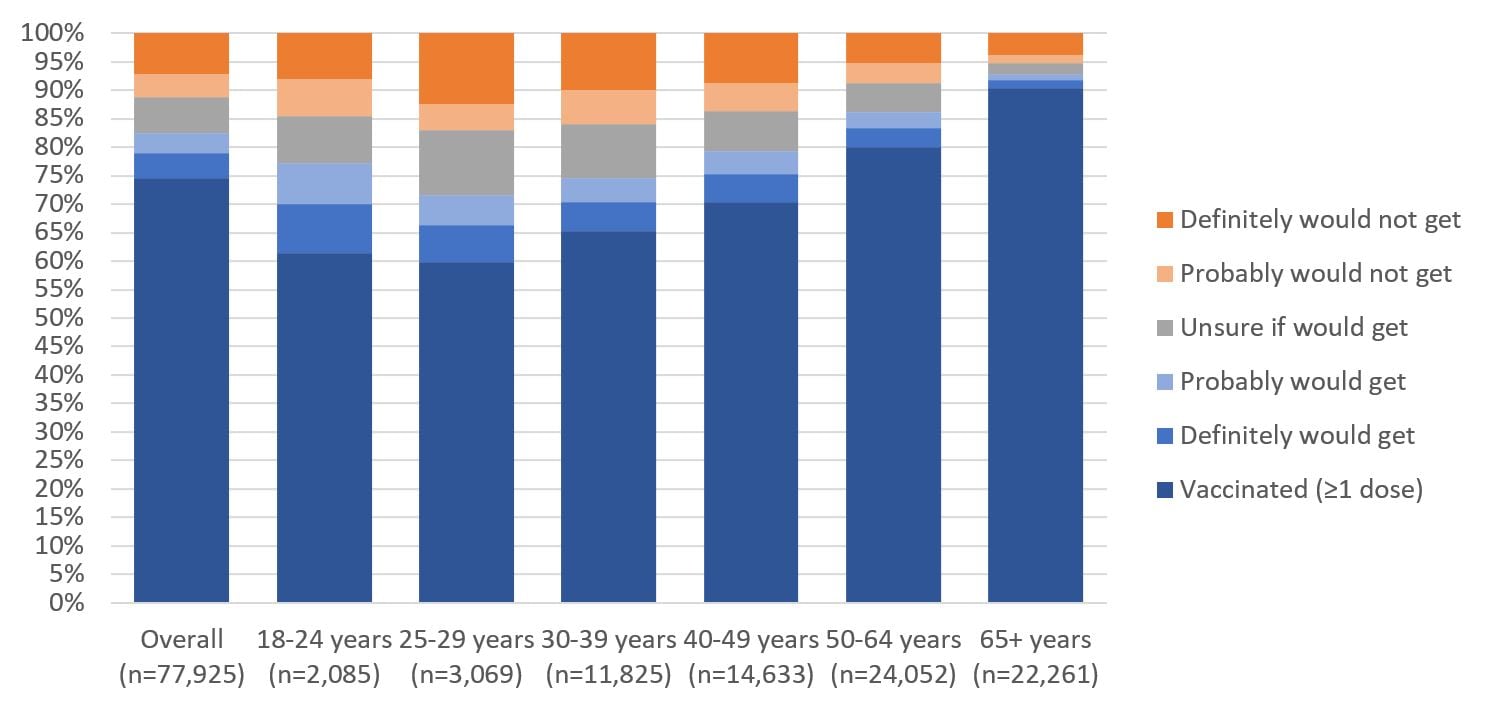
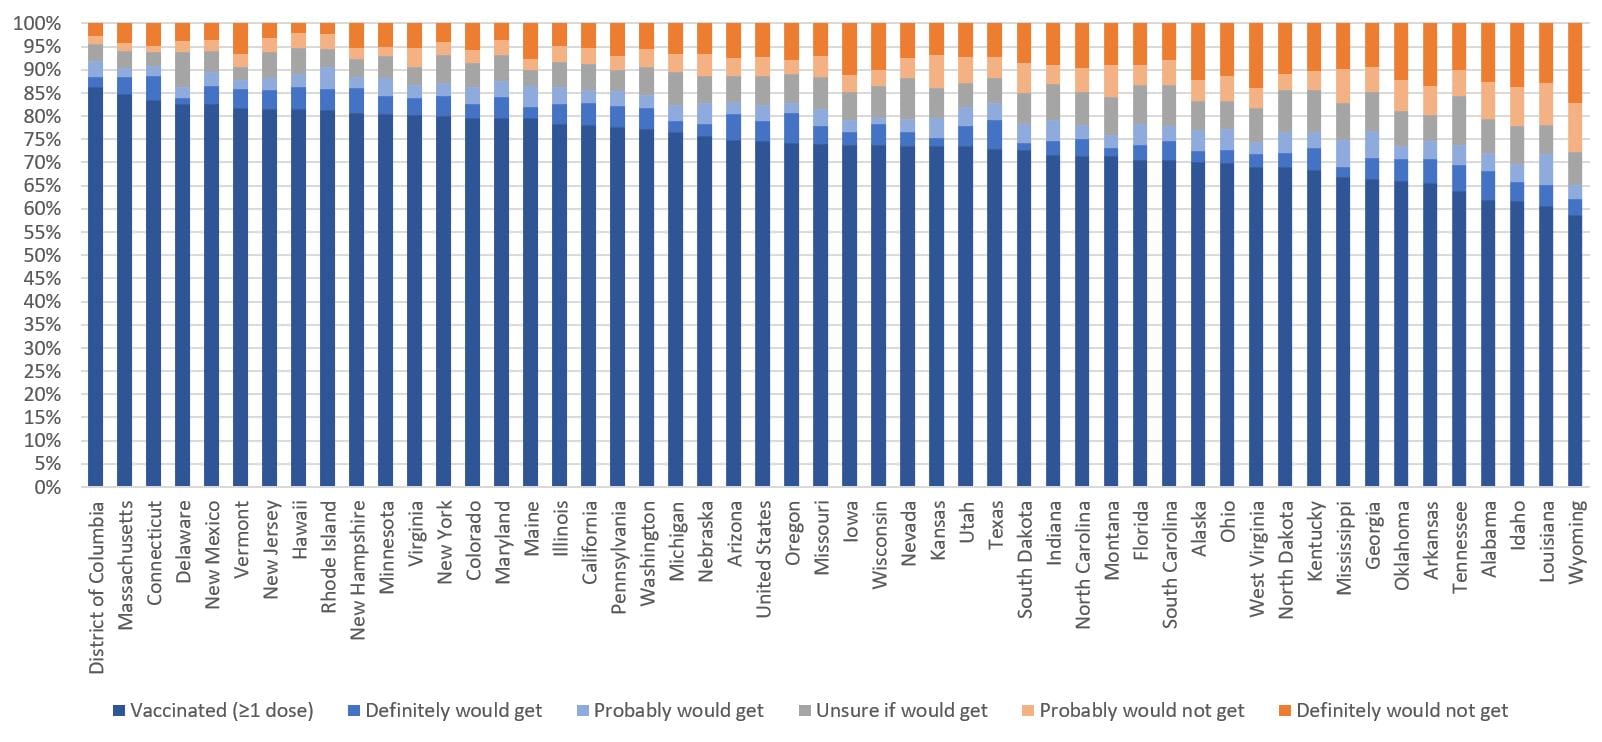
Among adults completing the survey during April 28–May 10, 74.6% reported having received a COVID-19 vaccine, 4.3% reported they definitely would get vaccinated, 3.5% probably would, 6.3% were unsure, and 11.3% probably or definitely would not get vaccinated (Figure 1). Of the unvaccinated, over half (55.5% = 14.1% / 25.4%) definitely or probably would get vaccinated or were unsure. This was found for all age groups except adults aged ≥65 years where it was less than half. Whereas 91.7% of adults aged ≥65 years had been vaccinated or definitely intended to be vaccinated, 69.9% of persons aged 18–24 years and 66.3% of those aged 25–29 years had been vaccinated or definitely intended to be vaccinated (Figure 1). This percentage varied by state, ranging from 62.2% (Wyoming) to 88.7% (Connecticut) (Figure 2a).
FIGURE 1. Reported Receipt of ≥1 Dose of COVID-19 Vaccine and Intent for Vaccination, by Age Group, Household Pulse Survey, April 28–May 10, 2021, United States

FIGURE 2a. Reported Receipt of ≥1 Dose of COVID-19 Vaccine and Levels of Intent for Vaccination, Adults aged ≥ 18 years, by State, Household Pulse Survey — United States, April 28–May 10, 2021

Racial/ethnic differences in receipt of ≥1 dose of a COVID-19 vaccine and in intending to be vaccinated varied by age group (Table). Among adults aged 18–49 years, coverage was lower among adults who were Black (50.8%), or of other race or multiracial (61.3%) than it was among White adults (66.6%). Among adults aged 18–49 years, the percentage who were vaccinated or definitely intending to get vaccinated was lower among Black adults (57.4%) and adults of other/multiple races (66.1%), compared with White adults (71.4%).
TABLE. Socio-demographic Characteristics Associated with Reported Receipt of ≥ 1 Dose of COVID-19 Vaccine and Vaccination Intent, by Age Group, Household Pulse Survey, United States, April 28–May 10, 2021
| Socio-demographic Characteristics | % (95% CI) | |||||||
|---|---|---|---|---|---|---|---|---|
| All Adults aged ≥18 years (n = 77,946) | 18–49 years (n = 31,624) | 50–64 years (n = 24,056) | 65+ years (n = 22,266) | |||||
| Received ≥1 dose of COVID-19 vaccine | Vaccinated or unvaccinated and definitely would get vaccinated | Received ≥1 dose of COVID-19 vaccine | Vaccinated or unvaccinated and definitely would get vaccinated | Received ≥1 dose of COVID-19 vaccine | Vaccinated or unvaccinated and definitely would get vaccinated | Received ≥1 dose of COVID-19 vaccine | Vaccinated or unvaccinated and definitely would get vaccinated | |
| Overall | 74.6 (74.0–75.2) | 78.9 (78.3–79.5) | 65.3 (64.2–66.4) | 71.3 (70.3–72.3) | 80.0 (79.2–80.8) | 83.4 (82.6–84.1) | 90.2 (89.4–91.0) | 91.7 (90.9–92.4) |
| Sex | ||||||||
| Male (referent) | 74.2 (73.1–75.1) | 79.0 (78.0–80.0) | 65.3 (63.5–67.1) | 71.9 (70.1–73.7) | 79.4 (78.4–80.5) | 83.2 (82.1–84.2) | 90.3 (89.1–91.4) | 92.1 (90.9–93.1) |
| Female | 75.0 (74.3–75.7) | 78.8 (78.1–79.4) | 65.3 (64.1–66.6) | 70.6 (69.5–71.8) | 80.6 (79.3–81.9) | 83.5 (82.4–84.6) | 90.2 (89.0–91.3) | 91.4 (90.1–92.5) |
| Race/ethnicity† | ||||||||
| Hispanic | 70.0 (67.7–72.2)* | 77.5 (75.3–79.5)* | 63.9 (60.8–67.0) | 73.5 (70.4–76.3) | 79.6 (76.3–82.6) | 84.4 (81.2–87.3) | 85.9 (80.9–90.0)* | 86.8 (81.6–90.9)* |
| Non-Hispanic White only (referent) | 76.5 (75.8–77.2) | 79.8 (79.1–80.5) | 66.6 (65.2–68.1) | 71.4 (70.1–72.6) | 79.6 (78.5–80.6) | 82.2 (81.1–83.2) | 90.5 (89.7–91.3) | 92.0 (91.3–92.7) |
| Non-Hispanic Black only | 66.4 (63.9–68.9)* | 71.6 (69.1–74.0)* | 50.8 (46.9–54.7)* | 57.4 (53.6–61.1)* | 81.3 (78.0–84.4) | 86.1 (82.9–88.9)* | 92.0 (89.4–94.2) | 93.5 (90.9–95.5) |
| Non-Hispanic Asian only | 90.3 (88.5–92.0)* | 93.7 (91.8–95.2)* | 88.1 (85.5–90.4)* | 92.0 (89.3–94.2)* | 91.7 (87.9–94.6)* | 95.0 (91.8–97.2)* | 97.8 (95.2–99.3)* | 99.1 (98.0–99.7)* |
| Non-Hispanic other/multiple races§ | 65.9 (62.3–69.4)* | 70.5 (67.2–73.6)* | 61.3 (56.5–65.9)* | 66.1 (61.9–70.2)* | 69.2 (62.7–75.2)* | 74.3 (67.7–80.1)* | 80.6 (73.9–86.2)* | 83.1 (76.7–88.3)* |
| Educational Status | ||||||||
| High school or less (referent) | 64.6 (63.2–66.0) | 71.0 (69.8–72.2) | 47.7 (45.2–50.2) | 57.3 (55.2–59.4) | 73.3 (71.4–75.2) | 78.4 (76.7–80.0) | 87.1 (85.3–88.7) | 89.0 (87.2–90.6) |
| Some college or college graduate | 78.2 (77.3–79.1)* | 81.5 (80.7–82.2)* | 71.9 (70.5–73.4)* | 76.3 (75.1–77.5)* | 82.4 (81.4–83.4)* | 84.7 (83.9–85.5)* | 91.7 (90.8–92.5)* | 93.0 (92.2–93.7)* |
| Above college graduate | 90.8 (90.1–91.6)* | 92.4 (91.6–93.1)* | 87.6 (86.3–88.9)* | 89.7 (88.4–91.0)* | 92.3 (91.3–93.3)* | 93.8 (92.8–94.6)* | 95.6 (94.5–96.5)* | 96.1 (95.1–97.0)* |
| 2019 Total Household Income | ||||||||
| <$35,000 (referent) | 64.7 (62.7–66.6) | 71.1 (69.4–72.8) | 51.8 (48.5–55.1) | 60.5 (57.6–63.4) | 68.4 (65.2–71.4) | 74.0 (70.9–76.9) | 87.1 (84.7–89.2) | 89.8 (87.6–91.7) |
| $35,000 –$49,999 | 73.0 (70.6–75.2)* | 77.5 (74.9–80.0)* | 61.4 (57.5–65.2)* | 68.2 (63.7–72.5)* | 75.0 (71.3–78.5)* | 78.8 (74.9–82.3) | 89.6 (86.8–91.9) | 91.1 (88.4–93.4) |
| $50,000–$74,999 | 76.3 (74.4–78.1)* | 79.4 (77.5–81.1)* | 66.3 (62.9–69.7)* | 70.6 (67.2–73.8)* | 77.6 (74.7–80.3)* | 80.3 (77.6–82.9)* | 92.0 (90.2–93.5)* | 93.2 (91.5–94.7)* |
| ≥$75,000 | 84.6 (83.7–85.5)* | 86.7 (85.8–87.5)* | 78.9 (77.4–80.4)* | 82.0 (80.5–83.4)* | 87.5 (86.1–88.8)* | 89.0 (87.8–90.2)* | 93.7 (92.4–94.9)* | 94.5 (93.2–95.6)* |
| Did not report | 70.9 (69.4–72.3)* | 76.2 (75.0–77.5)* | 62.1 (59.9–64.4)* | 69.2 (67.3–71.0)* | 79.3 (77.2–81.3)* | 83.7 (82.2–85.2)* | 88.6 (86.0–90.8) | 89.9 (87.4–92.0) |
| Marital Status | ||||||||
| Currently married (referent) | 79.0 (78.3–79.7) | 82.1 (81.4–82.8) | 68.4 (66.8–69.9) | 73.1 (71.7–74.5) | 83.4 (82.4–84.4) | 85.9 (84.9–86.9) | 92.3 (91.6–93.1) | 93.4 (92.6–94.1) |
| Widowed/divorced/separated | 74.2 (72.6–75.8)* | 78.5 (77.0–79.9)* | 55.9 (53.1–58.8)* | 62.9 (59.9–65.9)* | 72.1 (69.8–74.4)* | 76.9 (74.8–79.0)* | 88.1 (86.1–89.9)* | 90.0 (88.2–91.6)* |
| Never married | 65.6 (63.9–67.4)* | 72.4 (70.7–74.1)* | 63.9 (62.1–65.7)* | 71.0 (69.2–72.7) | 75.4 (71.6–78.8)* | 81.2 (78.0–84.1)* | 80.0 (70.6–87.5)* | 82.6 (72.9–89.9)* |
| No. persons living in the household | ||||||||
| 1 (referent) | 80.5 (79.0–81.9) | 84.1 (82.6–85.4) | 72.2 (69.0–75.2) | 77.5 (74.4–80.3) | 76.2 (73.0–79.2) | 81.2 (78.1–84.0) | 89.9 (88.0–91.7) | 91.3 (89.4–92.9) |
| 2 | 83.1 (82.2–83.9)* | 85.8 (85.0–86.6)* | 72.6 (70.7–74.4) | 77.8 (76.0–79.5) | 82.3 (80.8–83.6)* | 84.7 (83.2–86.1)* | 92.3 (91.4–93.2)* | 93.3 (92.4–94.1)* |
| ≥3 | 69.4 (68.4–70.4)* | 74.6 (73.6–75.5)* | 63.0 (61.5–64.4)* | 69.1 (67.8–70.5)* | 79.2 (77.9–80.4) | 82.8 (81.7–84.0) | 86.4 (84.1–88.5)* | 88.8 (86.6–90.8) |
| Children <18 Living in the Household | ||||||||
| Yes (referent) | 64.6 (63.3–65.9) | 69.9 (68.8–71.0) | 59.5 (58.0–61.0) | 65.4 (64.0–66.7) | 77.7 (75.5–79.8) | 81.5 (79.7–83.2) | 83.2 (80.0–86.1) | 86.0 (83.1–88.7) |
| No | 81.0 (80.3–81.7)* | 84.6 (83.9–85.3)* | 72.5 (71.2–73.8)* | 78.5 (77.2–79.8)* | 80.9 (79.8–82.0)* | 84.1 (83.1–85.0)* | 91.3 (90.4–92.1)* | 92.5 (91.7–93.3)* |
| Difficulty paying usual household expenses in last 7 days | ||||||||
| Yes (referent) | 67.9 (66.8–69.0) | 73.9 (72.8–74.9) | 59.0 (57.4–60.6) | 66.5 (64.9–68.1) | 75.0 (73.3–76.7) | 79.8 (78.2–81.3) | 87.4 (85.7–89.0) | 89.7 (88.2–91.0) |
| No | 82.8 (82.0–83.5)* | 85.1 (84.4–85.8)* | 75.3 (73.9–76.7)* | 78.9 (77.5–80.2)* | 85.3 (84.3–86.3)* | 87.0 (86.0–87.9)* | 92.5 (91.5–93.3)* | 93.4 (92.4–94.3)* |
| Work or volunteer outside of home since January 1, 2021 | ||||||||
| Health care (referent) | 80.6 (78.7–82.4) | 82.5 (80.5–84.4) | 75.3 (72.8–77.7) | 77.7 (75.1–80.2) | 88.5 (86.4–90.5) | 89.5 (87.3–91.4) | 91.8 (89.0–94.1) | 93.3 (90.9–95.1) |
| Education | 82.5 (80.2–84.7) | 84.9 (82.8–86.9) | 78.7 (75.3–81.7) | 81.9 (78.7–84.7)* | 88.0 (85.6–90.2) | 89.3 (87.0–91.3) | 93.7 (89.0–96.9) | 93.7 (89.0–96.9) |
| Other front-line | 64.3 (61.6–66.9)* | 68.4 (65.5–71.1)* | 56.5 (52.8–60.1)* | 61.5 (57.8–65.2)* | 76.8 (73.7–79.7)* | 79.5 (76.4–82.4)* | 87.3 (80.7–92.3) | 88.3 (81.8–93.2) |
| Non-frontline essential | 64.7 (62.3–67.0)* | 69.9 (67.6–72.1)* | 58.1 (54.5–61.7)* | 64.5 (61.1–67.8)* | 76.2 (72.8–79.3)* | 79.5 (75.9–82.7)* | 80.0 (73.5–85.6)* | 82.3 (76.1–87.4)* |
| None of the above sectors | 72.2 (70.5–73.9)* | 77.2 (75.6–78.8)* | 61.6 (58.3–64.9)* | 69.5 (66.3–72.5)* | 78.5 (75.4–81.5)* | 81.2 (78.1–84.0)* | 91.1 (88.9–93.0) | 91.9 (89.7–93.7) |
| Did not work/volunteer outside of home since January 1, 2021 | 77.5 (76.6–78.3)* | 81.9 (81.1–82.7) | 66.9 (65.4–68.5)* | 73.4 (72.0–74.8)* | 79.7 (78.3–81.0)* | 84.0 (82.7–85.2)* | 90.6 (89.6–91.5) | 92.2 (91.2–93.0) |
| Previous COVID-19 diagnosis | ||||||||
| Yes (referent) | 62.4 (60.1–64.6) | 69.4 (67.4–71.3) | 54.5 (51.4–57.6)* | 62.7 (59.9–65.4) | 69.3 (66.2–72.2) | 75.7 (72.7–78.5) | 82.8 (79.4–85.9) | 85.9 (83.0–88.4) |
| No | 76.8 (76.1–77.4)* | 80.6 (80.0–81.2)* | 67.5 (66.3–68.7)* | 73.1 (72.0–74.1)* | 82.0 (81.1–82.9)* | 84.9 (84.1–85.6)* | 91.2 (90.4–92.0)* | 92.5 (91.7–93.2)* |
Abbreviation: CI = confidence interval.
* Statistically significant difference from the referent group by contrast test for difference in proportions (p<0.05)
†Race is reported by respondent. Persons of Hispanic ethnicity may be of any race.
§Includes American Indian/Alaska Native, Native Hawaiian, Chamorro, Samoan, or other Pacific Islander, and persons of multiple races. Persons identified as multiple races selected more than one of the race categories.
Among adults aged 50–64 years, COVID-19 vaccination coverage was similar among Hispanic (79.6%), Black (81.3%), and White (79.6%) adults, whereas coverage among other or multiracial adults (69.2%) was lower. Among adults aged 50–64 years, the percentage who were vaccinated or definitely intending to get vaccinated was lower among adults of other/multiple races (74.3%), compared with White adults (82.2%). Among adults aged ≥65 years, coverage among Hispanic (85.9%) and other or multiracial adults (80.6%) was lower than that among White adults (90.5%); coverage among Black adults (92.0%) was similar to that among White adults. Among adults aged ≥65 years, the percentage who were vaccinated or definitely intending to get vaccinated was lower among Hispanic adults (86.8%) and adults of other/multiple races (83.1%), compared with White adults (92.0%).
Some socioeconomic differences in the percentage of adults reporting receipt of ≥1 dose and the percentage of adults who were vaccinated or definitely intending to get vaccinated were found (Table). Among all age groups, the percentage of adults who were vaccinated and the percentage who were vaccinated or definitely intending to get vaccinated were consistently higher among those with at least some college education compared with those who had up to a high school education, as well as among adults with higher versus lower incomes (Table). Reported receipt of a COVID-19 vaccination was 14.4 percentage points lower among adults who reported they had ever been told by a health care provider that they had COVID-19 than among those who reported never having been told that they had COVID-19 (Table).
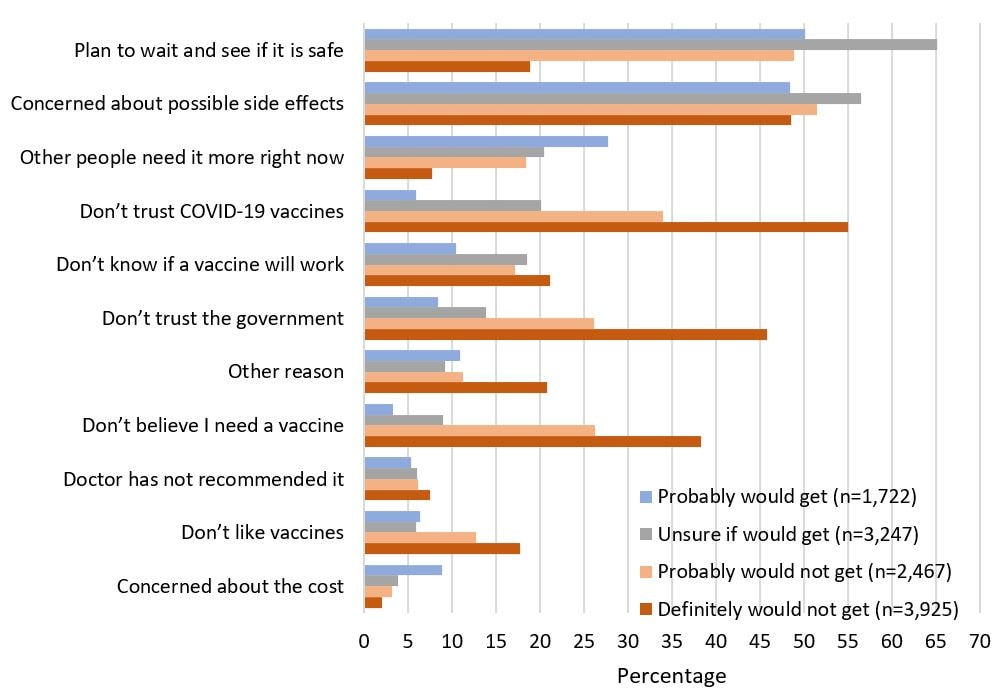
Reasons for nonvaccination varied by intent to be vaccinated (Figure 3). Among unvaccinated adults who reported they were unsure about getting a vaccine, the most common reasons were planning to wait to see if the vaccine is safe (65.1%) and concern about possible side effects (56.5%). The most common reasons among unvaccinated adults who definitely would not get a vaccine were not trusting COVID-19 vaccines (55.0%), concern about possible side effects (48.6%), and not trusting the government (45.8%). The most common reasons among unvaccinated adults who reported they probably would or would not, respectively, get a vaccine were concern about possible side effects (48.4%, 51.5%) and planning to wait to see if the vaccine is safe (50.2%, 48.9%).
FIGURE 3. Reasons for Other Than Definitely Intending to Get A COVID-19 Vaccine, by Level of Intent, Adults Aged ≥18 Years, Household Pulse Survey, April 28–May 10, 2021

Discussion
By mid-April 2021, all U.S. adults were eligible to receive COVID-19 vaccine, with implementation varying by state. By mid-April, the daily number of persons receiving one dose began to decline1. This report found that 14.1% of adult survey respondents reporting they had not yet initiated COVID-19 vaccination but definitely or probably would get vaccinated or were unsure. This accounted for more than half of the 25.4% reporting that they were unvaccinated and was found for all age groups except adults aged ≥65 years, where coverage has already reached 90%. These adults could be considered likely to get vaccinated, suggesting that, if their confidence in COVID-19 vaccination were increased and vaccine were readily accessible, they may decide to get vaccinated.
Racial/ethnic disparities in COVID-19 vaccination differ by age group, with lower coverage compared with White adults of the same age group among Black and other or multiracial adults aged 18–49 years, and Hispanic and other or multiracial adults aged ≥65 years, and other or multiracial adults aged 50-64 years. For all of these above mentioned groups, the percentage reporting that they were vaccinated or would definitely get vaccinated was also lower; efforts to increase vaccine confidence among younger Black adults and older Hispanic, and adults of other/multiple races of all ages might help to increase vaccination coverage.
The findings in this study are subject to at least five limitations. First, HPS has a low response rate (<10%); although the Census Bureau conducted an extensive nonresponse bias assessment and found that although the survey weights might mitigate some of this bias, bias in estimates will remain2. The COVID-19 vaccination coverage estimates from March 3-15, 2021 HPS were compared with estimates reported on the CDC COVID Data Tracker website and found to be approximately 7.7 percentage points higher34. As of May 4, 2021 (mid-point of the HPS data collection period used in this report), CDC COVID Data Tracker indicated that 56.4% of adults aged ≥18 years had received at least one dose of COVID-19 vaccine, 18.2 percentage points lower than the HPS estimate of 74.6% in this study. This indicates that the weighted survey sample is not representative of the general adult population with respect to COVID-19 vaccination, and bias may have increased over time. While comparisons of vaccination and intent estimates from HPS between demographic subgroups may be valid, differential bias by levels of demographic variables not fully mitigated by weighing cannot be ruled out. Similarly, estimates of the proportions by level of intent to be vaccinated are likely too low.**
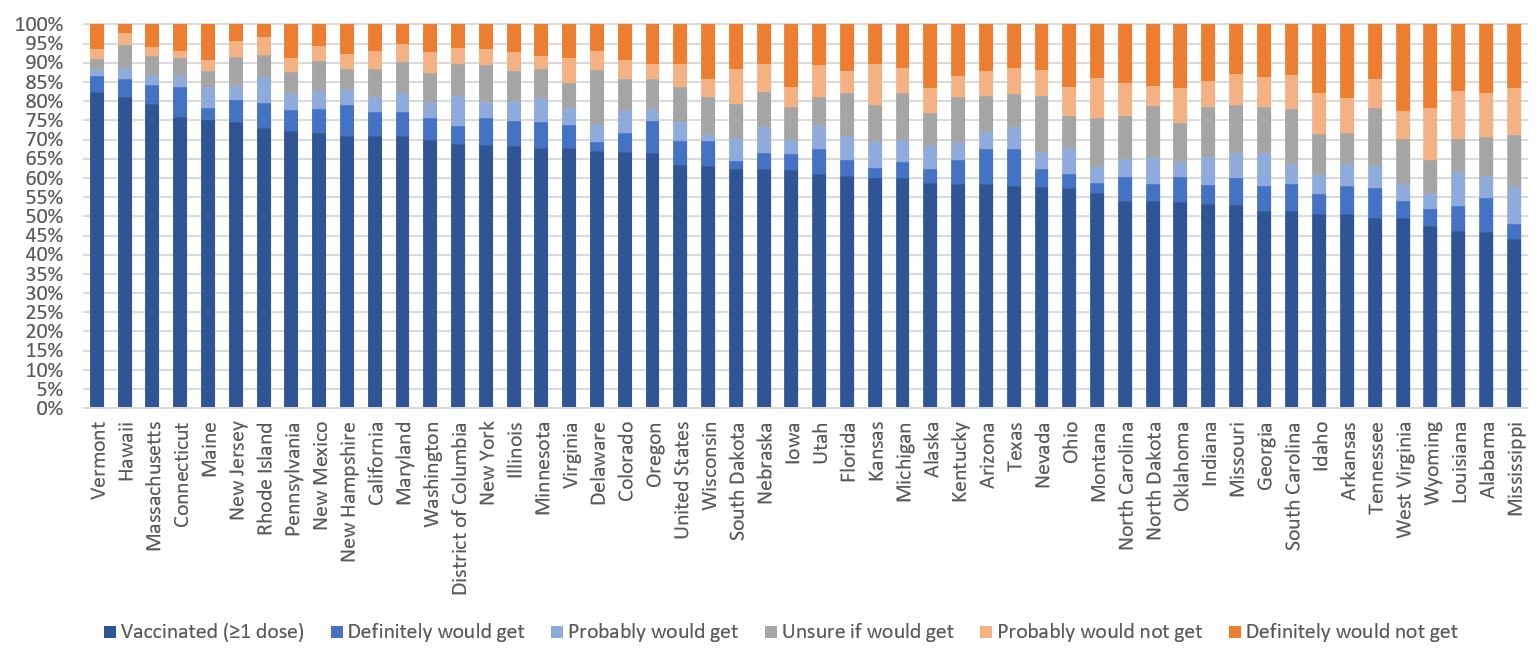
Figure 2b presents state-level data from the HPS calibrated to coverage from administration data reported on CDC’s COVID Data Tracker as of June 5, 2021; these estimates are likely more representative of true coverage and levels of intent in the U.S. states. Second, vaccination status was based on self-report and is subject to recall and social desirability bias. However, adult self-report of COVID-19 vaccination is likely to be more reliable than self-report of influenza vaccination status, which has been shown to be adequately reliable Third, responses to the question “would you…get a vaccine” might indicate not only hesitancy but also consideration of likelihood given practical and structural barriers to vaccination. Fourth, HPS does not collect information on sociobehavioral factors beyond reasons for lack of intent that could be used to tailor efforts to improve vaccine confidence5. Lastly, because a public-use data set was analyzed, the non-Hispanic other or multiple races group could not be disaggregated to further assess which specific groups were reporting lower coverage or willingness to get vaccinated.
Targeted promotion of vaccination and efforts to increase vaccine confidence that take into account sociodemographic factors might increase vaccination coverage. Addressing the most common concerns of the unvaccinated, such as concern about side effects and concerns about the vaccine safety, could increase confidence in vaccines and help some to choose to get vaccinated. Building trust by sharing clear and accurate messages about COVID-19 vaccines, and engaging communities and community leaders in equitable and inclusive ways, all can serve to increase vaccine confidence and vaccination coverage. Monitoring for differences in receipt of COVID-19 vaccine, differences in intent for vaccination, and reasons for not intending to get vaccinated, as this study has, can help inform targeted campaigns to promote vaccination and vaccination confidence.
Figure 2b. Reported Receipt of ≥1 Dose of COVID-19 Vaccine and Levels of Intent for Vaccination, Adjusted to Reflect Vaccination Coverage by State from CDC COVID Data Tracker (as of 6/5/2021), Adults aged ≥ 18 years, by State, Household Pulse Survey — United States, April 28–May 10, 2021

Disclaimer
The findings and conclusions in this report are those of the authors and do not necessarily represent the official position of the Centers for Disease Control and Prevention.
Authors
Tammy A. Santibanez, PhD; James A. Singleton, PhD; Carla L. Black, PhD; Kimberly Nguyen, DrPH; Mei-Chuan Hung, PhD; Svetlana Masalovich, MSc; Peng-Jun Lu, MD, PhD; Kathryn A. Brookmeyer, PhD; Neetu Abad, PhD; Kamil E. Barbour, PhD; Ari Whiteman, PhD; Bhavini Patel Murthy, MD; Alice Wang, PhD; Holly A. Hill, MD, PhD
Vaccine Task Force, COVID-19 Response Team, CDC; Immunization Services Division, National Center for Immunization and Respiratory Diseases; Leidos Inc, Atlanta, Georgia; Kāpili Government Services, LLC, Atlanta, Georgia; Geospatial Research, Analysis, and Services Program, Agency for Toxic Substances and Disease Registry, Atlanta, Georgia.
- CDC. COVID Data Tracker. 2021 [4/10/2021]; Available from: https://covid.cdc.gov/covid-data-tracker/#vaccinations
- Census_Bureau US. Measuring Household Experiences during the Coronavirus Pandemic. 2021 [updated 4/6/20214/10/2021]; Available from: https://www.census.gov/data/experimental-data-products/household-pulse-survey.html
- CDC. Comparison of COVID-19 vaccination coverage estimates from the Household Pulse Survey, Omnibus Panel Surveys, and COVID-19 vaccine administration data, United States, March 2021. 2021 [6/7/2021]; Available from: https://www.cdc.gov/adultvaxview/publications-resources/covid19-coverage-estimates-comparison.html
- Census Bureau US. Household Pulse Survey COVID-19 Vaccination Tracker. 2021 [6/1/2021]; Available from: https://www.census.gov/library/visualizations/interactive/household-pulse-survey-covid-19-vaccination-tracker.html
- Brewer NT, Chapman GB, Rothman AJ, Leask J, Kempe A. Increasing Vaccination: Putting Psychological Science Into Action. Psychol Sci Public Interest. 2017 Dec;18(3):149-207.
- *21 of the respondents who reported they were unvaccinated did not answer the intent for vaccination question, therefore the sample size for was n=77,925 for outcomes including intent.
- ** Over-estimation of the proportion vaccinated also leads to under-estimation of the levels of intent. For example, for adults aged ≥18 years, if the percent unvaccinated was 41.8% from the vaccine administered data (1) compared to 25.4% from HPS, and the distribution of intent levels among the unvaccinated from HPS are applied to the 41.8% unvaccinated, 7.1% would definitely plan to get vaccinated and 11.8% would definitely not plan to get vaccinated, compared to the HPS estimates of 4.3% and 7.2%, respectively.
