Reported Tuberculosis in the United States, 2020
Table 34. Tuberculosis Cases and Percentages, by Pulmonary and Extrapulmonary Disease: Reporting Areas, 2020
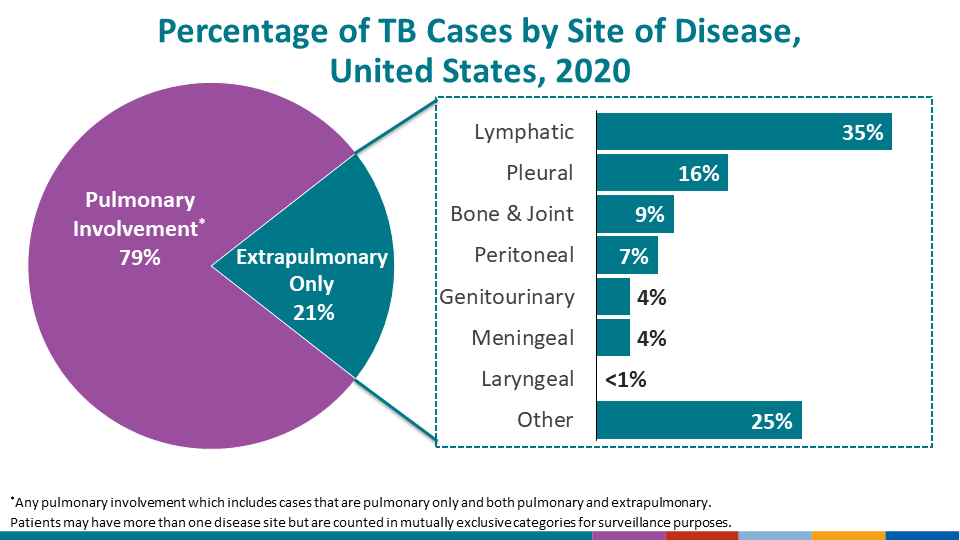
See Surveillance Slide #48.
| Reporting area | Total Cases1 | Pulmonary2 | Extrapulmonary3 | Both Pulmonary/ Extrapulmonary |
|||
|---|---|---|---|---|---|---|---|
| No. | (%) | No. | (%) | No. | (%) | ||
| United States | 7,167 | 4,813 | (67.2) | 1,513 | (21.1) | 841 | (11.7) |
| Alabama | 73 | 55 | (75.3) | 14 | (19.2) | 4 | (5.5) |
| Alaska | 58 | 53 | (91.4) | 3 | (5.2) | 2 | (3.4) |
| Arizona | 136 | 99 | (72.8) | 24 | (17.6) | 13 | (9.6) |
| Arkansas | 59 | 48 | (81.4) | 8 | (13.6) | 3 | (5.1) |
| California | 1,705 | 1,158 | (67.9) | 337 | (19.8) | 210 | (12.3) |
| Colorado | 52 | 26 | (50.0) | 19 | (36.5) | 7 | (13.5) |
| Connecticut | 54 | 31 | (57.4) | 15 | (27.8) | 8 | (14.8) |
| Delaware | 17 | 9 | (52.9) | 6 | (35.3) | 2 | (11.8) |
| District of Columbia | 19 | 10 | (52.6) | 8 | (42.1) | 1 | (5.3) |
| Florida | 412 | 320 | (77.7) | 55 | (13.3) | 37 | (9.0) |
| Georgia | 220 | 156 | (70.9) | 49 | (22.3) | 15 | (6.8) |
| Hawaii | 92 | 58 | (63.0) | 23 | (25.0) | 11 | (12.0) |
| Idaho | 8 | 4 | (50.0) | 4 | (50.0) | 0 | (0.0) |
| Illinois | 216 | 128 | (59.3) | 69 | (31.9) | 19 | (8.8) |
| Indiana | 92 | 60 | (65.2) | 16 | (17.4) | 16 | (17.4) |
| Iowa | 39 | 17 | (43.6) | 11 | (28.2) | 11 | (28.2) |
| Kansas | 37 | 29 | (78.4) | 6 | (16.2) | 2 | (5.4) |
| Kentucky | 67 | 51 | (76.1) | 10 | (14.9) | 6 | (9.0) |
| Louisiana | 99 | 76 | (76.8) | 12 | (12.1) | 11 | (11.1) |
| Maine | 17 | 11 | (64.7) | 3 | (17.6) | 3 | (17.6) |
| Maryland | 149 | 88 | (59.1) | 44 | (29.5) | 17 | (11.4) |
| Massachusetts | 142 | 79 | (55.6) | 35 | (24.6) | 28 | (19.7) |
| Michigan | 101 | 52 | (51.5) | 31 | (30.7) | 18 | (17.8) |
| Minnesota | 117 | 54 | (46.2) | 50 | (42.7) | 13 | (11.1) |
| Mississippi | 41 | 32 | (78.0) | 5 | (12.2) | 4 | (9.8) |
| Missouri | 72 | 54 | (75.0) | 15 | (20.8) | 3 | (4.2) |
| Montana | 4 | 1 | (25.0) | 3 | (75.0) | 0 | (0.0) |
| Nebraska | 36 | 17 | (47.2) | 19 | (52.8) | 0 | (0.0) |
| Nevada | 57 | 41 | (71.9) | 9 | (15.8) | 7 | (12.3) |
| New Hampshire | 12 | 7 | (58.3) | 3 | (25.0) | 2 | (16.7) |
| New Jersey | 245 | 154 | (62.9) | 66 | (26.9) | 25 | (10.2) |
| New Mexico | 29 | 21 | (72.4) | 6 | (20.7) | 2 | (6.9) |
| New York State4 | 161 | 96 | (59.6) | 36 | (22.4) | 29 | (18.0) |
| New York City | 445 | 282 | (63.4) | 75 | (16.9) | 88 | (19.8) |
| North Carolina | 159 | 111 | (69.8) | 28 | (17.6) | 20 | (12.6) |
| North Dakota | 10 | 9 | (90.0) | 1 | (10.0) | 0 | (0.0) |
| Ohio | 130 | 97 | (74.6) | 33 | (25.4) | 0 | (0.0) |
| Oklahoma | 65 | 44 | (67.7) | 15 | (23.1) | 6 | (9.2) |
| Oregon | 67 | 36 | (53.7) | 15 | (22.4) | 16 | (23.9) |
| Pennsylvania | 157 | 101 | (64.3) | 37 | (23.6) | 19 | (12.1) |
| Rhode Island | 8 | 5 | (62.5) | 1 | (12.5) | 2 | (25.0) |
| South Carolina | 67 | 46 | (68.7) | 11 | (16.4) | 10 | (14.9) |
| South Dakota | 16 | 4 | (25.0) | 6 | (37.5) | 6 | (37.5) |
| Tennessee | 113 | 91 | (80.5) | 16 | (14.2) | 6 | (5.3) |
| Texas | 881 | 658 | (74.7) | 143 | (16.2) | 80 | (9.1) |
| Utah | 29 | 12 | (41.4) | 13 | (44.8) | 4 | (13.8) |
| Vermont | 2 | 0 | (0.0) | 2 | (100.0) | 0 | (0.0) |
| Virginia | 169 | 108 | (63.9) | 45 | (26.6) | 16 | (9.5) |
| Washington | 163 | 84 | (51.5) | 51 | (31.3) | 28 | (17.2) |
| West Virginia | 13 | 10 | (76.9) | 2 | (15.4) | 1 | (7.7) |
| Wisconsin | 35 | 20 | (57.1) | 5 | (14.3) | 10 | (28.6) |
| Wyoming | 0 | 0 | … | 0 | … | 0 | … |
| American Samoa5 | 3 | 2 | (66.7) | 0 | (0.0) | 1 | (33.3) |
| Fed. States of Micronesia5 | 83 | 68 | (81.9) | 12 | (14.5) | 3 | (3.6) |
| Guam5 | 56 | 44 | (78.6) | 5 | (8.9) | 7 | (12.5) |
| Marshall Islands5 | 149 | 119 | (79.9) | 29 | (19.5) | 1 | (0.7) |
| Northern Mariana Islands5 | 38 | 36 | (94.7) | 2 | (5.3) | 0 | (0.0) |
| Puerto Rico5 | 27 | 26 | (96.3) | 1 | (3.7) | 0 | (0.0) |
| Palau5 | 9 | 8 | (88.9) | 0 | (0.0) | 1 | (11.1) |
| U.S. Virgin Islands5 | 3 | 3 | (100.0) | 0 | (0.0) | 0 | (0.0) |
1Includes only cases with a known disease site.
2Includes cases with pulmonary listed as the only site of disease.
3Includes cases with pleural, lymphatic, bone and/or joint, meningeal, peritoneal, genitourinary, or other site, excluding pulmonary, listed as the site of disease.
4Excludes New York City.
5Not included in U.S. totals.
Note: Seven cases had missing and/or unknown site of disease in the United States.
Ellipses (…) indicate that the percentage cannot be calculated, and the denominator is 0.