Unintentional Fall Deaths Among Adults Aged 65 and Over: United States, 2020
NCHS Data Brief No. 449, November 2022
PDF Version (1 MB)
- Key findings
- Men aged 65 and over had higher rates of unintentional fall deaths compared with women.
- Rates of unintentional fall deaths increased with age for all race and Hispanic-origin groups.
- In 2020, rates of unintentional fall deaths for adults aged 65 and over varied by state.
- Between 2000 and 2020, rates of unintentional fall deaths for adults aged 65 and over increased.
Data from the National Vital Statistics System
- In 2020, the unintentional fall death rate for adults aged 65 and over was higher for men (70.3 per 100,000 population) compared with women (61.8).
- Non-Hispanic White adults had the highest rates of unintentional fall deaths in 2020 compared with other race and Hispanic-origin groups.
- In 2020, the U.S. rate of unintentional fall deaths for adults aged 65 and over was 65.6, with rates varying by state.
- For both men and women, rates of unintentional fall deaths increased between 2000 and 2020 for adults aged 65–74, 75–84, and 85 and over.
Unintentional fall injuries occur most frequently among people in older age groups, with over 2 million fall events treated in emergency departments each year among adults aged 65 and over (1,2). A variety of factors contribute to the risk of falling, including difficulties in seeing, walking, and balance; disabilities; medication effects; and environmental walking obstacles, among other factors (3–6). Deaths due to unintentional falls are a leading cause of unintentional injury deaths among adults aged 65 and over (7). Reducing unintentional fall-related deaths among older adults is a key objective for Healthy People 2030 (8). This report presents unintentional fall death rates for adults aged 65 and over, by demographic characteristics.
Keywords: falls, older adults, mortality, race and Hispanic origin, National Vital Statistics System
Men aged 65 and over had higher rates of unintentional fall deaths compared with women.
- In 2020, the unintentional fall death rate for adults aged 65 and over was 70.3 per 100,000 population for men and 61.8 for women (Figure 1).
- For each age group, men had higher rates than women. Rates for adults aged 65 and over were lowest for those aged 65–74 (23.8 and 13.3 for men and women, respectively) and highest for those aged 85 and over (329.6 and 269.8 for men and women, respectively).
- For adults aged 65 and over, rates of unintentional fall deaths increased with age for both men and women.
Figure 1. Rate of unintentional fall deaths for adults aged 65 and over, by age and sex: United States, 2020
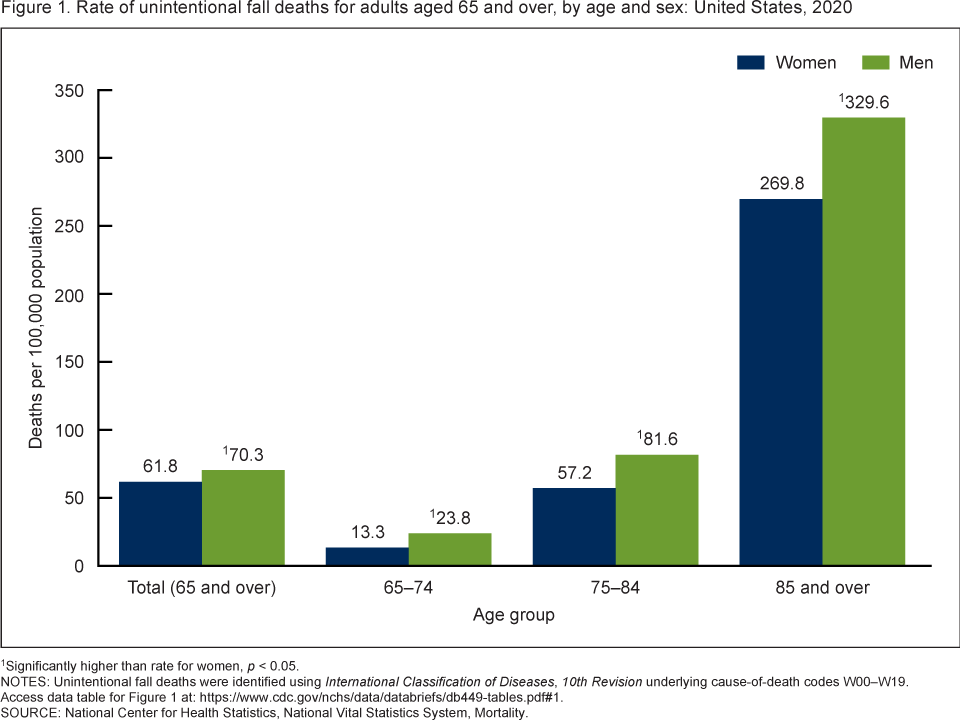
1Significantly higher than rate for women, p < 0.05.
NOTES: Unintentional fall deaths were identified using International Classification of Diseases, 10th Revision underlying cause-of-death codes W00–W19. Access data table for Figure 1.
SOURCE: National Center for Health Statistics, National Vital Statistics System, Mortality.
Rates of unintentional fall deaths increased with age for all race and Hispanic-origin groups.
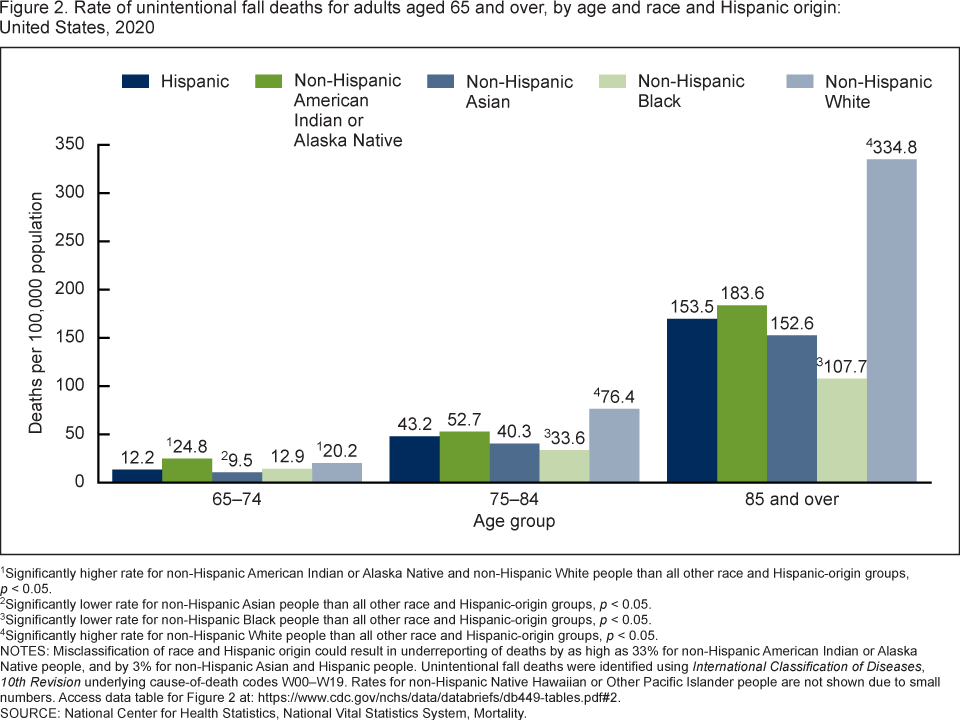
- For adults aged 65–74, non-Hispanic White (20.2 per 100,000 population) and non-Hispanic American Indian or Alaska Native (AIAN) (24.8) adults had the highest rates of unintentional fall deaths, and non-Hispanic Asian adults (9.5) had the lowest rate, with no significant differences between the remaining groups (Figure 2).
- For adults aged 75–84, non-Hispanic White adults had the highest rate (76.4) and non-Hispanic Black adults had the lowest rate (33.6), with no significant differences between the remaining groups.
- For adults aged 85 and over, non-Hispanic White adults had the highest rate (334.8) and non-Hispanic Black adults had the lowest rate (107.7), with no significant differences between the remaining groups.
- For older adults, the rate of unintentional fall deaths was greatest for those aged 85 and over for all race and Hispanic-origin groups.
Figure 2. Rate of unintentional fall deaths for adults aged 65 and over, by age and race and Hispanic origin: United States, 2020
1Significantly higher rate for non-Hispanic American Indian or Alaska Native and non-Hispanic White people than all other race and Hispanic-origin groups, p < 0.05.
2Significantly lower rate for non-Hispanic Asian people than all other race and Hispanic-origin groups, p < 0.05.
3Significantly lower rate for non-Hispanic Black people than all other race and Hispanic-origin groups, p < 0.05.
4Significantly higher rate for non-Hispanic White people than all other race and Hispanic-origin groups, p < 0.05.
NOTES: Misclassification of race and Hispanic origin could result in underreporting of deaths by as high as 33% for non-Hispanic American Indian or Alaska Native people, and by 3% for non-Hispanic Asian and Hispanic people. Unintentional fall deaths were identified using International Classification of Diseases, 10th Revision underlying cause-of-death codes W00–W19. Rates for non-Hispanic Native Hawaiian or Other Pacific Islander people are not shown due to small numbers. Access data table for Figure 2.
SOURCE: National Center for Health Statistics, National Vital Statistics System, Mortality.
In 2020, rates of unintentional fall deaths for adults aged 65 and over varied by state.
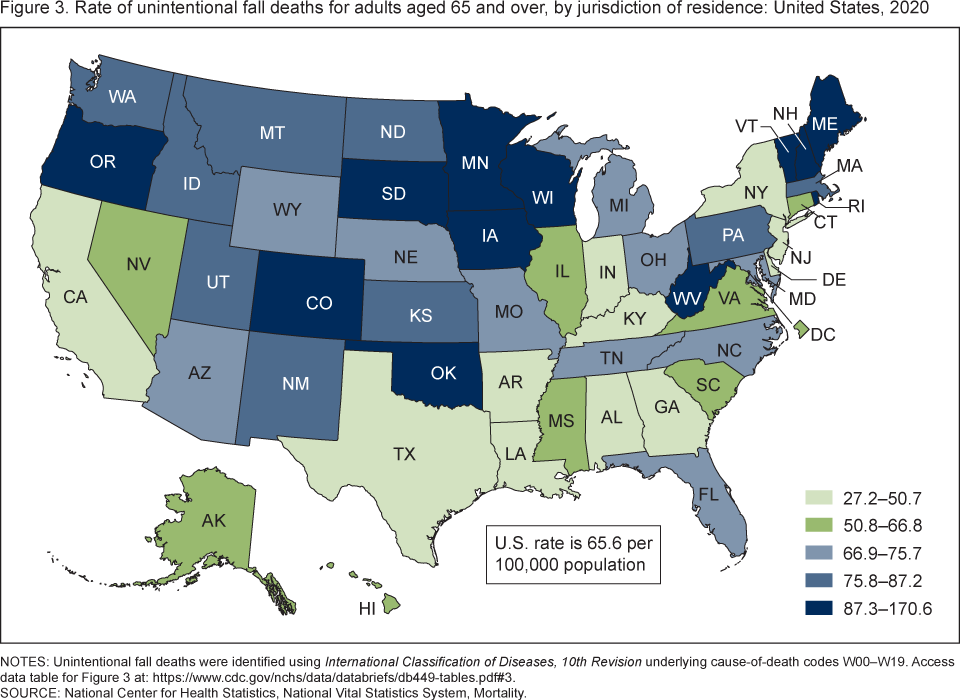
- In 2020, the national rate of unintentional fall deaths for adults aged 65 and over was 65.6 per 100,000 population, with rates ranging from 27.2 in Alabama to 170.6 in Wisconsin (Figure 3).
- The five states with the highest rates were Wisconsin (170.6), Vermont (133.0), Minnesota (120.5), South Dakota (120.2), and Maine (114.4).
- The five states with the lowest rates were Alabama (27.2), New Jersey (32.3), Arkansas (37.3), Louisiana (37.8), and Kentucky (39.7).
Figure 3. Rate of unintentional fall deaths for adults aged 65 and over, by jurisdiction of residence: United States, 2020
NOTES: Unintentional fall deaths were identified using International Classification of Diseases, 10th Revision underlying cause-of-death codes W00–W19. Access data table for Figure 3.
SOURCE: National Center for Health Statistics, National Vital Statistics System, Mortality.
Between 2000 and 2020, rates of unintentional fall deaths for adults aged 65 and over increased.
- Among men and women aged 65 and over, death rates due to unintentional falls increased for those aged 65–74, 75–84, and 85 and over between 2000 and 2020, with varying rates of change across each age group (Figure 4).
- Among adults aged 65–74, the rate for men increased from 11.9 per 100,000 population in 2000 to 23.8 in 2020, and the rate for women increased from 6.6 to 13.3.
- Among adults aged 75–84, the rate for men increased from 39.9 in 2000 to 81.6 in 2020, and the rate for women increased from 25.3 to 57.2.
- The greatest increase in rates for both men and women was among adults aged 85 and over. The rate for women nearly tripled from 99.2 in 2000 to 269.8 in 2020, while the rate doubled for men from 145.4 to 329.6 during the same period.
Figure 4. Rate of unintentional fall deaths for adults aged 65 and over, by age and sex: United States, 2000–2020
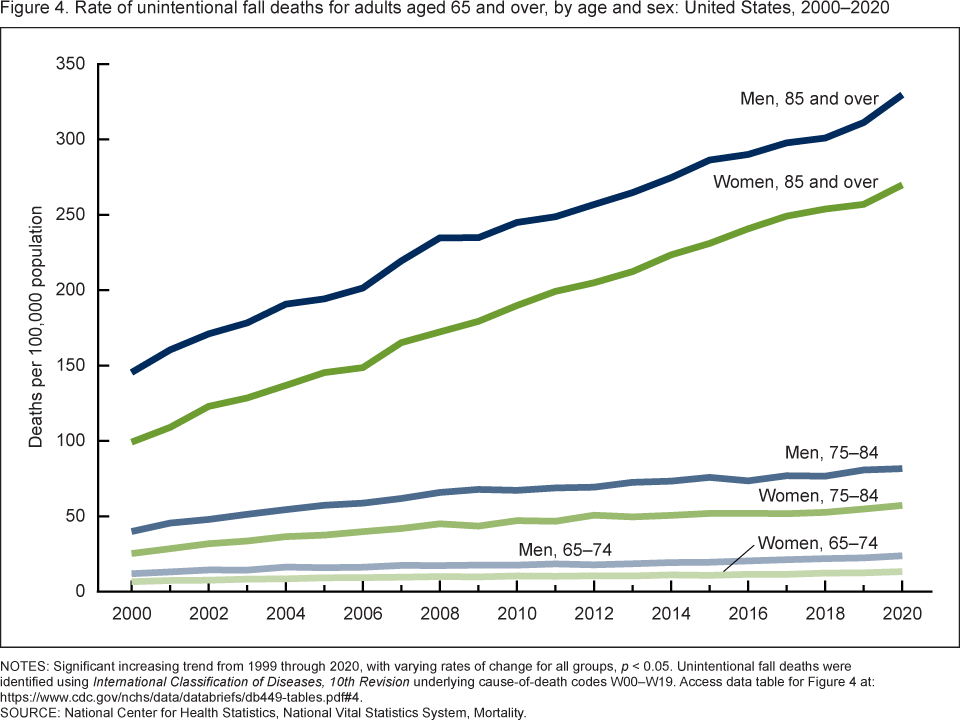
NOTES: Significant increasing trend from 1999 through 2020, with varying rates of change for all groups, p < 0.05. Unintentional fall deaths were identified using International Classification of Diseases, 10th Revision underlying cause-of-death codes W00–W19. Access data table for Figure 4.
SOURCE: National Center for Health Statistics, National Vital Statistics System, Mortality.
Summary
In 2020, the national rate of unintentional fall deaths for adults aged 65 and over was 65.6 deaths per 100,000 population. Rates ranged widely across the United States. Wisconsin had the highest rate (170.6), while Alabama had the lowest (27.2)—a more than sixfold difference in rates between the highest and lowest jurisdictions. From 2000 through 2020, rates for all examined age groups increased, with rates increasing the most for adults 85 and over for both men (from 145.4 in 2000 to 329.6 in 2020) and women (from 99.2 in 2000 to 269.8 in 2020). Men had rates that were higher than women for all examined age groups, a difference that was largest in the 65–74 age group and narrowed with increasing age.
Rates of unintentional fall deaths varied by race and Hispanic origin for adults aged 65–74 compared with those aged 74–84 and 85 and over. For deaths occurring among adults aged 65–74, non-Hispanic AIAN (24.8) and non-Hispanic White (20.2) adults had the highest rates, while non-Hispanic Asian adults had the lowest rates. However, for deaths that occurred among adults aged 75–84 and 85 and over, rates were highest for non-Hispanic White adults and lowest for non-Hispanic Black adults.
Data sources and methods
National Vital Statistics System underlying cause-of-death mortality data for 1999–2020 (9) were used to study unintentional fall deaths among adults aged 65 and over, by sex, age group, and race and Hispanic origin. Unintentional fall deaths were identified using International Classification of Diseases, 10th Revision (10) underlying cause-of-death codes W00–W19. Rates for non-Hispanic Native Hawaiian or Other Pacific Islander adults are not reported because of small numbers and unstable rates.
Crude rates (deaths per 100,000 population) were calculated. Pairwise comparisons of rates (such as crude rates for men compared with those for women) were conducted using a z test with an alpha level of 0.05 (two-sided) (11). Statistically significant differences between rates based on fewer than 100 deaths and other rates were determined by comparing 95% confidence intervals of the rates for the two groups. Consistent with other National Center for Health Statistics reports, 95% confidence intervals for rates with fewer than 100 deaths are based on the gamma distribution (11). Trends in death rates were evaluated using the Joinpoint Regression Program (Version 4.8.0.1) (12). Joinpoint software fitted weighted least-squares regression models to the rates on the log-transformation scale. The permutation tests for model (number of joinpoints) significance were set at an overall alpha level of 0.05 (13).
Race and Hispanic origin were categorized based on the Office of Management and Budget’s 1997 standards for federal statistical and administrative reporting (14). All of the race categories are “single race,” meaning that only one race was reported on the death certificate. Data shown for the Hispanic population include people of any race. Death rates for non-Hispanic Asian, non-Hispanic AIAN, and Hispanic people may be affected by misclassification of race and Hispanic origin on death certificates. This misclassification could result in underreporting of deaths for these groups, by about 3% for non-Hispanic Asian and Hispanic people, and by about 33% for non-Hispanic AIAN people (15,16).
About the authors
Matthew F. Garnett, Julie D. Weeks, and Merianne Rose Spencer are with the National Center for Health Statistics, Division of Analysis and Epidemiology.
References
- Centers for Disease Control and Prevention, National Center for Injury Prevention and Control. WISQARS–Web-based Injury Statistics Query and Reporting System.
- Moreland B, Lee R. Emergency department visits and hospitalizations for selected nonfatal injuries among adults aged ≥65 years—United States, 2018. MMWR 70(18):661–6. 2021.
- Sibley KM, Voth J, Munce SE, Straus SE, Jaglal SB. Chronic disease and falls in community-dwelling Canadians over 65 years old: A population-based study exploring associations with number and pattern of chronic conditions. BMC Geriatr 14(22). 2014.
- Salb J, Woodward C, Offenhäußer J, Becker C, Sieber C, Freiberger E. Prevalence and characteristics of falls in adults with intellectual disability living in a residential facility: A longitudinal study [PreFallID]. Intellect Dev Disabil 53(3):228–39. 2015.
- Cooper JW, Burfield AH. Medication interventions for fall prevention in the older adult. J Am Pharm Assoc 49(3):e70–84. 2003.
- Bergen G, Stevens MR, Kakara R, Burns ER. Understanding modifiable and unmodifiable older adult fall risk factors to create effective prevention strategies. Am J Lifestyle Med 15(6):580–9. 2019.
- Centers for Disease Control and Prevention. CDC WONDER. About multiple cause of death, 1999–2020. 2021.
- U.S. Department of Health and Human Services, Office of Disease Prevention and Health Promotion. Healthy People 2030 objectives and data: Injury prevention. 2022.
- National Center for Health Statistics. Public-use data file documentation: Mortality multiple cause-of-death files. 2018.
- World Health Organization. International statistical classification of diseases and related health problems, 10th revision (ICD–10). 2008 ed. 2009.
- Xu JQ, Murphy SL, Kochanek KD, Arias E. Deaths: Final data for 2019. National Vital Statistics Reports; vol 70 no 8. Hyattsville, MD: National Center for Health Statistics. 2021.
- National Cancer Institute. Joinpoint Regression Program (Version 4.8.0.1) [computer software]. 2020.
- Ingram DD, Malec DJ, Makuc DM, Kruszon-Moran D, Gindi RM, Albert M, et al. National Center for Health Statistics guidelines for analysis of trends. National Center for Health Statistics. Vital Health Stat 2(179). 2018.
- Office of Management and Budget. Revisions to the standards for the classification of federal data on race and ethnicity. Fed Regist 62(210):58782–90. 1997.
- Arias E, Heron M, Hakes JK. The validity of race and Hispanic-origin reporting on death certificates in the United States: An update. National Center for Health Statistics. Vital Health Stat 2(172). 2016.
- Arias E, Xu JQ, Curtin S, Bastian B, Tejada-Vera B. Mortality profile of the non-Hispanic American Indian or Alaska Native population, 2019. National Vital Statistics Reports; vol 70 no 12. Hyattsville, MD: National Center for Health Statistics. 2021.
Suggested citation
Garnett MF, Weeks JD, Spencer MR. Unintentional fall deaths among adults aged 65 and over: United States, 2020. NCHS Data Brief, no 449. Hyattsville, MD: National Center for Health Statistics. 2022. DOI: https://dx.doi.org/10.15620/cdc:121836.
Copyright information
All material appearing in this report is in the public domain and may be reproduced or copied without permission; citation as to source, however, is appreciated.
National Center for Health Statistics
Brian C. Moyer, Ph.D., Director
Amy M. Branum, Ph.D., Associate Director for Science
Division of Analysis and Epidemiology
Irma E. Arispe, Ph.D., Director
Kevin C. Heslin, Ph.D., Associate Director for Science