Suicide Mortality in the United States, 2000–2020
NCHS Data Brief No. 433, March 2022
PDF Version (422 KB)
Matthew F. Garnett, M.P.H., Sally C. Curtin, M.A., and Deborah M. Stone, Sc.D.
- Key findings
- For both males and females, suicide rates were lower in 2020 than in 2018 and 2019.
- Female suicide rates have declined recently for all age groups over age 25 but have generally increased for those aged 10–14 and 15–24.
- Suicide rates for males aged 45–64 and 65–74 significantly declined from 2018 to 2020.
- The leading means of suicide for females in 2020 was firearm-related, a change from previous years.
- For males, rates of firearm-related suicide have continued to increase.
Data from the National Vital Statistics System, Mortality
- After increasing from 2000 through 2018, the age-adjusted suicide rate declined from 2018 (14.2 per 100,000) to 2020 (13.5).
- Suicide rates for females in all age groups over age 25 showed recent declines, while rates for those aged 10–14 and 15–24 have generally increased.
- Between 2018 and 2020, suicide rates decreased in males aged 45–64 and 65–74.
- For females in 2020, the rate of firearm-related suicide (1.8) was higher than rates of suicide by poisoning (1.5) and suffocation (1.7).
- For males in 2020, the leading means of suicide was firearm (12.5), at a rate twice that of suffocation (6.1), the second leading means.
In 2020, suicide was the 12th leading cause of death for all ages in the United States, changing from the 10th leading cause in 2019 due to the emergence of COVID-19 deaths and increases in deaths from chronic liver disease and cirrhosis (1). As the second leading cause of death in people aged 10–34 and the fifth leading cause in people aged 35–54, suicide is a major contributor to premature mortality (1). Suicide rates increased from 2000 to 2018 (2–5), but recent data have shown declines between 2018 and 2020 (6,7). This report presents final suicide rates from 2000 through 2020, in total and by sex, age group, and means of suicide, using mortality data from the National Vital Statistics System (NVSS). This report updates a provisional 2020 report and a previous report with final data through 2019 (6,7).
Keywords: intentional self-harm, means of suicide, firearm, suffocation, poisoning, National Vital Statistics System
For both males and females, suicide rates were lower in 2020 than in 2018 and 2019.
- The overall suicide rate increased 30% between 2000 and 2020 (Figure 1). The total age-adjusted suicide rate increased from 10.4 per 100,000 in 2000 to a peak of 14.2 in 2018, followed by a 5% decline between 2018 and 2020 to 13.5.
- The suicide rate for males was stable from 2000 (17.7) through 2006 (18.1), and then increased from 2006 through 2018 (22.8). Rates in 2019 (22.4) and 2020 (22.0) were lower than the rate in 2018.
- The suicide rate for females increased from 2000 (4.0) through 2015 (6.0) and was stable from 2015 through 2018 (6.2). The rate then declined to 6.0 in 2019 and 5.5 in 2020.
- The suicide rate for males was 3–4 times the rate for females during the 2000–2020 period.
Figure 1. Age-adjusted suicide rates, by sex: United States, 2000–2020
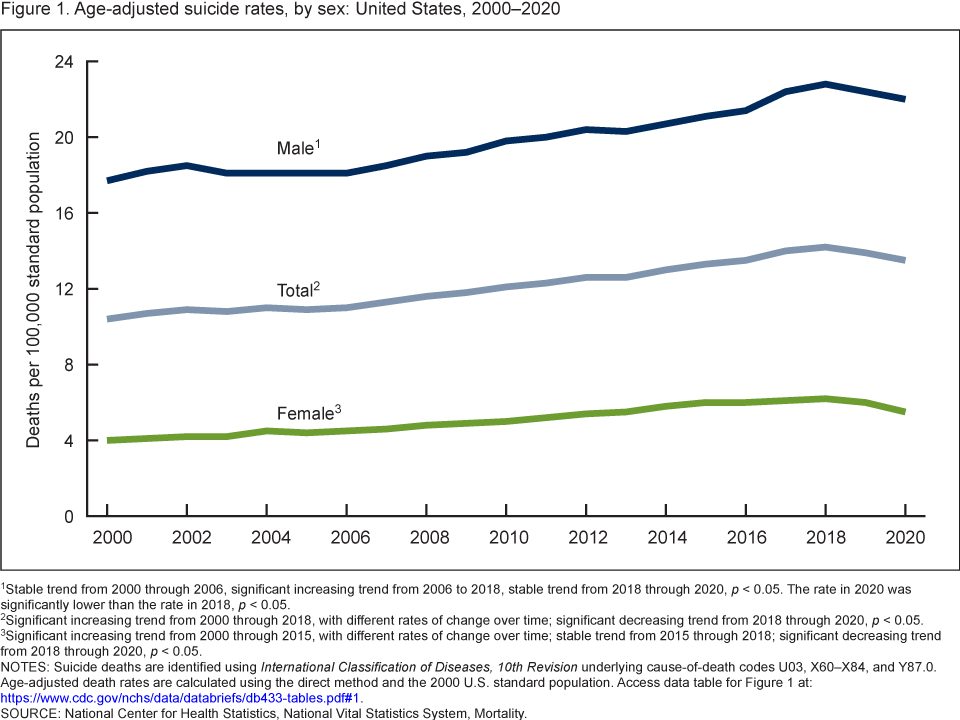
1Stable trend from 2000 through 2006, significant increasing trend from 2006 to 2018, stable trend from 2018 through 2020, p < 0.05. The rate in 2020 was significantly lower than the rate in 2018, p < 0.05.
2Significant increasing trend from 2000 through 2018, with different rates of change over time; significant decreasing trend from 2018 through 2020, p < 0.05.
3Significant increasing trend from 2000 through 2015, with different rates of change over time; stable trend from 2015 through 2018; significant decreasing trend from 2018 through 2020, p < 0.05.
NOTES: Suicide deaths are identified using International Classification of Diseases, 10th Revision underlying cause-of-death codes U03, X60–X84, and Y87.0. Age-adjusted death rates are calculated using the direct method and the 2000 U.S. standard population. Access data table for Figure 1.
SOURCE: National Center for Health Statistics, National Vital Statistics System, Mortality.
Female suicide rates have declined recently for all age groups over age 25 but have generally increased for those aged 10–14 and 15–24
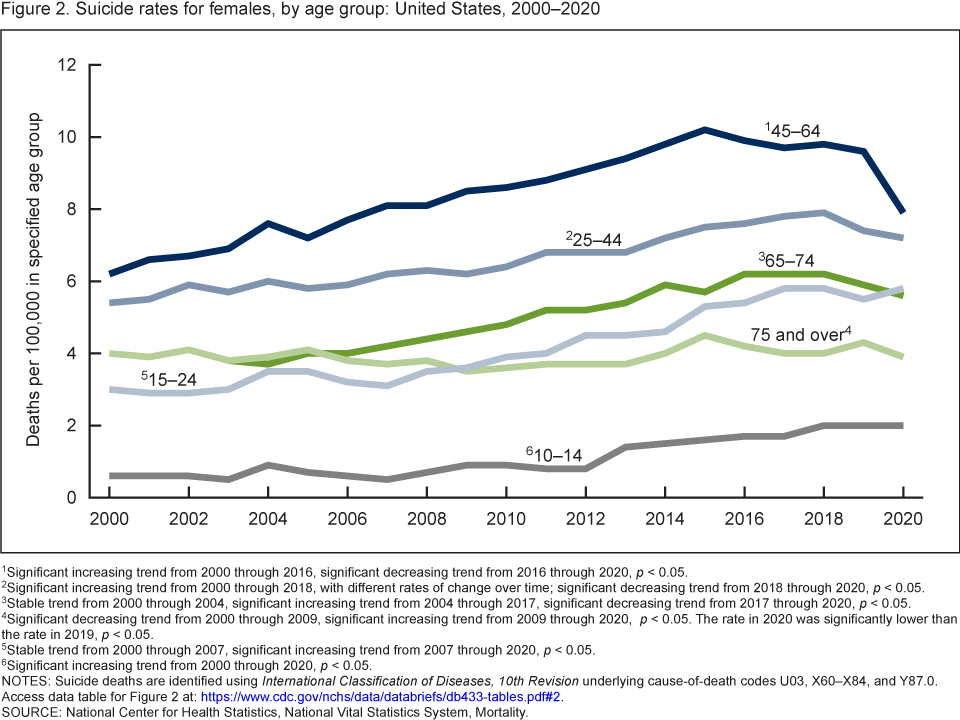
- Suicide rates decreased recently in females aged 25–44, 45–64, 65–74, and 75 and over (Figure 2).
- For females, suicide rates were highest for those aged 45–64 across the period. The rate increased from 6.2 in 2000 to a high of 10.2 in 2015, before declining through 2020 to 7.9.
- From 2000 through 2020, female suicide rates were consistently lowest among those aged 10–14; however, the rate more than tripled from 2000 (0.6) to 2020 (2.0).
- For females aged 15–24, rates were stable between 2000 (3.0) and 2007 (3.1), and then increased 87% through 2020 (5.8).
Figure 2. Suicide rates for females, by age group: United States,
2000–2020
1Significant increasing trend from 2000 through 2016, significant decreasing trend from 2016 through 2020, p < 0.05.
2Significant increasing trend from 2000 through 2018, with different rates of change over time; significant decreasing trend from 2018 through 2020, p < 0.05.
3Stable trend from 2000 through 2004, significant increasing trend from 2004 through 2017, significant decreasing trend from 2017 through 2020, p < 0.05.
4Significant decreasing trend from 2000 through 2009, significant increasing trend from 2009 through 2020, p < 0.05. The rate in 2020 was significantly lower than the rate in 2019, p < 0.05.
5Stable trend from 2000 through 2007, significant increasing trend from 2007 through 2020, p < 0.05.
6Significant increasing trend from 2000 through 2020, p < 0.05.
NOTES: Suicide deaths are identified using International Classification of Diseases, 10th Revision underlying cause-of-death codes U03, X60–X84, and Y87.0. Access data table for Figure 2.
SOURCE: National Center for Health Statistics, National Vital Statistics System, Mortality.
Suicide rates for males aged 45–64 and 65–74 significantly declined from 2018 to 2020.
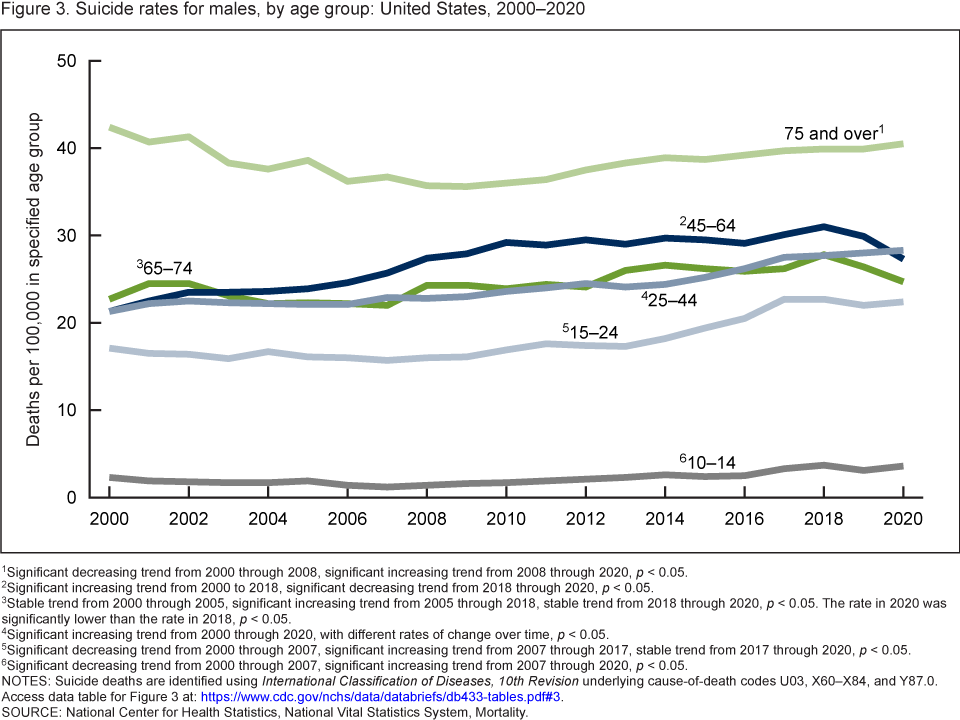
- From 2018 to 2020, suicide rates decreased in males aged 45–64 (from 31.0 to 27.3) and 65–74 (from 27.8 to 24.7) (Figure 3).
- From 2000 through 2020, male suicide rates were consistently highest in those aged 75 and over. Rates declined from 2000 (42.4) to 2008 (35.7), and then increased to 40.5 in 2020.
- From 2000 through 2020, male suicide rates were consistently lowest in those aged 10–14. Rates in males aged 10–14 declined from 2000 (2.3) to 2007 (1.2) and then increased to 3.6 in 2020.
- Rates generally increased over the study period for males aged 15–24 and 25–44, although the rate for males aged 15–24 was statistically unchanged after 2017.
Figure 3. Suicide rates for males, by age group: United States,
2000–2020
1Significant decreasing trend from 2000 through 2008, significant increasing trend from 2008 through 2020, p < 0.05.
2Significant increasing trend from 2000 to 2018, significant decreasing trend from 2018 through 2020, p < 0.05.
3Stable trend from 2000 through 2005, significant increasing trend from 2005 through 2018, stable trend from 2018 through 2020, p < 0.05. The rate in 2020 was significantly lower than the rate in 2018, p < 0.05.
4Significant increasing trend from 2000 through 2020, with different rates of change over time, p < 0.05.
5Significant decreasing trend from 2000 through 2007, significant increasing trend from 2007 through 2017, stable trend from 2017 through 2020, p < 0.05.
6Significant decreasing trend from 2000 through 2007, significant increasing trend from 2007 through 2020, p < 0.05.
NOTES: Suicide deaths are identified using International Classification of Diseases, 10th Revision underlying cause-of-death codes U03, X60–X84, and Y87.0. Access data table for Figure 3.
SOURCE: National Center for Health Statistics, National Vital Statistics System, Mortality.
The leading means of suicide for females in 2020 was firearm-related, a change from previous years.
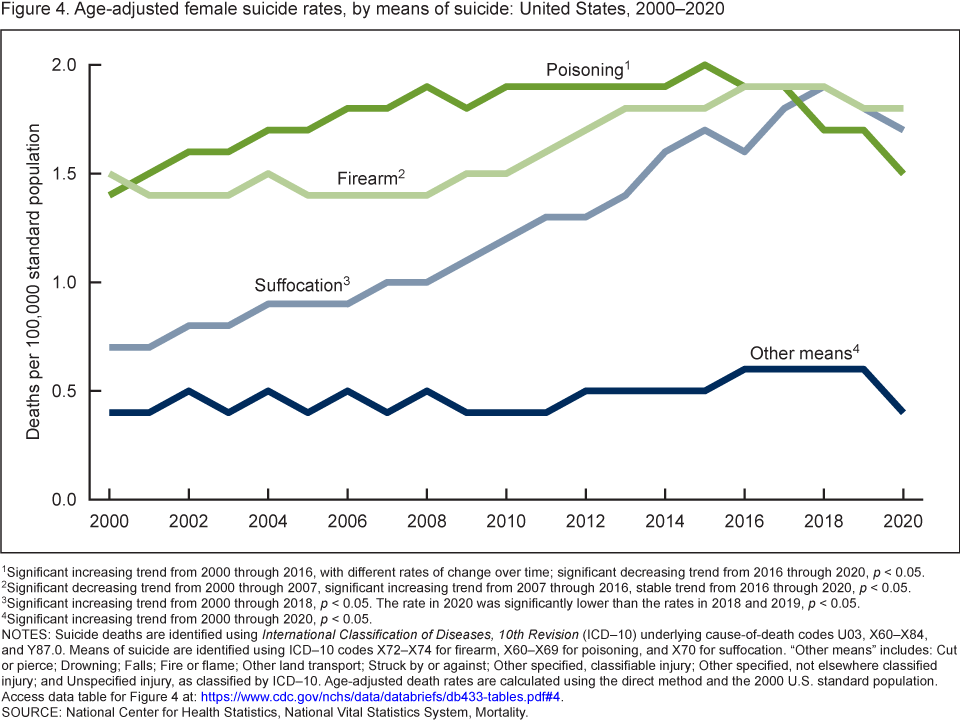
- Among females, the rate for firearm-related suicide increased from 1.4 in 2007 to 1.9 in 2016 and remained stable through 2020. Firearm-related suicide became the leading means for females in 2020 (Figure 4).
- Poisoning-related suicide was the leading means for females through 2015 but declined from 2016 (1.9) to 2020 (1.5).
- Among females, the rate for suffocation-related suicide (including hanging, asphyxiation, strangulation, and other means) more than doubled over the period, from 0.7 in 2000 to 1.7 in 2020. However, the rate in 2020 was significantly lower than in 2018 (1.9).
- Over the study period, differences in rates for firearm-, poisoning-, and suffocation-related suicide narrowed. In 2020, firearm-related suicide (1.8) had the highest rate among females, followed by suffocation (1.7) and poisoning (1.5).
Figure 4. Age-adjusted female suicide rates, by means of suicide: United States, 2000–2020
1Significant increasing trend from 2000 through 2016, with different rates of change over time; significant decreasing trend from 2016 through 2020, p < 0.05.
2Significant decreasing trend from 2000 through 2007, significant increasing trend from 2007 through 2016, stable trend from 2016 through 2020, p < 0.05.
3Significant increasing trend from 2000 through 2018, p < 0.05. The rate in 2020 was significantly lower than the rates in 2018 and 2019, p < 0.05.
4Significant increasing trend from 2000 through 2020, p < 0.05.
NOTES: Suicide deaths are identified using International Classification of Diseases, 10th Revision (ICD–10) underlying cause-of-death codes U03, X60–X84, and Y87.0. Means of suicide are identified using ICD–10 codes X72–X74 for firearm, X60–X69 for poisoning, and X70 for suffocation. “Other means” includes: Cut or pierce; Drowning; Falls; Fire or flame; Other land transport; Struck by or against; Other specified, classifiable injury; Other specified, not elsewhere classified injury; and Unspecified injury, as classified by ICD–10. Age-adjusted death rates are calculated using the direct method and the 2000 U.S. standard population. Access data table for Figure 4.
SOURCE: National Center for Health Statistics, National Vital Statistics System, Mortality.
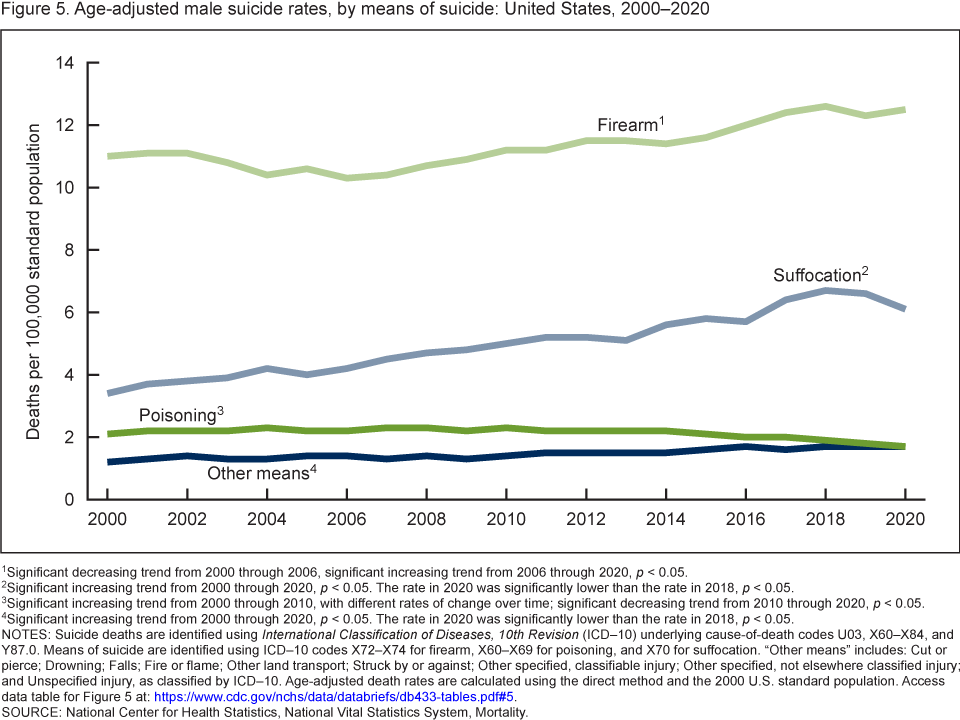
For males, rates of firearm-related suicide have continued to increase.
- Across the period, age-adjusted rates for firearm-related suicide in males were higher than for all other suicide means (Figure 5). The rate decreased from 11.0 per 100,000 in 2000 to 10.3 in 2006 and then increased to 12.5 in 2020.
- The rate for suffocation-related suicide nearly doubled from 2000 (3.4) to 2019 (6.6) and then decreased to 6.1 in 2020.
- The rate for poisoning-related suicide increased from 2.1 in 2000 to 2.3 in 2010 and then decreased to 1.7 in 2020.
- The difference in rates for firearm-related suicide and suffocation-related suicide narrowed over the period, from more than 3 times higher for firearms in 2000 (11.0 compared with 3.4) to 2 times higher in 2020 (12.5 compared with 6.1).
Figure 5. Age-adjusted male suicide rates, by means of suicide:
United States, 2000–2020
1Significant decreasing trend from 2000 through 2006, significant increasing trend from 2006 through 2020, p < 0.05.
2Significant increasing trend from 2000 through 2020, p < 0.05. The rate in 2020 was significantly lower than the rate in 2018, p < 0.05.
3Significant increasing trend from 2000 through 2010, with different rates of change over time; significant decreasing trend from 2010 through 2020, p < 0.05.
4Significant increasing trend from 2000 through 2020, p < 0.05. The rate in 2020 was significantly lower than the rate in 2018, p < 0.05.
NOTES: Suicide deaths are identified using International Classification of Diseases, 10th Revision (ICD–10) underlying cause-of-death codes U03, X60–X84, and Y87.0. Means of suicide are identified using ICD–10 codes X72–X74 for firearm, X60–X69 for poisoning, and X70 for suffocation. “Other means” includes: Cut or pierce; Drowning; Falls; Fire or flame; Other land transport; Struck by or against; Other specified, classifiable injury; Other specified, not elsewhere classified injury; and Unspecified injury, as classified by ICD–10. Age-adjusted death rates are calculated using the direct method and the 2000 U.S. standard population. Access data table for Figure 5.
SOURCE: National Center for Health Statistics, National Vital Statistics System, Mortality.
Summary
This report presents suicide rates from 2000 through 2020, highlighting differences for males and females in trends by age and means of suicide. Overall during the study period, the national age-adjusted suicide rate increased by 30% from 10.4 per 100,000 in 2000 to 13.5 in 2020. After a long period of increasing rates, the rate peaked in 2018 (14.2) and has since declined to 13.5 in 2020, a 5% decrease.
Suicide rates were 3–4 times higher for males compared with females across the period, with both groups having lower rates in 2020 compared with 2018 and 2019. For females, rates for age groups 10–14 and 15–24 generally increased, while rates declined recently for the 25–44, 45–64, 65–74, and 75 and over age groups. For males, suicide rates in the 45–64 and 65–74 age groups declined recently, while rates among the 10–14, 15–24, and 75 and over age groups have generally increased.
For females, firearm-related suicide has recently replaced poisoning as the leading means of suicide. Poisoning-related suicide rates have been declining since 2016, while firearm rates—which had steadily increased before 2016—have remained stable. Rates of suffocation-related suicide for females increased over the period and surpassed poisoning in 2020. Among males, rates of firearm-related suicide have been increasing since 2006 and are consistently higher than suffocation, poisoning, and other means. Suffocation-related suicide remained the second leading means of suicide in males across the study period. The difference between firearm- and suffocation-related suicide rates narrowed as suffocation-related rates increased faster over time. In 2020, the rate of firearm-related suicide among males was twice as high as the rate for suffocation-related suicide, compared with three times as high in 2000.
Data sources and methods
Data were analyzed using NVSS multiple cause-of-death mortality files for 2000 through 2020 (8). Suicide deaths were identified using International Classification of Diseases, 10th Revision (ICD–10) underlying cause-of-death codes U03, X60–X84, and Y87.0 (9). Means of suicide were identified using ICD–10 codes X72–X74 for firearm, X60–X69 for poisoning, and X70 for suffocation. “Other means” includes: Cut or pierce; Drowning; Falls; Fire or flame; Other land transport; Struck by or against; Other specified, classifiable injury; Other specified, not elsewhere classified injury; and Unspecified injury, as classified by ICD–10.
Age-adjusted death rates were calculated using the direct method and the 2000 U.S. standard population (10). Although suicide deaths for people aged 5–9 years are included in total numbers and age-adjusted rates, they are not shown as part of age-specific numbers or rates because of the small number of suicide deaths per year in this age group.
Trends in death rates were evaluated using the Joinpoint Regression Program (4.9.0.0) (11). The Joinpoint software was used to fit weighted least-squares regression models to the estimated proportions on the logarithmic scale. Using the default settings, which allowed for as few as two observed time points in the beginning, ending, and middle line segments (excluding the joinpoints), a maximum of three joinpoints were searched for using the grid search algorithm and the permutation test with an overall alpha level of 0.05 (12). Pairwise comparisons of rates were conducted using the z test with an alpha level of 0.05 (10).
About the authors
Matthew F. Garnett is with the National Center for Health Statistics (NCHS), Division of Analysis and Epidemiology; Sally C. Curtin is with NCHS, Division of Vital Statistics; and Deborah M. Stone is with the National Center for Injury Prevention and Control, Division of Injury Prevention.
References
- National Center for Health Statistics. About multiple cause of death, 1999–2020. CDC WONDER online database. 2021.
- Stone DM, Simon TR, Fowler KA, Kegler SR, Yuan K, Holland KM, et al. Vital signs: Trends in state suicide rates—United States, 1999–2016 and circumstances contributing to suicide—27 states, 2015. MMWR Morb Mortal Wkly Rep 67(22):617–24. 2018.
- Pettrone K, Curtin SC. Urban–rural differences in suicide rates, by sex and three leading methods: United States, 2000–2018. NCHS Data Brief, no 373. Hyattsville, MD: National Center for Health Statistics. 2020.
- Hedegaard H, Curtin SC, Warner M. Increase in suicide mortality in the United States, 1999–2018. NCHS Data Brief, no 362. Hyattsville, MD: National Center for Health Statistics. 2020.
- Curtin SC. State suicide rates among adolescents and young adults aged 10–24:
United States, 2000–2018. National Vital Statistics Reports; vol 69 no 11. Hyattsville, MD: National Center for Health Statistics. 2020. - Hedegaard H, Curtin SC, Warner M. Suicide mortality in the United States, 1999–2019. NCHS Data Brief, no 398. Hyattsville, MD: National Center for Health Statistics. 2021.
- Curtin SC, Hedegaard H, Ahmad FB. Provisional numbers and rates of suicide by month and demographic characteristics: United States, 2020. Vital Statistics Rapid Release; no 16. Hyattsville, MD: National Center for Health Statistics. November 2021. DOI: https://dx.doi.org/10.15620/cdc:110369.
- National Center for Health Statistics. Public-use data files: Mortality multiple cause files. 2020.
- World Health Organization. International statistical classification of diseases and related health problems, 10th revision (ICD–10). 2008 ed. Geneva, Switzerland. 2009.
- Xu JQ, Murphy SL, Kochanek KD, Arias E. Deaths: Final data for 2019. National Vital Statistics Reports; vol 70 no 8. Hyattsville, MD: National Center for Health Statistics. 2021. DOI: https://dx.doi.org/10.15620/cdc:106058
- National Cancer Institute. Joinpoint Regression Program (Version 4.8.0.1) [computer software]. 2020.
- Ingram DD, Malec DJ, Makuc DM, Kruszon-Moran D, Gindi RM, Albert M, et al. National Center for Health Statistics guidelines for analysis of trends. National Center for Health Statistics. Vital Health Stat 2(179). 2018.
Suggested citation
Garnett MF, Curtin SC, Stone DM. Suicide mortality in the United States, 2000–2020. NCHS Data Brief, no 433. Hyattsville, MD: National Center for Health Statistics. 2022. DOI: https://dx.doi.org/10.15620/cdc:114217
Copyright information
All material appearing in this report is in the public domain and may be reproduced or copied without permission; citation as to source, however, is appreciated.
National Center for Health Statistics
Brian C. Moyer, Ph.D., Director
Amy M. Branum, Ph.D., Associate Director for Science
Division of Analysis and Epidemiology
Irma E. Arispe, Ph.D., Director
Kevin C. Heslin, Ph.D., Associate Director for Science
Division of Vital Statistics
Steven Schwartz, Ph.D., Director
Isabelle Horon, Dr.P.H., Acting Associate Director for Science