Characteristics of Office-based Physician Visits, 2018
NCHS Data Brief No. 408, May 2021
PDF Versionpdf icon (592 KB)
- Key findings
- Do office-based physician visit rates vary by patient age and sex?
- What was the primary expected source of payment at office-based physician visits, and did it vary by age?
- What were the major reasons for office-based physician visits?
- What services were ordered or provided at office-based physician visits, and did they vary by age?
- Summary
Data from the National Ambulatory Medical Care Survey
- In 2018, there were an estimated 267 office-based physician visits per 100 persons.
- The visit rate among females was higher than for males, and the rates for both infants and older adults were higher than the rates for those aged 1–64.
- Private insurance was the primary expected source of payment for most visits by children under age 18 years and adults aged 18–64, whereas Medicare was the primary expected source of payment for most visits by adults aged 65 and over.
- Compared with adults, a larger percentage of visits by children were for either preventive care or a new problem.
- Compared with children, a larger percentage of visits by adults included an imaging service that was ordered or provided.
In 2018, 85% of adults and 96% of children in the United States had a usual place to receive health care (1,2). Most children and adults listed a doctor’s office as the usual place they received care (1,2). In 2018, an estimated 860.4 million office-based physician visits occurred in the United States (3,4). This report examines visit rates by age and sex. It also examines visit characteristics—including insurance status, reason for visit, and services—by age using data from the 2018 National Ambulatory Medical Care Survey (NAMCS).
Keywords: ambulatory health care, insurance, NAMCS
Do office-based physician visit rates vary by patient age and sex?
- In 2018, there were 267 office-based physician visits per 100 persons (Figure 1).
- The visit rate for both infants under age 1 year (596 per 100 infants) and adults aged 65 and over (550 per 100 adults aged 65 and over) was higher than the rate for children aged 1–17 years, (153 per 100 children aged 1–17 years), adults aged 18–44 (173 per 100 adults aged 18–44), and adults aged 45–64 (302 per 100 adults aged 45–64).
- The visit rate for adults aged 45–64 was lower than the rates for both infants and adults aged 65 and over and higher than the rates for children aged 1–17 and adults aged 18–44.
- The visit rate among females (308 visits per 100 females) was higher than the rate for males (224 visits per 100 males).
Figure 1. Visit rates, by selected demographics: United States, 2018
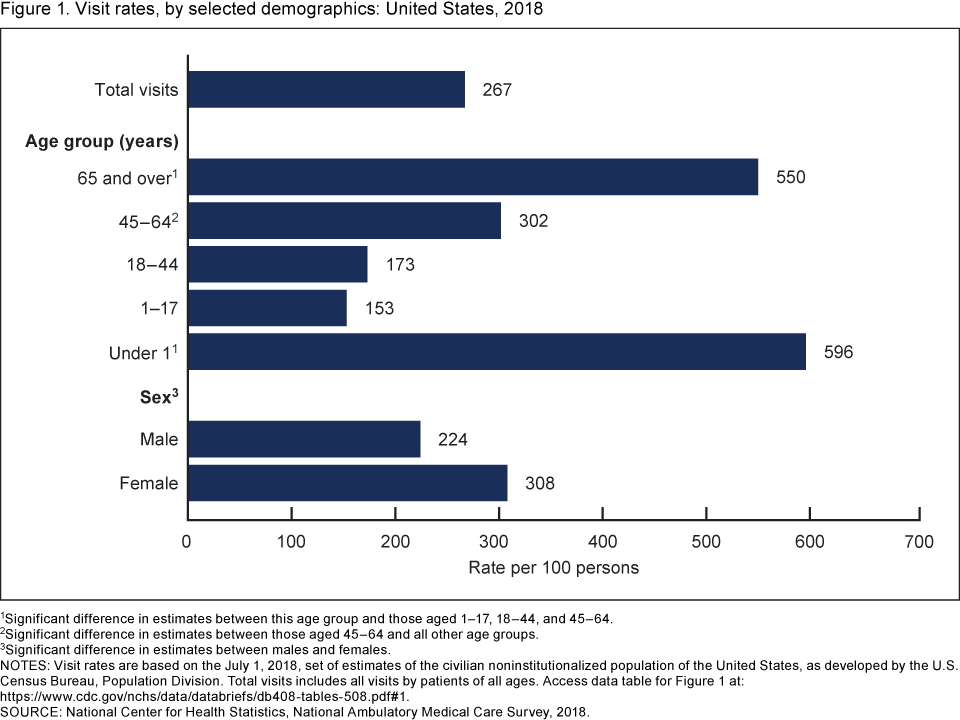 image icon
1Significant difference in estimates between this age group and those aged 1–17, 18–44, and 45–64.
2Significant difference in estimates between those aged 45–64 and all other age groups.
3Significant difference in estimates between males and females.
NOTES: Visit rates are based on the July 1, 2018, set of estimates of the civilian noninstitutionalized population of the United States, as developed by the U.S. Census Bureau, Population Division. Total visits includes all visits by patients of all ages. Access data table for Figure 1pdf icon.
SOURCE: National Center for Health Statistics, National Ambulatory Medical Care Survey, 2018.
What was the primary expected source of payment at office-based physician visits, and did it vary by age?
- Private insurance was the primary expected source of payment at one-half (50%) of all office-based physician visits, followed by Medicare (29%), Medicaid (12%), and no insurance (7%) (Figure 2).
- Private insurance was the primary expected source of payment for most visits by children under age 18 years (64%) and adults aged 18–64 (67%), whereas Medicare was the primary expected source of payment for most visits by adults aged 65 and over (80%).
- Medicaid as the primary expected source of payment decreased with increasing age: 30% among under 18, 14% among 18–64, and 2% among 65 and over.
- No insurance or self-pay as the primary expected source of payment varied by age: 11% among 18–64, 3% among under 18, and 2% among 65 and over.
Figure 2. Primary expected source of payment, by age: United States, 2018
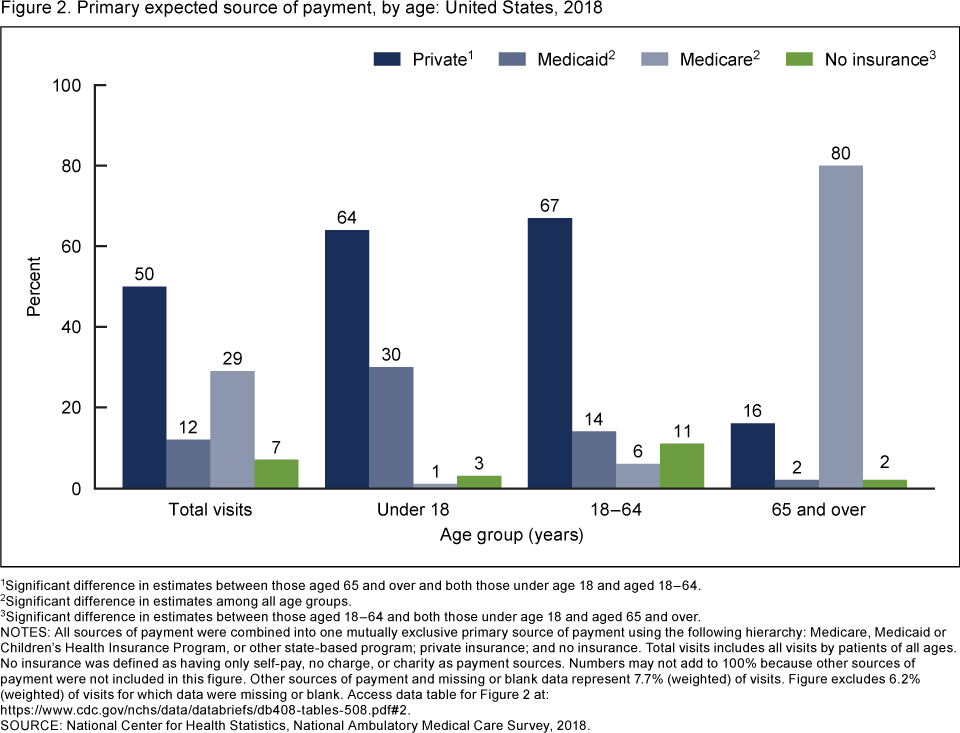 image icon
1Significant difference in estimates between those aged 65 and over and both those under age 18 and aged 18–64.
2Significant difference in estimates among all age groups.
3Significant difference in estimates between those aged 18–64 and both those under age 18 and aged 65 and over.
NOTES: All sources of payment were combined into one mutually exclusive primary source of payment using the following hierarchy: Medicare, Medicaid or Children’s Health Insurance Program, or other state-based program; private insurance; and no insurance. Total visits includes all visits by patients of all ages. No insurance was defined as having only self-pay, no charge, or charity as payment sources. Numbers may not add to 100% because other sources of payment were not included in this figure. Other sources of payment and missing or blank data represent 7.7% (weighted) of visits. Figure excludes 6.2% (weighted) of visits for which data were missing or blank. Access data table for Figure 2pdf icon.
SOURCE: National Center for Health Statistics, National Ambulatory Medical Care Survey, 2018.
What were the major reasons for office-based physician visits?
- A chronic condition was listed as the major reason for 39% of all office-based physician visits, followed by a new problem (24%), preventive care (23%), pre- or postsurgery care (8%), and an injury (6%) (Figure 3).
- Compared with children, a larger percentage of visits by adults listed chronic conditions (13% compared with 38% among 18–64 and 52% among 65 and over) and pre- or postsurgery care (1% compared with 11% among 18–64 and 8% among 65 and over) as the major reason for visit.
- Preventive care as the major reason for visit decreased as age increased: 38% for under 18, 23% for 18–64, and 16% for 65 and over. This same decreasing pattern was seen for a new problem: 43% for under 18, 22% for 18–64, and 18% for 65 and over.
- The percentage of visits that listed injury as the major reason for the visit was similar by age: 5% for children and adults aged 65 and over, and 6% for adults aged 18–64.
Figure 3. Major reasons for office-based physician visits, by age: United States, 2018
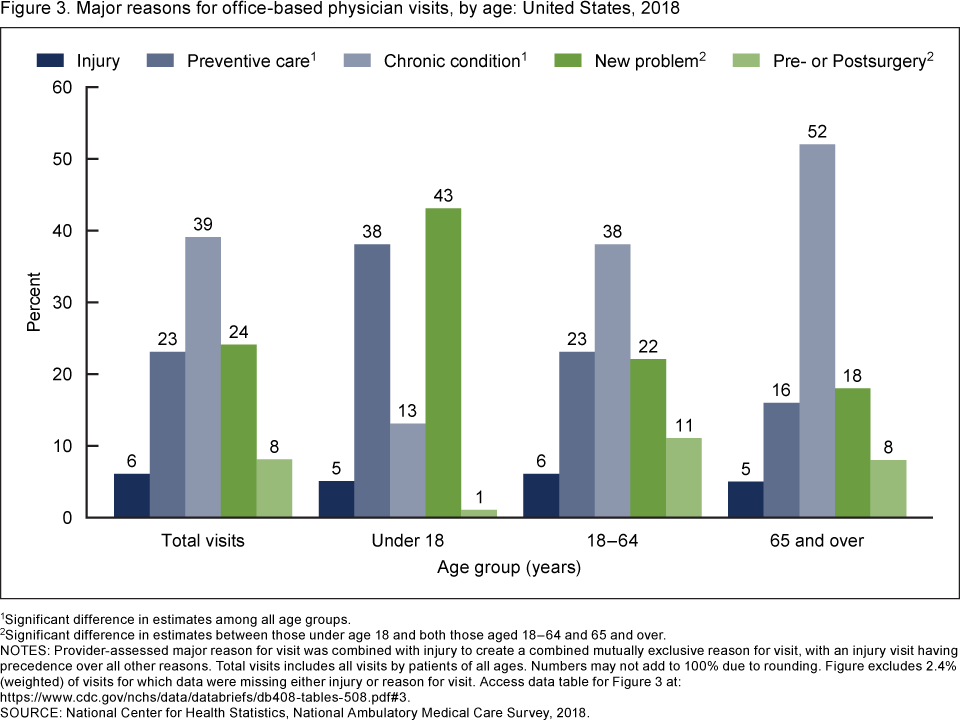 image icon
1Significant difference in estimates among all age groups.
2Significant difference in estimates between those under age 18 and both those aged 18–64 and 65 and over.
NOTES: Provider-assessed major reason for visit was combined with injury to create a combined mutually exclusive reason for visit, with an injury visit having precedence over all other reasons. Total visits includes all visits by patients of all ages. Numbers may not add to 100% due to rounding. Figure excludes 2.4% (weighted) of visits for which data were missing either injury or reason for visit. Access data table for Figure 3pdf icon.
SOURCE: National Center for Health Statistics, National Ambulatory Medical Care Survey, 2018.
What services were ordered or provided at office-based physician visits, and did they vary by age?
- An examination or screening was ordered or provided at almost one-half (45%) of all office-based physician visits, followed by laboratory tests (24%), health education or counseling (19%), imaging (13%), and procedures (11%) (Figure 4).
- A higher percentage of examinations or screenings was ordered or provided at visits by children (57%) than adults (44% for 18–64 and 42% for 65 and over), but a lower percentage of imaging services was ordered or provided at visits by children (3%) than those aged 18–64 (15%) and 65 and over (14%).
- A lower percentage of health education or counseling services was ordered or provided at visits by adults aged 65 and over (13%) compared with younger adults (20%) and children (28%), but a higher percentage of laboratory tests was ordered or provided at visits by adults aged 18–64 (26%) compared with children (18%).
- The percentage of visits with a procedure ordered or provided was similar by age: 9% for children, 10% for adults aged 18–64, and 12% for adults aged 65 and over.
Figure 4. Selected services ordered or provided at office-based physician visits, by age: United States, 2018
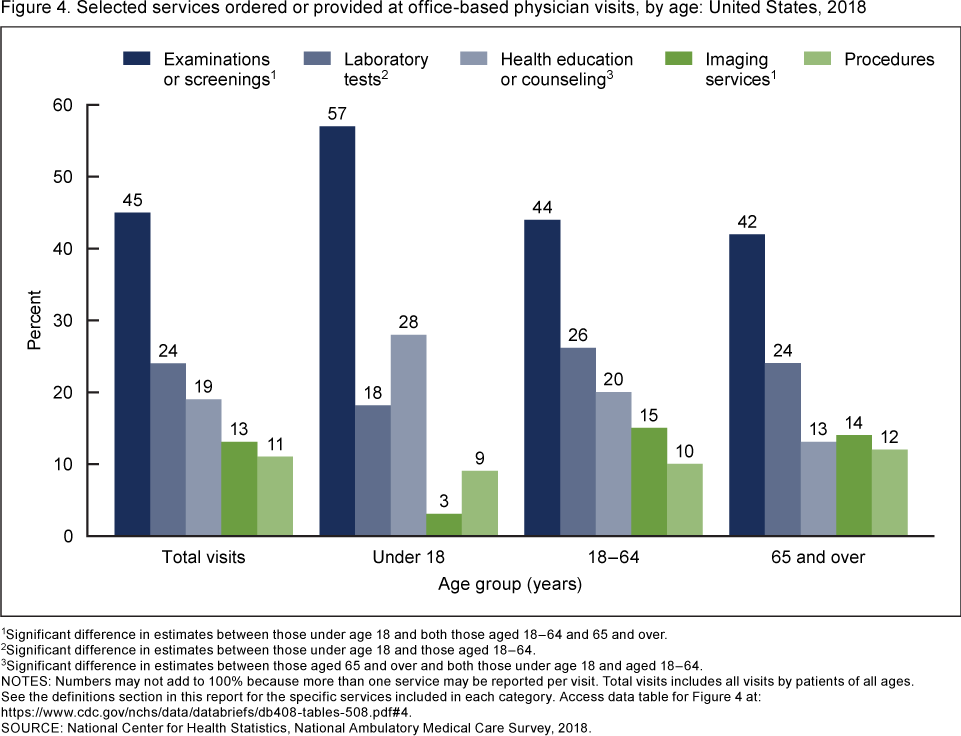 image icon
1Significant difference in estimates between those under age 18 and both those aged 18–64 and 65 and over.
2Significant difference in estimates between those under age 18 and those aged 18–64.
3Significant difference in estimates between those aged 65 and over and both those under age 18 and aged 18–64.
NOTES: Numbers may not add to 100% because more than one service may be reported per visit. Total visits includes all visits by patients of all ages. See the definitions section in this report for the specific services included in each category. Access data table for Figure 4pdf icon.
SOURCE: National Center for Health Statistics, National Ambulatory Medical Care Survey, 2018.
Summary
During 2018, the overall rate of office-based physician visits was 267 visits per 100 persons. The visit rate for infants and older adults was higher than the rate for other age groups. The visit rate for females was higher than the rate for males. Most visits by children (64%) and adults aged 18–64 (67%) listed private insurance as the primary expected source of payment, whereas most visits by older adults listed Medicare as the primary expected source of payment (80%). Approximately 7% of office-based physician visits were made by those with no insurance. A higher percentage of visits by adults aged 18–64 (11%) had no insurance compared with adults aged 65 and over (2%) and children (3%). A chronic condition was the major reason for 39% of all office-based physician visits, and visits for chronic conditions were higher among adults than children. A higher percentage of visits by children than adults were for a new problem or preventive care, whereas the reverse was true for visits related to pre- or postsurgery care. Almost one-half (45%) of all office-based physician visits included an examination or screening that was ordered or provided. Compared with adults aged 65 and over, a higher percentage of visits by children and younger adults included health education or counseling. Compared with children, a higher percentage of visits by adults included imaging services.
Definitions
Major reason for this visit: A variable was created by merging the “INJURY” variable with the provider-assessed major reason for this visit (5). Injury was given preference over all other reasons. The five categories for major reason for this visit included:
- Chronic condition: A visit primarily to receive care or examination for a preexisting chronic condition or illness (onset of condition was 3 months or more before this visit). Includes both routine visits and flare-ups; a visit primarily due to a sudden exacerbation of a preexisting chronic condition.
- Injury: A visit defined as injury or poisoning related, based on any listed reason for visit and diagnosis (5). In 2018, the definition of injury used the International Classification of Diseases, 10th Revision, Clinical Modification to code injury and poisoning diagnoses.
- New problem: A visit for a condition or illness having a relatively sudden or recent onset (within 3 months of this visit).
- Pre- or postsurgery: A visit scheduled primarily for care required prior to or following surgery (e.g., presurgery tests or removing sutures).
- Preventive care: General medical examinations and routine periodic examinations. Includes prenatal care, annual physicals, well-child examinations, screening, and insurance examinations.
Selected services: Services that were ordered or provided during the sampled visit for the purpose of screening (i.e., early detection of health problems in asymptomatic individuals) or diagnosis (i.e., identification of health problems causing individuals to be symptomatic) are included (5). Each selected service item was grouped into five categories:
- Examinations or screenings: Includes alcohol misuse, breast, depression, domestic violence, foot, neurologic, pelvic, rectal, retinal or eye, skin, and substance misuse.
- Health education or counseling: Includes alcohol abuse counseling, asthma, asthma action plan given to patient, diabetes education, diet or nutrition, exercise, family planning or contraception, genetic counseling, growth or development, injury prevention, sexually transmitted disease prevention, stress management, substance abuse counseling, tobacco use or exposure, and weight reduction.
- Imaging services: Includes bone mineral density, CT scan, echocardiogram, ultrasound, mammography, MRI, and X-ray.
- Laboratory tests: Includes basic metabolic panel, complete blood count, comprehensive metabolic panel, creatinine or renal function panel, culture (blood, throat, urine, or other), glucose, chlamydia test, gonorrhea test, HbA1c, hepatitis testing, HIV test, human papillomavirus DNA test, lipid profile, liver enzymes or hepatic function panel, pap test, pregnancy or HCG test, prostate-specific antigen, rapid strep test, thyroid-stimulating hormone or thyroid panel, urinalysis, and vitamin D test.
- Procedures: Includes audiometry, biopsy, cardiac stress test, colonoscopy, cryosurgery or destruction of tissue, EKG or ECG, electroencephalogram, electromyogram, excision of tissue, fetal monitoring, peak flow, sigmoidoscopy, spirometry, tonometry, tuberculosis skin testing, and upper gastrointestinal endoscopy.
Data source and methods
Data for this report are from NAMCS, which is conducted by the National Center for Health Statistics. NAMCS is an annual, nationally representative survey of office-based physicians and visits to their practices (3,5). The target universe of NAMCS is physicians classified as providing direct patient care in office-based practices. Radiologists, anesthesiologists, and pathologists are excluded, as are physicians in community health centers. The 2018 sample consisted of 2,999 physicians. Participating physicians provided 9,953 visit records. The participation rate—the percentage of in-scope physicians for whom at least one visit record was completed—was 35.2%. The response rate—the percentage of in-scope physicians for whom at least one-half of their expected number of visit records was completed—was 31.1%. An iterative proportional fitting procedure was used to adjust NAMCS weights for nonresponse bias (5).
Data analyses were performed using the statistical packages SAS version 9.4 (SAS Institute, Cary, N.C.) and SAS-callable SUDAAN version 11.0 (RTI International, Research Triangle Park, N.C.). Differences in the distribution of selected characteristics of office-based physician visits were based on chi-square tests (p < 0.05). If a difference was found to be statistically significant, additional pairwise tests were performed. Statements of difference in paired estimates were based on two-tailed t tests with statistical significance at the p < 0.05 level. Terms such as “higher” or “lower” indicate that the differences were statistically significant.
About the authors
Jill J. Ashman, Loredana Santo, and Titilayo Okeyode are with the National Center for Health Statistics, Division of Health Care Statistics.
References
- Black LI, Benson V. Table C-7a. Age-adjusted percentages (with standard errors) of having a usual place of health care, and age-adjusted percent distributions of type of place, for children under age 18 years, by selected characteristics: United States, 2018. Tables of Summary Health Statistics for U.S. Children: 2018 National Health Interview Surveypdf icon. National Center for Health Statistics. 2019.
- Villarroel MA, Blackwell DL, Jen A. Table A-16a. Age-adjusted percent distributions (with standard errors) of having a usual place of health care and of type of place, among adults aged 18 and over, by selected characteristics: United States, 2018. Tables of Summary Health Statistics for U.S. Adults: 2018 National Health Interview Surveypdf icon. National Center for Health Statistics. 2019.
- National Center for Health Statistics. 2018 NAMCS micro-data file. 2021.
- Santo L, Okeyode T. National Ambulatory Medical Care Survey: 2018 National Summary Tables. National Center for Health Statistics. 2021. [Forthcoming].
- National Center for Health Statistics. 2018 NAMCS micro-data file documentation. 2021.
Suggested citation
Ashman JJ, Santo L, Okeyode T. Characteristics of office-based physician visits, 2018. NCHS Data Brief, no 408. Hyattsville, MD: National Center for Health Statistics. 2021. DOI: https://dx.doi.org/10.15620/cdc:105509external icon.
Copyright information
All material appearing in this report is in the public domain and may be reproduced or copied without permission; citation as to source, however, is appreciated.
National Center for Health Statistics
Brian C. Moyer, Ph.D., Director
Amy M. Branum, Ph.D., Acting Associate Director for Science
Division of Health Care Statistics
Carol J. DeFrances, Ph.D., Acting Director
Alexander Strashny, Ph.D., Associate Director for Science