Symptoms of Generalized Anxiety Disorder Among Adults: United States, 2019
- Key findings
- Over 15% of adults experienced symptoms of anxiety that were either mild, moderate, or severe in the past 2 weeks.
- The percentage of adults who experienced mild, moderate, or severe symptoms of anxiety in the past 2 weeks decreased with age. name=
- Women were more likely than men to experience mild, moderate, or severe anxiety symptoms in the past 2 weeks.
- The percentage of adults who experienced anxiety symptoms in the past 2 weeks varied by Hispanic origin and race.
- Summary
- Definitions
- Data source and methods
- About the authors
- References
- Suggested citation
NCHS Data Brief No. 378, September 2020
PDF Versionpdf icon (411 KB)
Key findings
Data from the National Health Interview Survey
- During 2019, 9.5%, 3.4%, and 2.7% of adults experienced mild, moderate, or severe symptoms of anxiety in the past 2 weeks, respectively, while 84.4% experienced no or minimal symptoms.
- The percentage of adults who experienced mild, moderate, or severe symptoms of anxiety was highest among those aged 18–29 and decreased with age.
- Women were more likely to experience mild, moderate, or severe symptoms of anxiety than men.
- Non-Hispanic Asian adults were least likely to experience mild, moderate, or severe symptoms of anxiety compared with Hispanic, non-Hispanic white, and non-Hispanic black adults.
Generalized anxiety disorder (GAD) is characterized by excessive worry that is difficult to control accompanied by physical symptoms including restlessness, being easily fatigued, difficulty concentrating, irritability, muscle tension, or sleep disturbance (1). The GAD–7 scale is a validated brief self-report measure to screen for GAD and assess the severity of symptoms (2). Adults with GAD–7 scores of 0–4 are considered to have no or minimal symptoms of GAD, while those with scores of 5–9, 10–14, or 15–21 are considered to have mild, moderate, or severe symptoms, respectively (2). This report examines the percentage of adults aged 18 and over who experienced symptoms of anxiety in the past 2 weeks, by severity of symptoms and select demographic characteristics, using the GAD–7 scale.
Keywords: GAD–7, mental health, National Health Interview Survey
Over 15% of adults experienced symptoms of anxiety that were either mild, moderate, or severe in the past 2 weeks.
- During 2019, 84.4% of adults aged 18 and over experienced no or minimal symptoms of anxiety in the past 2 weeks (Figure 1).
- Among adults, 9.5% experienced mild, 3.4% experienced moderate, and 2.7% experienced severe symptoms of anxiety.
Figure 1. Percent distribution of severity of anxiety symptoms in the past 2 weeks among adults aged 18 and over: United States, 2019
image icon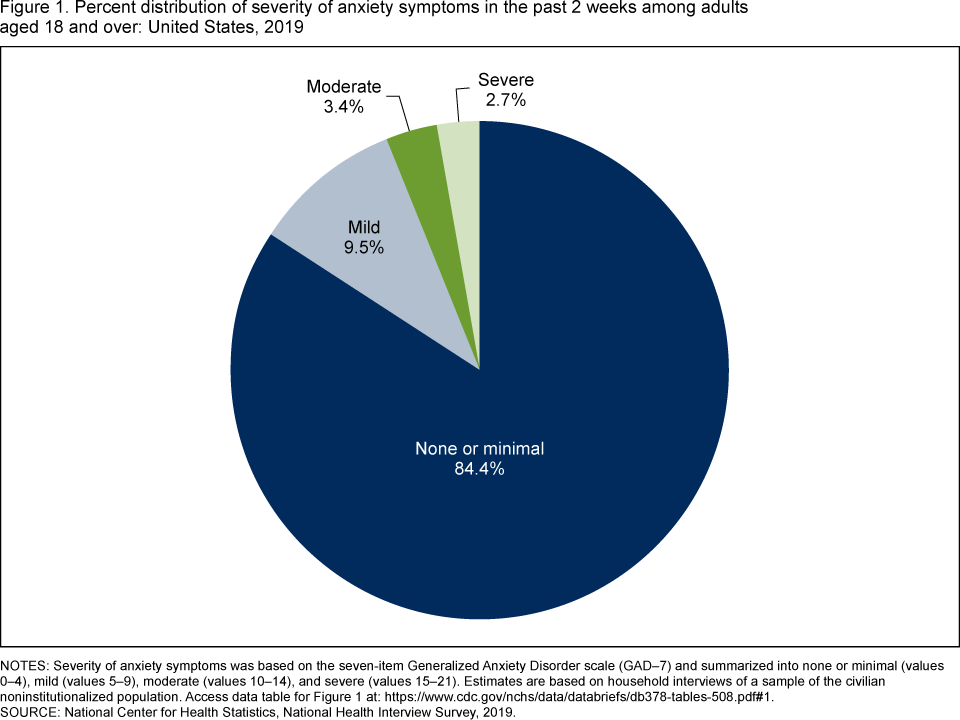 image icon
NOTES: Severity of anxiety symptoms was based on the seven-item Generalized Anxiety Disorder scale (GAD–7) and summarized into none or minimal (values 0–4), mild (values 5–9), moderate (values 10–14), and severe (values 15–21). Estimates are based on household interviews of a sample of the civilian noninstitutionalized population. Access data table for Figure 1pdf icon.
SOURCE: National Center for Health Statistics, National Health Interview Survey, 2019.
The percentage of adults who experienced mild, moderate, or severe symptoms of anxiety in the past 2 weeks decreased with age.
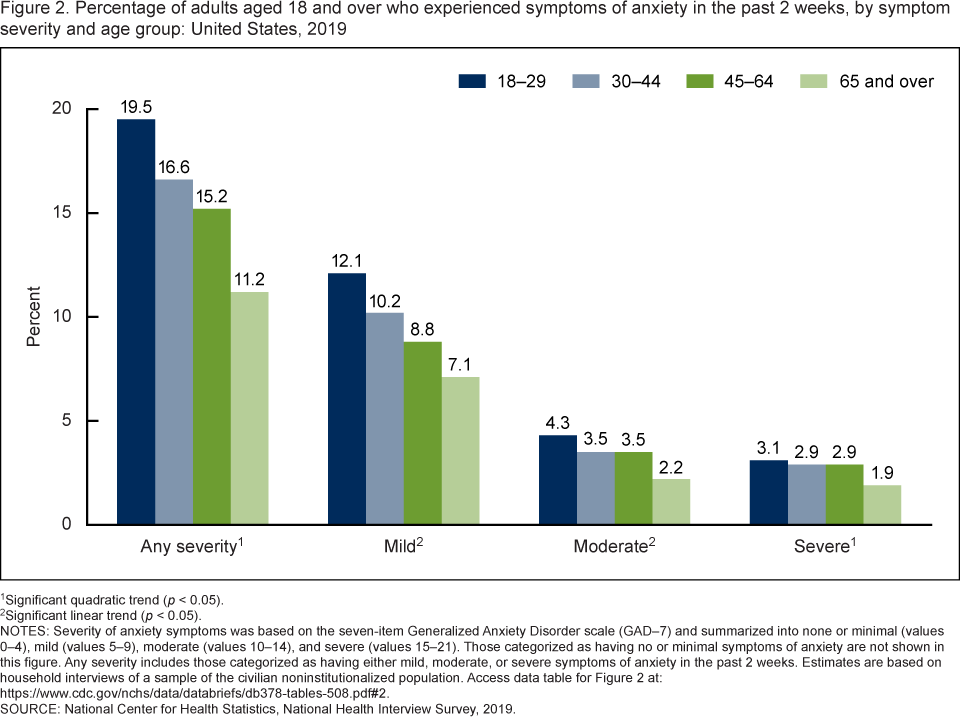
- The total percentage of adults who experienced any anxiety symptoms in the past 2 weeks decreased with age, from 19.5% among adults aged 18–29, 16.6% among adults aged 30–44, 15.2% among adults aged 45–64, to 11.2% among adults aged 65 and over (Figure 2).
- The percentage of adults who experienced mild anxiety symptoms decreased steadily with age, from 12.1% among adults aged 18–29 to 7.1% among adults aged 65 and over.
- The percentage of adults who experienced moderate anxiety symptoms decreased steadily with age, from 4.3% among adults aged 18–29 to 2.2% among adults aged 65 and over.
- The percentage of adults who experienced severe anxiety symptoms was lower among adults aged 65 and over (1.9%) compared with adults aged under 65.
Figure 2. Percentage of adults aged 18 and over who experienced symptoms of anxiety in the past 2 weeks, by symptom severity and age group: United States, 2019
11Significant quadratic trend (p < 0.05).
2Significant linear trend (p < 0.05).
NOTES: Severity of anxiety symptoms was based on the seven-item Generalized Anxiety Disorder scale (GAD–7) and summarized into none or minimal (values 0–4), mild (values 5–9), moderate (values 10–14), and severe (values 15–21). Those categorized as having no or minimal symptoms of anxiety are not shown in this figure. Any severity includes those categorized as having either mild, moderate, or severe symptoms of anxiety in the past 2 weeks. Estimates are based on household interviews of a sample of the civilian noninstitutionalized population. Access data table for Figure 2pdf icon.
SOURCE: National Center for Health Statistics, National Health Interview Survey, 2019.
Women were more likely than men to experience mild, moderate, or severe anxiety symptoms in the past 2 weeks.
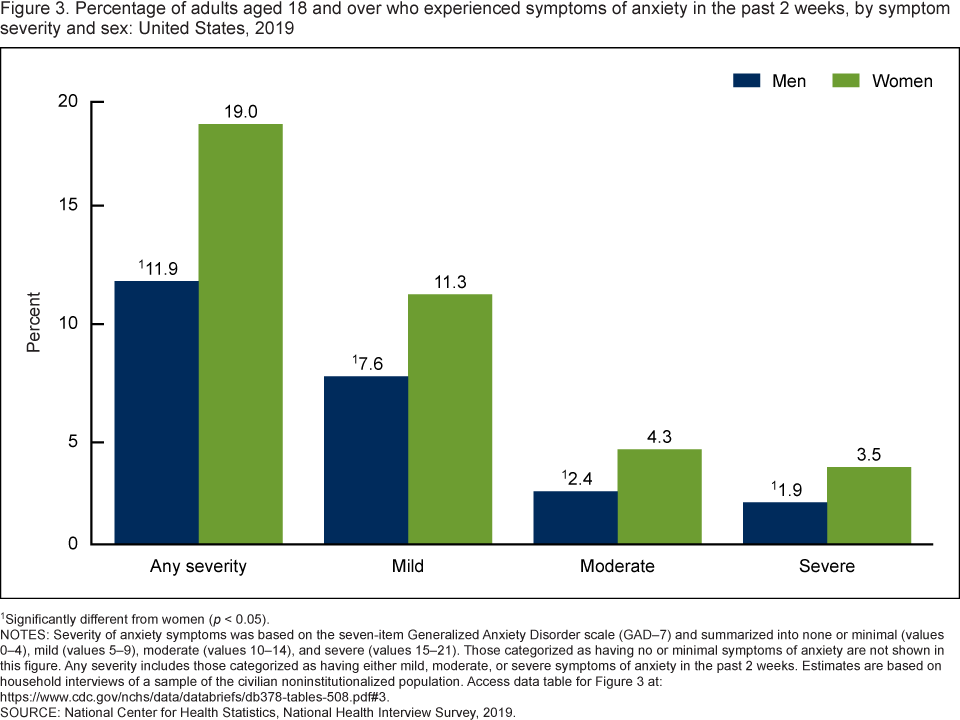
- A total of 19.0% of women experienced anxiety symptoms in the past 2 weeks that were either mild, moderate, or severe, compared with 11.9% of men (Figure 3).
- Women were more likely than men to have experienced anxiety symptoms that were mild (11.3% and 7.6%, respectively), moderate (4.3% and 2.4%), and severe (3.5% and 1.9%).
Figure 3. Percentage of adults aged 18 and over who experienced symptoms of anxiety in the past 2 weeks, by symptom severity and sex: United States, 2019
1Significantly different from women (p < 0.05).
NOTES: Severity of anxiety symptoms was based on the seven-item Generalized Anxiety Disorder scale (GAD–7) and summarized into none or minimal (values 0–4), mild (values 5–9), moderate (values 10–14), and severe (values 15–21). Those categorized as having no or minimal symptoms of anxiety are not shown in this figure. Any severity includes those categorized as having either mild, moderate, or severe symptoms of anxiety in the past 2 weeks. Estimates are based on household interviews of a sample of the civilian noninstitutionalized population. Access data table for Figure 3pdf icon.
SOURCE: National Center for Health Statistics, National Health Interview Survey, 2019.
The percentage of adults who experienced anxiety symptoms in the past 2 weeks varied by Hispanic origin and race.
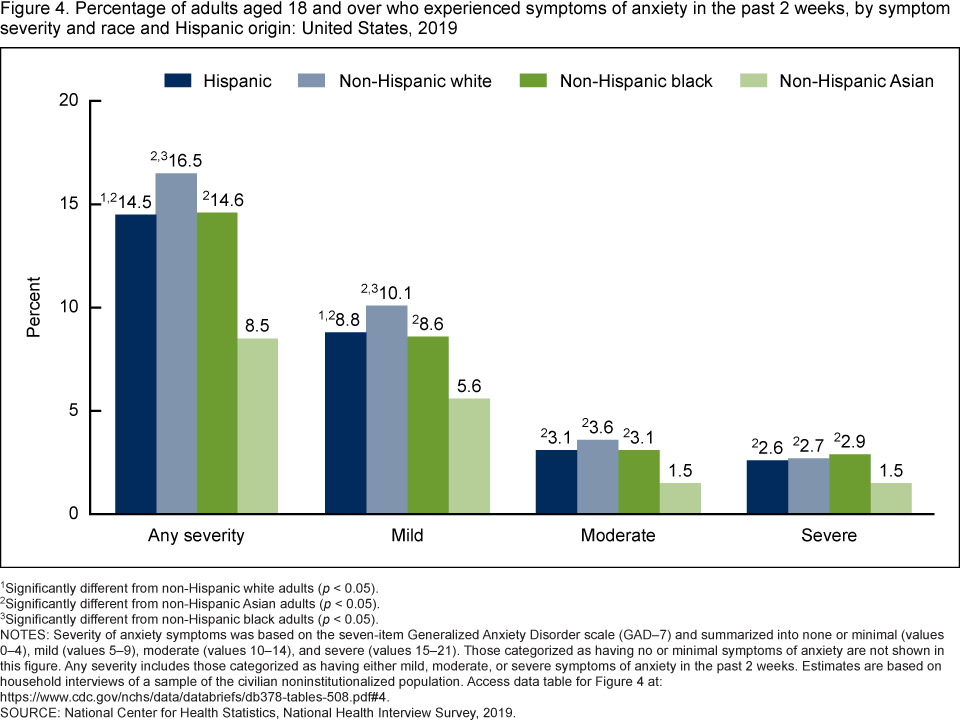
- Non-Hispanic white adults (16.5%) were the most likely to have experienced symptoms of anxiety that were either mild, moderate, or severe in the past 2 weeks, and non-Hispanic Asian adults (8.5%) were the least likely, compared with Hispanic (14.5%) and non-Hispanic black (14.6%) adults (Figure 4).
- Non-Hispanic white adults (10.1%) were the most likely to have experienced mild anxiety symptoms, followed by Hispanic (8.8%) and non-Hispanic black (8.6%) adults, while non-Hispanic Asian adults (5.6%) were the least likely.
- Non-Hispanic Asian adults (1.5%) were the least likely to experience moderate anxiety symptoms compared with all other race and Hispanic-origin groups examined.
- Non-Hispanic Asian adults (1.5%) were the least likely to experience severe anxiety symptoms compared with the other race and Hispanic-origin groups examined.
Figure 4. Percentage of adults aged 18 and over who experienced symptoms of anxiety in the past 2 weeks, by symptom severity and race and Hispanic origin: United States, 2019
1Significantly different from non-Hispanic white adults (p < 0.05).
2Significantly different from non-Hispanic Asian adults (p < 0.05).
3Significantly different from non-Hispanic black adults (p < 0.05).
NOTES: Severity of anxiety symptoms was based on the seven-item Generalized Anxiety Disorder scale (GAD–7) and summarized into none or minimal (values 0–4), mild (values 5–9), moderate (values 10–14), and severe (values 15–21). Those categorized as having no or minimal symptoms of anxiety are not shown in this figure. Any severity includes those categorized as having either mild, moderate, or severe symptoms of anxiety in the past 2 weeks. Estimates are based on household interviews of a sample of the civilian noninstitutionalized population. Access data table for Figure 4pdf icon.
SOURCE: National Center for Health Statistics, National Health Interview Survey, 2019.
Summary
During 2019, about one in six (15.6%) adults aged 18 and over experienced symptoms of anxiety in the past 2 weeks that were either mild (9.5%), moderate (3.4%), or severe (2.7%). Severity of symptoms of GAD differed by sociodemographic characteristics. The percentages of adults with mild, moderate, or severe symptoms of GAD in the past 2 weeks decreased with age and were higher among women than men. Non-Hispanic white adults were the most likely and non-Hispanic Asian adults were least likely to have experienced mild, moderate, or severe symptoms of GAD compared with the other race and Hispanic-origin groups examined.
The GAD–7 scale is a validated brief self-report measure which was developed to screen for GAD and assess the severity of its symptoms (2). A score of 10 or higher, corresponding to moderate and severe symptoms of GAD, may suggest the presence of a clinically significant anxiety condition that warrants further evaluation, including a diagnostic interview and mental status examination by a mental health professional (2,3). This report showed that 6.1% of adults scored 10 or higher on the GAD–7 scale.
Definitions
Race and Hispanic origin: Based on responses to two questions that determine Hispanic or Latino origin and race. Adults categorized as Hispanic may be of any race or combination of races. Adults categorized as non-Hispanic white, non-Hispanic black, and non-Hispanic Asian indicated one race only.
Severity of generalized anxiety disorder (GAD) symptoms: Based on the Generalized Anxiety Disorder scale (GAD–7) and summarized into no or minimal (values 0–4), mild (values 5–9), moderate (values 10–14), or severe (values 15–21) symptoms of GAD (2). Sample adults were asked how often they have been bothered by the following symptoms in the past 2 weeks: “Feeling nervous, anxious, or on edge;” “Not being able to stop or control worrying;” “Worrying too much about different things;” “Trouble relaxing;” “Being so restless that it’s hard to sit still;” “Becoming easily annoyed or irritable;” and “Feeling afraid as if something awful might happen.” Response options were “not at all,” “several days,” “more than half the days,” and “nearly every day,” scored as 0 to 3 points, respectively, and then summed into a total score. Sample adults with two or more GAD–7 questions answered as “refused” or “don’t know,” or whose answers were not ascertained, were not included in this analysis.
Data source and methods
Data from the 2019 National Health Interview Survey (NHIS) were used for this analysis. NHIS is a nationally representative household survey of the civilian noninstitutionalized U.S. population. It is conducted continuously throughout the year by the National Center for Health Statistics (NCHS). Interviews are conducted in respondents’ homes, but follow-ups to complete interviews may be conducted over the telephone. For more information about NHIS, visit https://www.cdc.gov/nchs/nhis.htm.
Point estimates and the corresponding confidence intervals for this analysis were calculated using SUDAAN software (4) to account for the complex sample design of the NHIS. Differences between percentages were evaluated using two-sided significance tests at the 0.05 level. Linear and quadratic trends by age group were evaluated using orthogonal polynomials in logistic regression. All estimates in this report meet NCHS data presentation standards for proportions (5).
About the authors
Emily P. Terlizzi and Maria A. Villarroel are with the National Center for Health Statistics, Division of Health Interview Statistics.
References
- American Psychiatric Association. Diagnostic and statistical manual of mental disorders (DSM–5). 5th ed. Arlington, VA. 2013.
- Spitzer RL, Kroenke K, Williams JB, Löwe B. A brief measure for assessing generalized anxiety disorder: The GAD–7. Arch Intern Med 166(10):1092–7. 2006.
- Kroenke K, Spitzer RL, Williams JB, Monahan PO, Löwe B. Anxiety disorders in primary care: Prevalence, impairment, comorbidity, and detection. Ann Intern Med 146(5):317–25. 2007.
- RTI International. SUDAAN (Release 11.0.3) [computer software]. 2018.
- Parker JD, Talih M, Malec DJ, Beresovsky V, Carroll M, Gonzalez Jr JF, et al. National Center for Health Statistics data presentation standards for proportions. National Center for Health Statistics. Vital Health Stat 2(175). 2017.
Suggested citation
Terlizzi EP, Villarroel MA. Symptoms of generalized anxiety disorder among adults: United States, 2019. NCHS Data Brief, no 378. Hyattsville, MD: National Center for Health Statistics. 2020.
Copyright information
All material appearing in this report is in the public domain and may be reproduced or copied without permission; citation as to source, however, is appreciated.
National Center for Health Statistics
Brian C. Moyer, Ph.D., Director
Amy M. Branum, Ph.D., Acting Associate Director for Science
Division of Health Interview Statistics
Stephen J. Blumberg, Ph.D., Director
Anjel Vahratian, Ph.D., M.P.H., Associate Director for Science