Health of American Indian and Alaska Native Adults, by Urbanization Level: United States, 2014–2018
- Key findings
- The age-adjusted percentage of adults in fair or poor health varied by urbanization level among all adults, but not AIAN adults.
- The age-adjusted percentage of adults with a disability differed by AIAN origin and urbanization level.
- The age-adjusted percentage of adults with multiple chronic conditions differed by urbanization level for AIAN and all U.S. adults.
- The age-adjusted percentage of adults diagnosed with hypertension differed by AIAN origin and urbanization level.
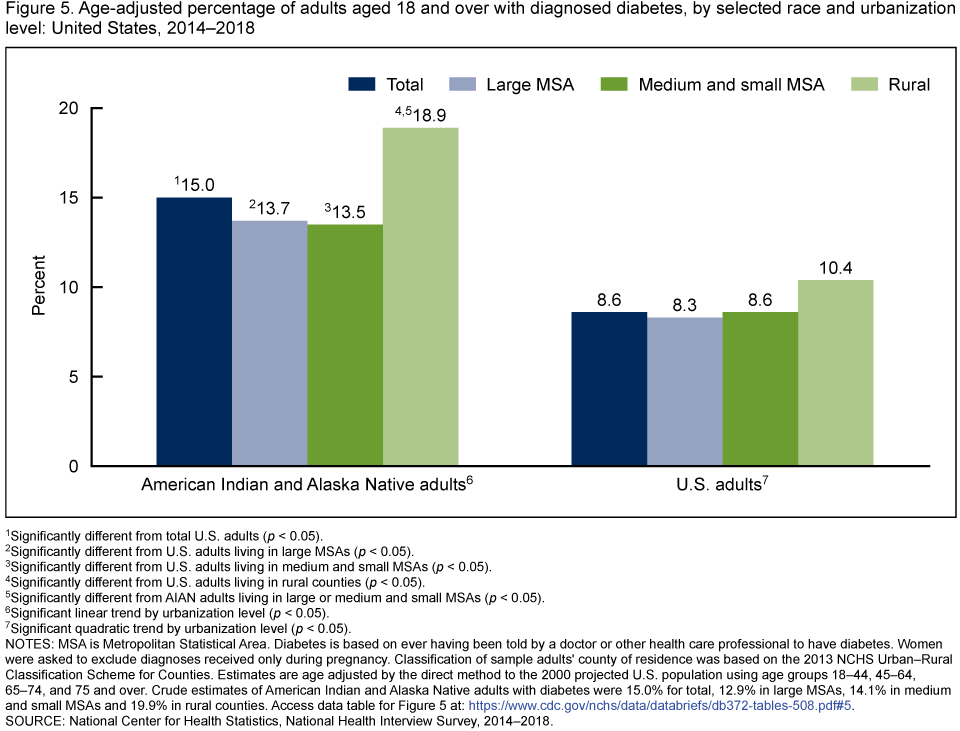
- The age-adjusted percentage of adults diagnosed with diabetes differed by urbanization level for AIAN and U.S. adults.
- Summary
- Definitions
- Data source and methods
- About the authors
- References
- Suggested citation
NCHS Data Brief No. 372, August 2020
PDF Versionpdf icon (703 KB) | Visual Abstract
Key findings
Data from the National Health Interview Survey
- The age-adjusted percentage of American Indian and Alaska Native (AIAN) adults in fair or poor health did not differ by urbanization level and was higher than all U.S. adults.
- The percentage of AIAN adults with a disability decreased from 18.9% in large metropolitan statistical areas (MSAs) to 12.9% in rural areas.
- The percentage of AIAN adults with multiple chronic conditions increased from 28.6% in large MSAs to 35.5% in rural areas.
- The percentage of AIAN adults with diagnosed hypertension was highest in medium and small MSAs (35.7%) and rural areas (35.0%).
- The percentage of AIAN adults with diagnosed diabetes was highest in rural areas (18.9%).
Historically, the American Indian and Alaska Native (AIAN) population in the United States has faced health disparities including greater prevalence of physical and mental health problems and high uninsured rates when compared with the non-AIAN population (1). Almost 80% of the AIAN population resides outside of reservations or land trusts and about 40% reside in rural areas (2). Rural Americans are more likely to die from preventable or self-manageable conditions (3), and risk factors and health conditions may vary by urbanization level (4). This report examines differences in the percentage of selected health status and conditions by urbanization level between AIAN adults and all U.S. adults.
Keywords: disability, chronic conditions, urban rural, National Health Interview Survey.
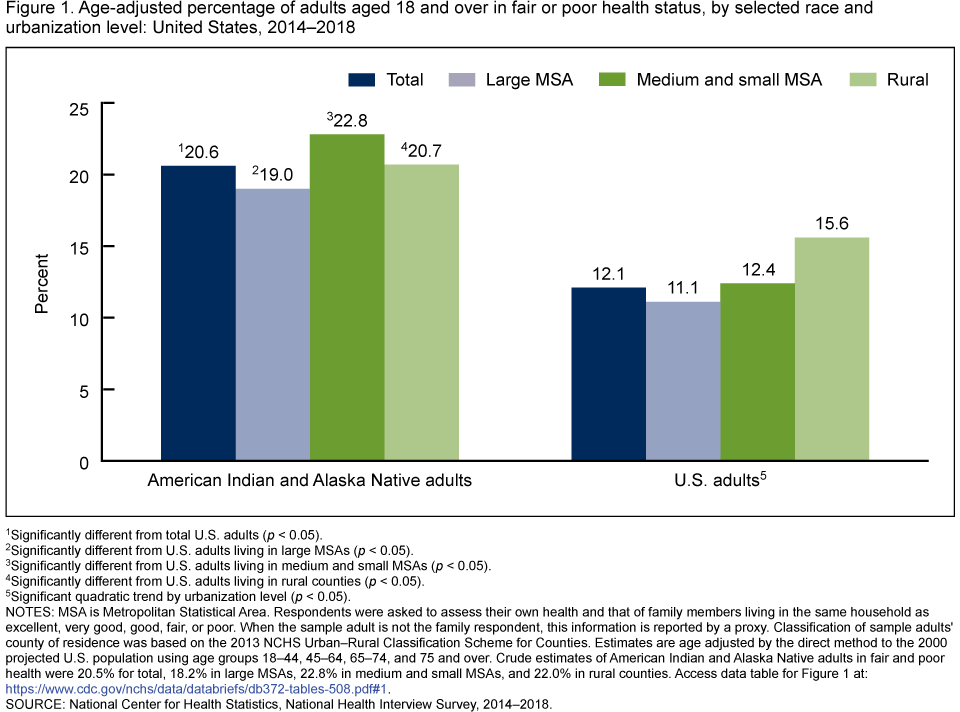
The age-adjusted percentage of adults in fair or poor health varied by urbanization level among all adults, but not AIAN adults.
Among AIAN adults, the age-adjusted percentage in fair or poor health did not differ by urbanization level, while the percentage of all U.S. adults who were in fair or poor health was higher for those in rural areas (15.6%) than those in large metropolitan statistical areas (MSAs) (11.1%) and in medium and small MSAs (12.4%) (Figure 1). AIAN adults (20.6%) were more likely to be in fair or poor health than all U.S. adults (12.1%) within each level of urbanization and among the total population.
Figure 1. Age-adjusted percentage of adults aged 18 and over in fair or poor health status, by selected race and urbanization level: United States, 2014–2018
1Significantly different from total U.S. adults (p < 0.05).
2Significantly different from U.S. adults living in large MSAs (p < 0.05).
3Significantly different from U.S. adults living in medium and small MSAs (p < 0.05).
4Significantly different from U.S. adults living in rural counties (p < 0.05).
5Significant quadratic trend by urbanization level (p < 0.05).
NOTES: MSA is Metropolitan Statistical Area. Respondents were asked to assess their own health and that of family members living in the same household as excellent, very good, good, fair, or poor. When the sample adult is not the family respondent, this information is reported by a proxy. Classification of sample adults’ county of residence was based on the 2013 NCHS Urban–Rural Classification Scheme for Counties. Estimates are age adjusted by the direct method to the 2000 projected U.S. population using age groups 18–44, 45–64, 65–74, and 75 and over. Crude estimates of American Indian and Alaska Native adults in fair and poor health were 20.5% for total, 18.2% in large MSAs, 22.8% in medium and small MSAs, and 22.0% in rural counties. Access data table for Figure 1pdf icon.
SOURCE: National Center for Health Statistics, National Health Interview Survey, 2014–2018.
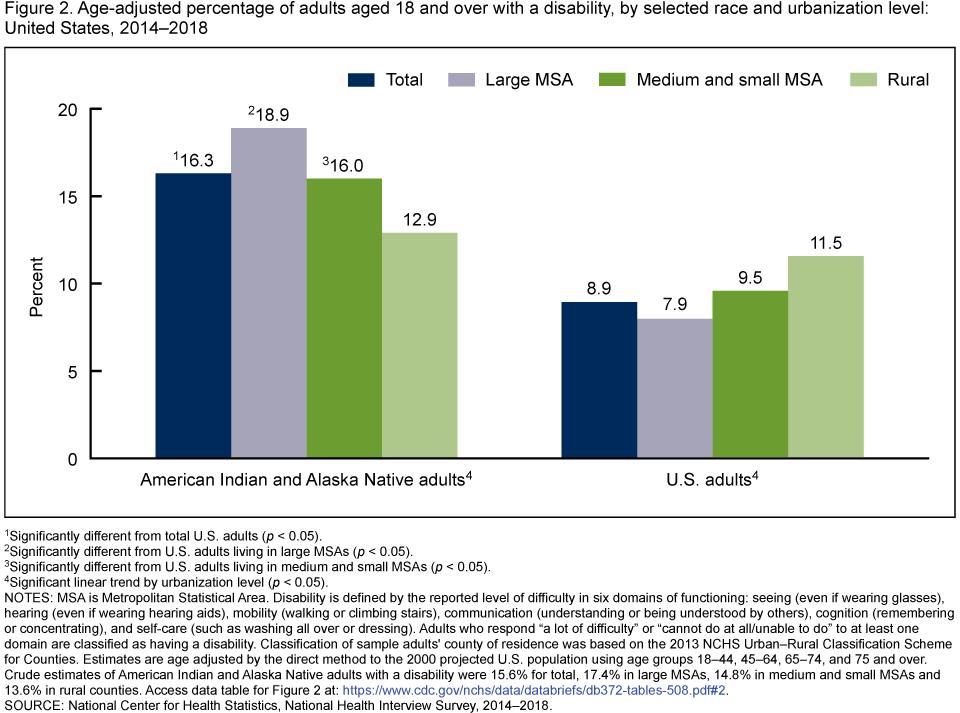
The age-adjusted percentage of adults with a disability differed by AIAN origin and urbanization level.
The age-adjusted percentage of AIAN adults with a disability was almost twice as high (16.3%) as all U.S. adults (8.9%) (Figure 2). The percentage of AIAN adults with a disability decreased with decreasing urbanization level, from 18.9% among those living in large MSAs to 12.9% among those living in rural areas. The percentage of all U.S. adults with a disability increased with decreasing urbanization level, from 7.9% in large MSAs to 11.5% in rural areas. The percentage of AIAN adults with a disability was higher than all U.S. adults among those living in large MSAs (18.9% compared with 7.9%) and medium and small MSAs (16.0% compared with 9.5%) but there was no difference in rural areas.
Figure 2. Age-adjusted percentage of adults aged 18 and over with a disability, by selected race and urbanization level: United States, 2014–2018
1Significantly different from total U.S. adults (p < 0.05).
2Significantly different from U.S. adults living in large MSAs (p < 0.05).
3Significantly different from U.S. adults living in medium and small MSAs (p < 0.05).
4Significant linear trend by urbanization level (p < 0.05).
NOTES: MSA is Metropolitan Statistical Area. Disability is defined by the reported level of difficulty in six domains of functioning: seeing (even if wearing glasses), hearing (even if wearing hearing aids), mobility (walking or climbing stairs), communication (understanding or being understood by others), cognition (remembering or concentrating), and self-care (such as washing all over or dressing). Adults who respond “a lot of difficulty” or “cannot do at all/unable to do” to at least one domain are classified as having a disability. Classification of sample adults’ county of residence was based on the 2013 NCHS Urban–Rural Classification Scheme for Counties. Estimates are age adjusted by the direct method to the 2000 projected U.S. population using age groups 18–44, 45–64, 65–74, and 75 and over. Crude estimates of American Indian and Alaska Native adults with a disability were 15.6% for total, 17.4% in large MSAs, 14.8% in medium and small MSAs and 13.6% in rural counties. Access data table for Figure 2pdf icon.
SOURCE: National Center for Health Statistics, National Health Interview Survey, 2014–2018.
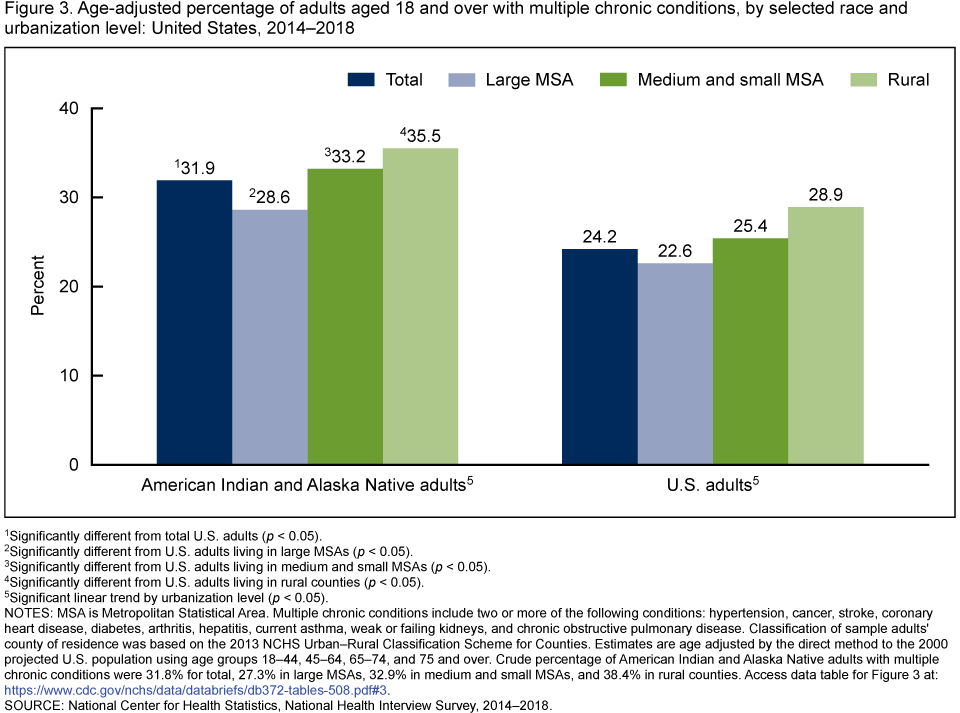
The age-adjusted percentage of adults with multiple chronic conditions differed by urbanization level for AIAN and all U.S. adults.
About one-third of AIAN adults (31.9%) had multiple chronic conditions, compared with about one-fourth of all U.S. adults (24.2%) (Figure 3). The age-adjusted percentage of adults with multiple chronic conditions increased with decreasing urbanization level for both AIAN and all U.S. adults. The percentage with multiple chronic conditions was higher for AIAN adults than all U.S. adults among those living in large MSAs (28.6% compared with 22.6%), medium and small MSAs (33.2% compared with 25.4%), and rural areas (35.5% compared with 28.9%).
Figure 3. Age-adjusted percentage of adults aged 18 and over with multiple chronic conditions, by selected race and urbanization level: United States, 2014–2018
1Significantly different from total U.S. adults (p < 0.05).
2Significantly different from U.S. adults living in large MSAs (p < 0.05).
3Significantly different from U.S. adults living in medium and small MSAs (p < 0.05).
4Significantly different from U.S. adults living in rural counties (p < 0.05).
5Significant linear trend by urbanization level (p < 0.05).
NOTES: MSA is Metropolitan Statistical Area. Multiple chronic conditions include two or more of the following conditions: hypertension, cancer, stroke, coronary heart disease, diabetes, arthritis, hepatitis, current asthma, weak or failing kidneys, and chronic obstructive pulmonary disease. Classification of sample adults’ county of residence was based on the 2013 NCHS Urban–Rural Classification Scheme for Counties. Estimates are age adjusted by the direct method to the 2000 projected U.S. population using age groups 18–44, 45–64, 65–74, and 75 and over. Crude percentage of American Indian and Alaska Native adults with multiple chronic conditions were 31.8% for total, 27.3% in large MSAs, 32.9% in medium and small MSAs, and 38.4% in rural counties. Access data table for Figure 3pdf icon.
SOURCE: National Center for Health Statistics, National Health Interview Survey, 2014–2018.
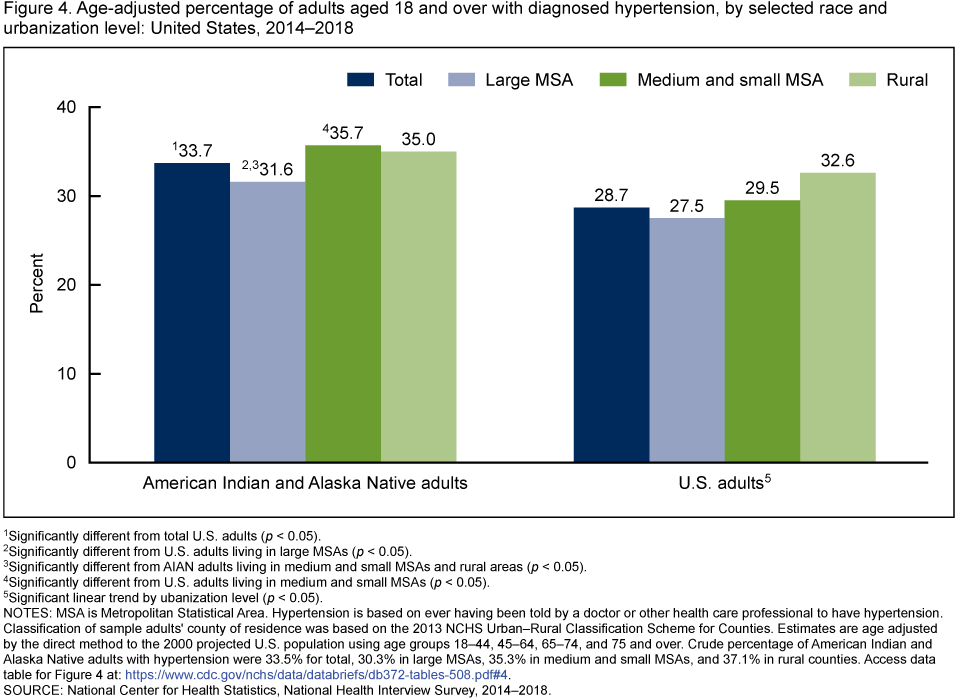
The age-adjusted percentage of adults diagnosed with hypertension differed by AIAN origin and urbanization level.
The age-adjusted percentage of AIAN adults with diagnosed hypertension was 33.7%, which was higher than the percentage among all U.S. adults (28.7%) (Figure 4). Among AIAN adults, the percentage with diagnosed hypertension was highest for those living in medium and small MSAs and rural areas, whereas among all U.S. adults, the percentage of adults with diagnosed hypertension increased with decreasing urbanization level. The percentage of AIAN adults with diagnosed hypertension was higher than all U.S. adults among those living in large MSAs (31.6% compared with 27.5%) and among those in medium and small MSAs (35.7% compared with 29.5%), but similar for those in rural areas.
Figure 4. Age-adjusted percentage of adults aged 18 and over with diagnosed hypertension, by selected race and urbanization level: United States, 2014–2018
1Significantly different from total U.S. adults (p < 0.05).
2Significantly different from U.S. adults living in large MSAs (p < 0.05).
3Significantly different from AIAN adults living in medium and small MSAs and rural areas (p < 0.05).
4Significantly different from U.S. adults living in medium and small MSAs (p < 0.05).
5Significant linear trend by ubanization level (p < 0.05).
NOTES: MSA is Metropolitan Statistical Area. Hypertension is based on ever having been told by a doctor or other health care professional to have hypertension. Classification of sample adults’ county of residence was based on the 2013 NCHS Urban–Rural Classification Scheme for Counties. Estimates are age adjusted by the direct method to the 2000 projected U.S. population using age groups 18–44, 45–64, 65–74, and 75 and over. Crude percentage of American Indian and Alaska Native adults with hypertension were 33.5% for total, 30.3% in large MSAs, 35.3% in medium and small MSAs, and 37.1% in rural counties. Access data table for Figure 4pdf icon.
SOURCE: National Center for Health Statistics, National Health Interview Survey, 2014–2018.
The age-adjusted percentage of adults diagnosed with diabetes differed by urbanization level for AIAN and U.S. adults.
The age-adjusted percentage of AIAN adults with diagnosed diabetes was almost twice (15.0%) as high as all U.S. adults (8.6%) (Figure 5). The percentage of adults with diagnosed diabetes was highest among those living rural areas for both AIAN and all U.S. adults. The percentage of AIAN adults with diagnosed diabetes was higher than all U.S. adults among those living in large MSAs (13.7% compared with 8.3%), medium and small MSAs (13.5% compared with 8.6%), and rural areas (18.9% compared with 10.4%).
Figure 5. Age-adjusted percentage of adults aged 18 and over with diagnosed diabetes, by selected race and urbanization level: United States, 2014–2018
1Significantly different from total U.S. adults (p < 0.05).
2Significantly different from U.S. adults living in large MSAs (p < 0.05).
3Significantly different from U.S. adults living in medium and small MSAs (p < 0.05).
4Significantly different from U.S. adults living in rural counties (p < 0.05).
5Significantly different from AIAN adults living in large or medium and small MSAs (p < 0.05).
6Significant linear trend by urbanization level (p < 0.05).
7Significant quadratic trend by urbanization level (p < 0.05).
NOTES: MSA is Metropolitan Statistical Area. Diabetes is based on ever having been told by a doctor or other health care professional to have diabetes. Women were asked to exclude diagnoses received only during pregnancy. Classification of sample adults’ county of residence was based on the 2013 NCHS Urban–Rural Classification Scheme for Counties. Estimates are age adjusted by the direct method to the 2000 projected U.S. population using age groups 18–44, 45–64, 65–74, and 75 and over. Crude estimates of American Indian and Alaska Native adults with diabetes were 15.0% for total, 12.9% in large MSAs, 14.1% in medium and small MSAs and 19.9% in rural counties. Access data table for Figure 4pdf icon.
SOURCE: National Center for Health Statistics, National Health Interview Survey, 2014–2018.
Summary
In general, AIAN adults were more likely to be in fair or poor health, have a disability, have multiple chronic conditions, and to have been diagnosed with hypertension and diabetes compared with all U.S. adults. This finding was consistent across most urbanization levels.
Health trends by urbanization level varied among AIAN adults and among all U.S. adults. While the percentage of all U.S. adults with disabilities and diagnosed hypertension increased steadily with decreasing urbanization level, and the percentage in fair or poor health was highest in rural areas, these trends did not parallel those among AIAN adults. In contrast to all U.S. adults, the percentage of AIAN adults with disabilities decreased steadily with urbanization level, diagnosed hypertension was similarly highest for those in medium and small MSAs and in rural areas, and the percentage in fair or poor health status did not differ by urbanization level.
Among AIAN adults and among all U.S. adults, the percentage with diagnosed diabetes was highest in rural areas, and the percentage with multiple chronic conditions increased steadily with decreasing urbanization level. Previous research shows that rural residents have an increased risk of chronic health conditions and may experience greater barriers to health care access that may exacerbate these conditions compared with residents in more urbanized areas (4–6).
Understanding the factors driving differences in health status and disability may be informative to efforts to curtail health disparities among AIAN adults, particularly those living in smaller-sized MSAs and rural areas.
Definitions
American Indian and Alaska Natives (AIAN): Based on any mention of American Indian or Alaska Native to the question, “What race or races [do you/does person] consider [yourself/himself/herself] to be?”
Diagnosed diabetes: Based on a positive response to the survey question, “Have you ever been told by a doctor or health professional that you have diabetes or sugar diabetes?” Women were asked to exclude diagnoses received only during pregnancy.
Diagnosed hypertension: Based on a positive response to the survey question, “Have you ever been told by a doctor or health professional that you had hypertension?”
Disability: Based on the reported level of difficulty (no difficulty, some difficulty, a lot of difficulty, or cannot do at all/unable to do) in six domains of functioning: seeing (even if wearing glasses), hearing (even if wearing hearing aids), mobility (walking or climbing stairs), communication (understanding or being understood by others), cognition (remembering or concentrating), and self-care (such as washing all over or dressing). Adults who respond “a lot of difficulty” or “cannot do at all/unable to do” to at least one domain are classified as having a disability.
Health status: Based on a fair or poor response when asked if the sample adult’s health is excellent, very good, good, fair, or poor. When the sample adult is not the family respondent, this information is reported by a proxy.
Multiple chronic conditions: Based on a doctor or other health care professional’s diagnosis of at least 2 of 10 selected chronic conditions. These selected conditions were based on previous research (7,8) and included ever having a diagnosis of hypertension, cancer, stroke, coronary heart disease, diabetes (excluding gestational diabetes), arthritis (including rheumatoid arthritis, gout, lupus, and fibromyalgia), hepatitis, a current diagnosis of asthma, a diagnosis of weak or failing kidneys in the past 12 months, and a diagnosis of chronic obstructive pulmonary disease (COPD), emphysema, or chronic bronchitis in the past 12 months.
Urbanization level: For this report, urbanization level was categorized by collapsing the 2013 NCHS Urban–Rural classification scheme for counties (9) into 1) large MSAs (central and fringe counties in MSAs of 1 million or more persons); 2) medium and small MSAs (counties in MSAs with 250,000 to 999,999 persons and counties in MSAs of less than 250,000 persons); and 3) rural (counties in micropolitan statistical areas and noncore counties).
Data source and methods
This analysis used pooled 2014–2018 National Health Interview Survey (NHIS) data. NHIS is a nationally representative multipurpose health survey of the civilian noninstitutionalized U.S. population. It is conducted continuously throughout the year by the National Center for Health Statistics (NCHS). Interviews are conducted in the respondent’s home, but follow-ups to complete interviews may be conducted by telephone when necessary. For more information about NHIS, visit: https://www.cdc.gov/nchs/nhis.htm.
Point estimates and the corresponding variances were calculated using SAS-callable SUDAAN version 11.0 (10) to account for the complex sample design of NHIS. Sample adult sampling weights were adjusted for pooled data and included the Adult Functioning and Disability sampling weights to account for the split-ballot design of the disability questions during 2014–2017. All estimates in this report meet NCHS standards of reliability as specified in the “National Center for Health Statistics Data Presentation Standards for Proportions” (11). Estimates were age-adjusted using the direct method and adjusted to the 2000 U.S. standard population, using four age groups: 18–44, 45–64, 65–74, and 75 and over. Linear and quadratic trends by urbanicity were evaluated using Proc Descript, Poly option. Differences between percentages were evaluated using two-sided significance tests at the 0.05 level. The estimated standard error of the difference between AIAN adults and U.S. estimates accounted for nonindependence of AIAN and U.S. estimates by incorporating their covariance.
About the authors
Maria A. Villarroel, Tainya C. Clarke, and Tina Norris are with the National Center for Health Statistics, Division of Health Interview Statistics.
References
- Jones DS. The persistence of American Indian health disparities. Am J Public Health 96(12):2122–34. 2006.
- Office of Minority Health, Profile: American Indian/Alaska Native profile.external icon U.S. Department of Health and Human Services.
- Callaghan TH, Ferdinand AO, Akinlotan M, Primm K, Lee JS, Macareno B, Bolin J. Healthy People 2020 progress for leading causes of death in rural and urban America: A chartbookpdf iconexternal icon. Policy brief. Southwest Rural Health Research Center. 2019.
- Meit M, Knudson A, Gilbert T, Yu ATC, Tanenbaum E, Ormson E, et al. The 2014 update of the rural-urban chartbook. Rural Health Reform Policy Research Centerpdf iconexternal icon. 2014.
- Rural Health Information Hub. Rural Health Disparitiesexternal icon. 2019.
- National Council on Disability. Understanding disabilities in American Indian & Alaska Native Communities: Toolkit guideexternal icon.
- Goodman RA, Posner SF, Huang ES, Parekh AK, Koh HK. Defining and measuring chronic conditions: Imperatives for research, policy, program, and practice. Prev Chronic Dis 10:120239. 2013.
- U.S. Department of Health and Human Services. Multiple chronic conditions—A strategic frameworkpdf iconexternal icon. Optimum health and quality of life for individuals with multiple chronic conditions. Washington, DC: U.S. Department of Health and Human Services. 2010.
- Ingram DD, Franco SJ. 2013 NCHS urban–rural classification scheme for counties. National Center for Health Statistics. Vital Health Stat 2(166). 2014.
- RTI International. SUDAAN (Release 11.0.3) [computer software]. 2018.
- Parker JD, Talih M, Malec DJ, Beresovsky V, Carroll M, Gonzalez JF Jr, et al. National Center for Health Statistics data presentation standards for proportions. National Center for Health Statistics. Vital Health Stat 2(175). 2017.
Suggested citation
Villarroel MA, Clarke TC, Norris T. Health of American Indian and Alaska Native adults, by urbanization level: United States, 2014–2018. NCHS Data Brief, no 372. Hyattsville, MD: National Center for Health Statistics. 2020.
Copyright information
All material appearing in this report is in the public domain and may be reproduced or copied without permission; citation as to source, however, is appreciated.
National Center for Health Statistics
Brian C. Moyer, Ph.D., Director
Amy M. Branum, Ph.D., Acting Associate Director for Science
Division of Health Interview Statistics
Stephen J. Blumberg, Ph.D., Director
Anjel Vahratian, Ph.D., M.P.H., Associate Director for Science