Eye Disorders and Vision Loss Among U.S. Adults Aged 45 and Over With Diagnosed Diabetes, 2016–2017
- Key findings
- Cataracts and vision loss due to cataracts increased with increasing duration since diabetes diagnosis among adults aged 45 and over with diagnosed diabetes.
- Diabetic retinopathy was nearly three times higher among adults aged 45 and over who had a diagnosis of diabetes for 10 years or more compared with less than 10 years.
- Glaucoma increased with increasing duration since diabetes diagnosis among adults aged 45 and over with diagnosed diabetes.
- Macular degeneration and vision loss due to macular degeneration increased with increasing years since diabetes diagnosis among adults aged 45 and over with diagnosed diabetes.
- Summary
- Definitions
- Data source and methods
- About the authors
- References
- Suggested citation
NCHS Data Brief No. 344, July 2019
PDF Versionpdf icon (481 KB)
Amy E. Cha, Ph.D., M.P.H., Maria A. Villarroel, Ph.D., and Anjel Vahratian, Ph.D., M.P.H.
Key findings
Data from the National Health Interview Survey
- Among adults aged 45 and over with diagnosed diabetes, 32.2% had cataracts, 8.6% had diabetic retinopathy, 7.1% had glaucoma, and 4.3% had macular degeneration.
- Among adults aged 45 and over with diagnosed diabetes, 9.2% had vision loss due to cataracts, 4.1% had vision loss due to diabetic retinopathy, 2.2% had vision loss due to macular degeneration, and 2.1% had vision loss due to glaucoma.
- Compared with adults who have had diagnosed diabetes for less than 10 years, adults having diagnosed diabetes for 10 years or more were more likely to have each of these eye disorders and to have experienced vision loss due to cataracts, diabetic retinopathy, and macular degeneration.
Diabetes increases with age. In 2017, the prevalence of diagnosed diabetes increased from 13.2% among adults aged 45–64 to 20.1% among those aged 65–74 and 19.8% among those aged 75 and over (1). Compared with adults without diabetes, adults with diabetes are more likely to develop eye disorders and vision loss from eye disorders (2,3). Moreover, duration of diabetes is a risk factor for the progression of visual problems (3,4). This report compares the age-adjusted percentages of adults aged 45 and over with diagnosed diabetes who were told by a doctor or other health professional that they had cataracts, diabetic retinopathy, glaucoma, or macular degeneration and vision loss due to these disorders, by years since their diabetes diagnosis.
Keywords: cataracts, glaucoma, diabetic retinopathy, National Health Interview Survey
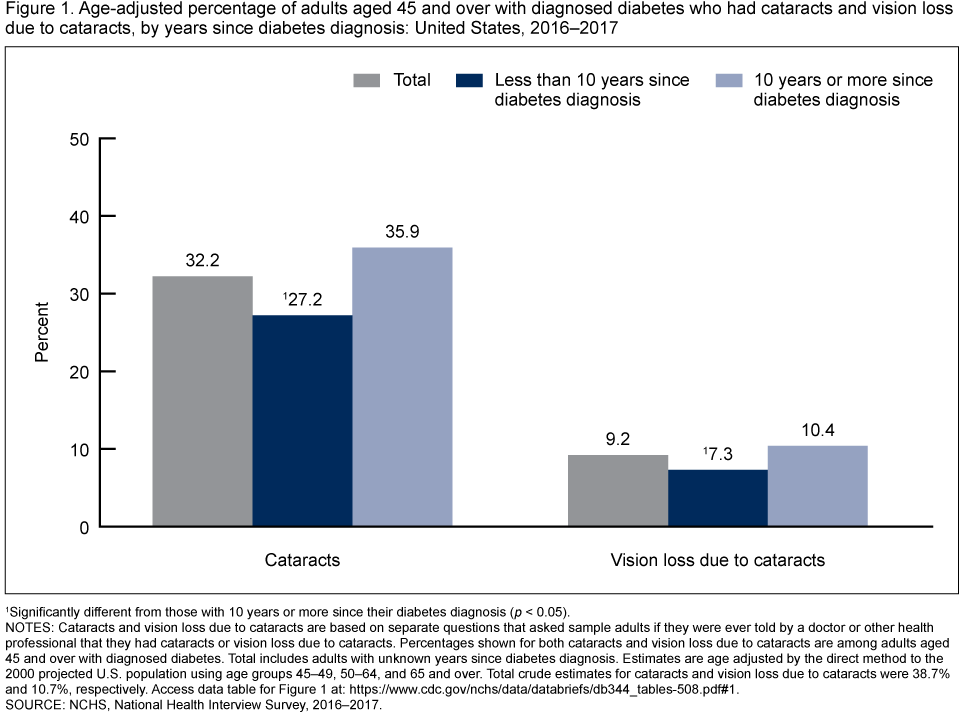
Cataracts and vision loss due to cataracts increased with increasing duration since diabetes diagnosis among adults aged 45 and over with diagnosed diabetes.
- Among adults aged 45 and over with diagnosed diabetes, 32.2% had cataracts, and 9.2% had vision loss due to cataracts (Figure 1).
- Adults aged 45 and over who have had diagnosed diabetes for 10 years or more were more likely to have cataracts (35.9%) than those having diagnosed diabetes for less than 10 years (27.2%).
- Adults who have had diagnosed diabetes for 10 years or more were more likely to have vision loss due to cataracts (10.4%) than those having diagnosed diabetes for less than 10 years (7.3%).
Figure 1. Age-adjusted percentage of adults aged 45 and over with diagnosed diabetes who had cataracts and vision loss due to cataracts, by years since diabetes diagnosis: United States, 2016–2017
1Significantly different from those with 10 years or more since their diabetes diagnosis (p < 0.05).
NOTES: Cataracts and vision loss due to cataracts are based on separate questions that asked sample adults if they were ever told by a doctor or other health professional that they had cataracts or vision loss due to cataracts. Percentages shown for both cataracts and vision loss due to cataracts are among adults aged 45 and over with diagnosed diabetes. Total includes adults with unknown years since diabetes diagnosis. Estimates are age adjusted by the direct method to the 2000 projected U.S. population using age groups 45–49, 50–64, and 65 and over. Total crude estimates for cataracts and vision loss due to cataracts were 38.7% and 10.7%, respectively. Access data table for Figure 1pdf icon.
SOURCE: NCHS, National Health Interview Survey, 2016–2017.
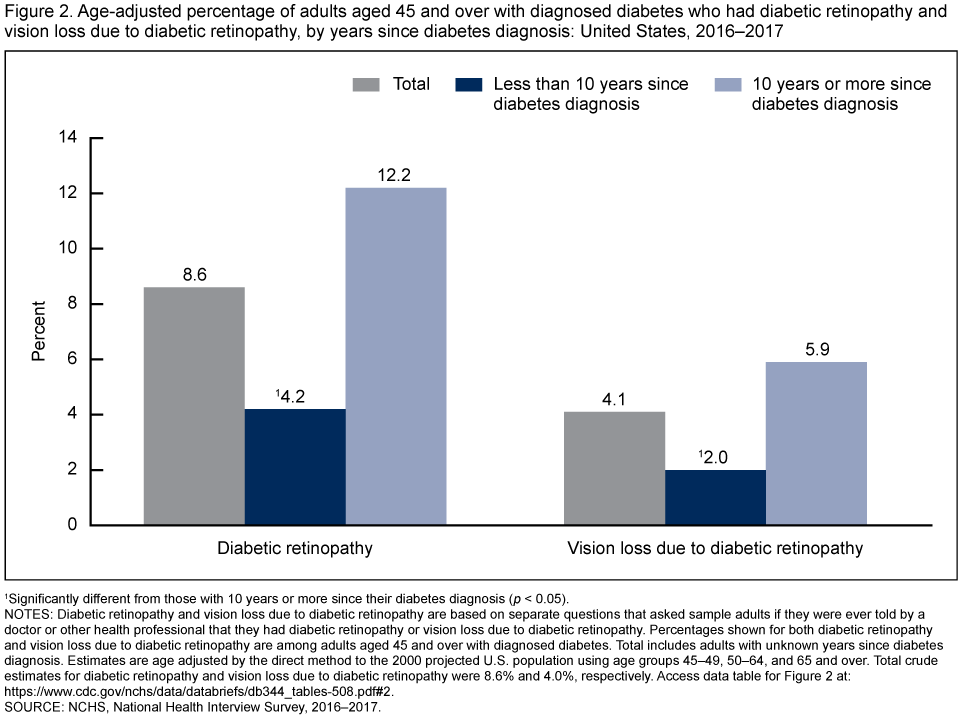
Diabetic retinopathy was nearly three times higher among adults aged 45 and over who had a diagnosis of diabetes for 10 years or more compared with less than 10 years.
- Nearly 9.0% of adults aged 45 and over with diagnosed diabetes had diabetic retinopathy (8.6%), and 4.1% had vision loss due to diabetic retinopathy (Figure 2).
- Adults aged 45 and over who have had diagnosed diabetes for 10 years or more were more likely to have diabetic retinopathy (12.2%) than those having diagnosed diabetes for less than 10 years (4.2%).
- Adults who have had diagnosed diabetes for 10 years or more were more likely to have vision loss due to diabetic retinopathy (5.9%) than those having diagnosed diabetes for less than 10 years (2.0%).
Figure 2. Age-adjusted percentage of adults aged 45 and over with diagnosed diabetes who had diabetic retinopathy and vision loss due to diabetic retinopathy, by years since diabetes diagnosis: United States, 2016–2017
1Significantly different from those with 10 years or more since their diabetes diagnosis (p < 0.05).
NOTES: Diabetic retinopathy and vision loss due to diabetic retinopathy are based on separate questions that asked sample adults if they were ever told by a doctor or other health professional that they had diabetic retinopathy or vision loss due to diabetic retinopathy. Percentages shown for both diabetic retinopathy and vision loss due to diabetic retinopathy are among adults aged 45 and over with diagnosed diabetes. Total includes adults with unknown years since diabetes diagnosis. Estimates are age adjusted by the direct method to the 2000 projected U.S. population using age groups 45–49, 50–64, and 65 and over. Total crude estimates for diabetic retinopathy and vision loss due to diabetic retinopathy were 8.6% and 4.0%, respectively. Access data table for Figure 2pdf icon.
SOURCE: NCHS, National Health Interview Survey, 2016–2017.
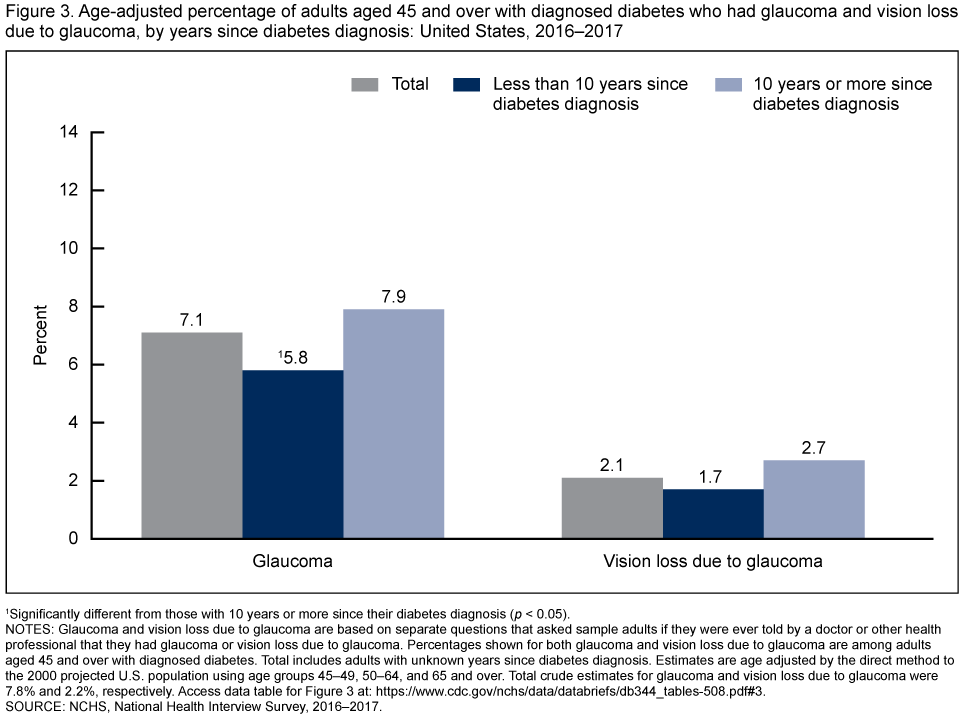
Glaucoma increased with increasing duration since diabetes diagnosis among adults aged 45 and over with diagnosed diabetes.
- Among adults aged 45 and over with diagnosed diabetes, 7.1% had glaucoma, and 2.1% had vision loss due to glaucoma (Figure 3).
- Adults aged 45 and over who have had diagnosed diabetes for 10 years or more were more likely to have glaucoma (7.9%) than those having diagnosed diabetes for less than 10 years (5.8%).
- The age-adjusted percentage of vision loss due to glaucoma was similar among adults who have had diagnosed diabetes for less than 10 years (1.7%) and those who have had diagnosed diabetes for 10 years or more (2.7%).
Figure 3. Age-adjusted percentage of adults aged 45 and over with diagnosed diabetes who had glaucoma and vision loss due to glaucoma, by years since diabetes diagnosis: United States, 2016–2017
1Significantly different from those with 10 years or more since their diabetes diagnosis (p < 0.05).
NOTES: Glaucoma and vision loss due to glaucoma are based on separate questions that asked sample adults if they were ever told by a doctor or other health professional that they had glaucoma or vision loss due to glaucoma. Percentages shown for both glaucoma and vision loss due to glaucoma are among adults aged 45 and over with diagnosed diabetes. Total includes adults with unknown years since diabetes diagnosis. Estimates are age adjusted by the direct method to the 2000 projected U.S. population using age groups 45–49, 50–64, and 65 and over. Total crude estimates for glaucoma and vision loss due to glaucoma were 7.8% and 2.2%, respectively. Access data table for Figure 3pdf icon.
SOURCE: NCHS, National Health Interview Survey, 2016–2017.
Macular degeneration and vision loss due to macular degeneration increased with increasing years since diabetes diagnosis among adults aged 45 and over with diagnosed diabetes.
- Among adults aged 45 and over with diagnosed diabetes, 4.3% had macular degeneration, and 2.2% had vision loss due to macular degeneration (Figure 4).
- Adults aged 45 and over who have had diagnosed diabetes for 10 years or more were more likely to have macular degeneration (5.1%) than those having diagnosed diabetes for less than 10 years (3.5%).
- Adults who have had diagnosed diabetes for 10 years or more were more likely to have vision loss due to macular degeneration (2.8%) than those having diagnosed diabetes for less than 10 years (1.7%).
Figure 4. Age-adjusted percentage of adults aged 45 and over with diagnosed diabetes who had macular degeneration and vision loss due to macular degeneration, by years since diabetes diagnosis: United States, 2016–2017

1Significantly different from those with 10 years or more since their diabetes diagnosis (p < 0.05).
NOTES: Macular degeneration and vision loss due to macular degeneration are based on separate questions that asked sample adults if they were ever told by a doctor or other health professional that they had macular degeneration or vision loss due to macular degeneration. Percentages shown for both macular degeneration and vision loss due to macular degeneration are among adults aged 45 and over with diagnosed diabetes. Total includes adults with unknown years since diabetes diagnosis. Estimates are age adjusted by the direct method to the 2000 projected U.S. population using age groups 45–49, 50–64, and 65 and over. Total crude estimates for macular degeneration and vision loss due to macular degeneration were 4.7% and 2.4%, respectively. Access data table for Figure 4pdf icon.
SOURCE: NCHS, National Health Interview Survey, 2016–2017.
Summary
This report examined four eye disorders among adults aged 45 and over with diagnosed diabetes and found that the most commonly reported eye disorder affecting this population was cataracts, followed by diabetic retinopathy, glaucoma, and macular degeneration. Similarly, vision loss among this population was most commonly due to cataracts, followed by diabetic retinopathy, macular degeneration, and glaucoma. Adults who have had diagnosed diabetes for 10 years or more were more likely to report each of these eye disorders. In addition, adults who have had diagnosed diabetes for 10 years or more were more likely to report vision loss due to cataracts, diabetic retinopathy, and macular degeneration than those having diagnosed diabetes for less than 10 years.
Vision loss is a severe condition that often has a negative impact on a person’s quality of life and mental health (5). Because eye disorders are a frequent complication from diabetes, the American Diabetes Association recommends that patients with type 1 diabetes have an initial dilated and comprehensive eye examination by an ophthalmologist or optometrist within 5 years after receiving a diabetes diagnosis (4). Adults with type 2 diabetes are recommended to have this initial examination at the time of their diagnosis. The frequency of subsequent examinations depends on the patient’s glycemic control and evidence of diabetic retinopathy (4).
Definitions
Cataracts: Based on a positive response to the survey question, “Have you ever been told by a doctor or other health professional that you had cataracts?” A follow-up question asked if the respondent had ever lost any vision because of cataracts.
Diabetic retinopathy: Based on a positive response to the survey question, “Have you ever been told by a doctor or other health professional that you had diabetic retinopathy?” A follow-up question asked if the respondent had ever lost any vision because of diabetic retinopathy.
Diagnosed diabetes: Based on a positive response to the survey question, “Have you ever been told by a doctor or other health professional that you have diabetes or sugar diabetes?” Women were asked to exclude diagnosis received only during pregnancy.
Glaucoma: Based on a positive response to the survey question, “Have you ever been told by a doctor or other health professional that you had glaucoma?” A follow-up question asked if the respondent had ever lost any vision because of glaucoma.
Macular degeneration: Based on a positive response to the survey question, “Have you ever been told by a doctor or other health professional that you had macular degeneration?” A follow-up question asked if the respondent had ever lost any vision because of macular degeneration.
Years since diabetes diagnosis: Defined as the respondent’s age at interview minus the age given to the question, “How old were you when a doctor first told you that you had diabetes or sugar diabetes?” Age at diabetes was unknown for 2.3% of sample adults in the analysis.
Data source and methods
Data from the National Health Interview Survey (NHIS) were used for this analysis. NHIS is a multipurpose health survey conducted continuously throughout the year by the National Center for Health Statistics (NCHS). Interviews are conducted in person in respondents’ homes, but follow-ups to complete interviews may be conducted over the telephone. NHIS consists of four main components: the Household, the Family, the Sample Adult, and the Sample Child. These components include both a core set of questions that remain relatively unchanged from year to year as well as supplemental questions that are not asked every year. During 2016‒2017, NHIS supplementary questions included expanded content on vision. Data for this analysis came from the 2016–2017 NHIS Sample Adult core component and the supplementary questions on vision. For more information about NHIS, including the questionnaire and annual supplements, visit the NHIS website.
All analyses used weights to produce national estimates. Estimates on eye disorders in this report are nationally representative of the civilian noninstitutionalized population of adults aged 45 and over with diagnosed diabetes living in households across the United States. The sample design is described in more detail elsewhere (6). To control for the effect of age on the years since diabetes diagnosis, estimates were age adjusted using the projected 2000 U.S. population from the U.S. Census Bureau as the standard population (7). Estimates for adults aged 45 and over were age adjusted using age groups 45–49, 50–64, and 65 and over. The percentages of vision loss due to each of these eye disorders are among adults aged 45 and over with diagnosed diabetes, not among those with a specific eye disorder. Point estimates and their estimated variances were calculated using SAS-callable SUDAAN version 11.0 (RTI International, Research Triangle Park, N.C.) to account for the complex sample design of NHIS. Differences between percentages were evaluated using two-sided significance tests at the 0.05 level. All estimates presented meet NCHS guidelines for the presentation of proportions (8).
About the authors
Amy E. Cha, Maria A. Villarroel, and Anjel Vahratian are with the National Center for Health Statistics, Division of Health Interview Statistics.
References
- Blackwell DL, Villarroel MA. Tables of summary health statistics for U.S. adults: 2017 National Health Interview Surveypdf icon. National Center for Health Statistics. 2018.
- American Diabetes Association. Eye complicationsexternal icon.
- Solomon SD, Chew E, Duh EJ, Sobrin L, Sun JK, VanderBeek BL, et al. Diabetic retinopathy: A position statement by the American Diabetes Association. Diabetes Care 40(9):412–8. 2017.
- American Diabetes Association. Position statement 11. Microvascular complications and foot care: Standards of medical care in diabetes–2019. Diabetes Care 42(Suppl 1):S124–38. 2019.
- Senra H, Barbosa F, Ferreira P, Vieira CR, Perrin PB, Rogers H, et al. Psychologic adjustment to irreversible vision loss in adults: A systematic review. Ophthalmology 122(4):851–61. 2015.
- National Center for Health Statistics. 2017 National Health Interview Survey: Survey descriptionpdf icon. 2018.
- Klein RJ, Schoenborn CA. Age adjustment using the 2000 projected U.S. population. Healthy People Statistical Notes, no 20. Hyattsville, MD: National Center for Health Statistics. January 2001.
- Parker JD, Talih M, Malec DJ, Beresovsky V, Carroll M, Gonzalez Jr. JF, et al. National Center for Health Statistics Data Presentation Standards for Proportionspdf icon. National Center for Health Statistics. Vital Health Stat 2(175). 2017.
Suggested citation
Cha AE, Villarroel MA, Vahratian A. Eye disorders and vision loss among U.S. adults aged 45 and over with diagnosed diabetes, 2016–2017. NCHS Data Brief, no 344. Hyattsville, MD: National Center for Health Statistics. 2019.
Copyright information
All material appearing in this report is in the public domain and may be reproduced or copied without permission; citation as to source, however, is appreciated.
National Center for Health Statistics
Jennifer H. Madans, Ph.D., Acting Director
Amy M. Branum, Ph.D., Acting Associate Director for Science
Division of Health Interview Statistics
Stephen J. Blumberg, Ph.D., Director
Anjel Vahratian, Ph.D., M.P.H., Associate Director for Science