Strategies Used by Adults Aged 65 and Over to Reduce Their Prescription Drug Costs, 2016–2017
- Key findings
- Among adults aged 65 and over prescribed medication in the past 12 months, women were more likely than men to not take their medication as prescribed to save money.
- Adults aged 65–74 were more likely than those aged 75 and over to not take their medication as prescribed and to ask their doctor for a lower-cost medication.
- Among adults aged 65 and over, strategies used to reduce prescription drug costs varied by health insurance coverage.
- Among adults aged 65 and over, strategies used to reduce their prescription drug costs varied by poverty status.
- Summary
- Definitions
- Data source and methods
- About the authors
- References
- Suggested citation
PDF Version (481 KB)
Robin A. Cohen, Ph.D., and Peter Boersma, M.P.H.
Key findings
Data from the National Health Interview Survey
- Among adults aged 65 and over who were prescribed medication in the past 12 months, 4.8% did not take their medication as prescribed to reduce their prescription drug costs, and 17.7% asked their doctor for a lower-cost medication.
- Women (5.6%) were more likely than men (3.7%) to not take their medication as prescribed.
- Adults aged 65–74 were more likely than those aged 75 and over to not take their medication as prescribed and to ask their doctor for a lower-cost medication.
- Adults with Medicare only were more likely than adults with private coverage, Medicare and Medicaid, or Medicare Advantage to not take their medication as prescribed.
- Adults who were near poor were more likely than those who were poor or not poor to ask for a lower-cost medication.
In 2017, 86% of U.S. adults aged 65 and over reported being prescribed medication in the past 12 months (1). Most adults aged 65 and over have prescription drug coverage through either Medicare Part D or some source such as private health insurance, Medicaid, or Veterans Administration coverage (2). However, previous data indicate that some may still use strategies to reduce prescription drug costs, including not taking their medication as prescribed or asking their doctor for a lower-cost medication (3). This report examines the percentage of adults aged 65 and over who used these strategies to reduce their prescription drug costs in the past 12 months by selected characteristics.
Keywords: medication, nonadherence, National Health Interview Survey
Among adults aged 65 and over prescribed medication in the past 12 months, women were more likely than men to not take their medication as prescribed to save money.
- In 2016–2017, among adults aged 65 and over who were prescribed medication in the past 12 months, 4.8% did not take their medication as prescribed, and 17.7% asked their doctor for a lower-cost medication (Figure 1).
- Women (5.6%) were more likely than men (3.7%) to not take their medication as prescribed.
- The percentage of women who asked their doctor for a lower-cost medication (18.3%) was similar to that of men (17.0%).
Figure 1. Percentage of adults aged 65 and over who were prescribed medication in the past 12 months and used selected strategies to reduce their prescription drug costs, by sex: United States, 2016–2017
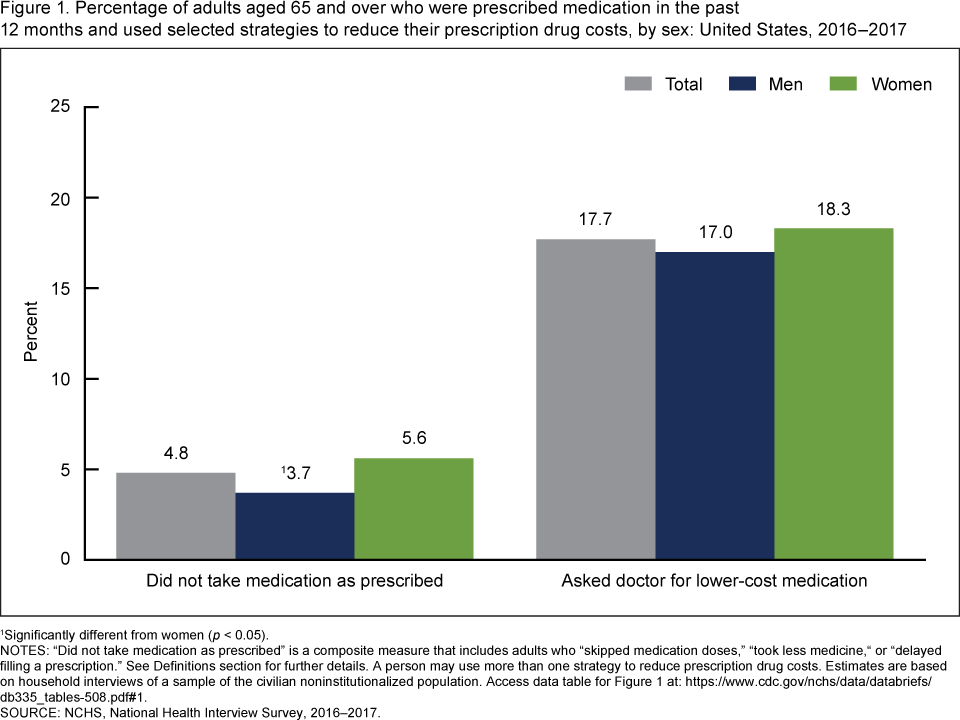
1Significantly different from women ( p < 0.05).
NOTES: “Did not take medication as prescribed” is a composite measure that includes adults who “skipped medication doses,” “took less medicine,” or “delayed filling a prescription.” ”See Definitions section for further details. A person may use more than one strategy to reduce prescription drug costs. Estimates are based on household interviews of a sample of the civilian noninstitutionalized population. Access data table for Figure 1.
SOURCE: NCHS, National Health Interview Survey, 2016–2017.
Adults aged 65–74 were more likely than those aged 75 and over to not take their medication as prescribed and to ask their doctor for a lower-cost medication.
- Among adults aged 65 and over who were prescribed medication in the past 12 months, those aged 65–74 (6.1%) were twice as likely as those aged 75 and over (2.9%) to not take their medication as prescribed (Figure 2).
- Adults aged 65–74 (19.9%) were more likely than those aged 75 and over (14.6%) to ask their doctor for a lower-cost medication.
Figure 2. Percentage of adults aged 65 and over who were prescribed medication in the past 12 months and used selected strategies to reduce their prescription drug costs, by age group: United States, 2016–2017
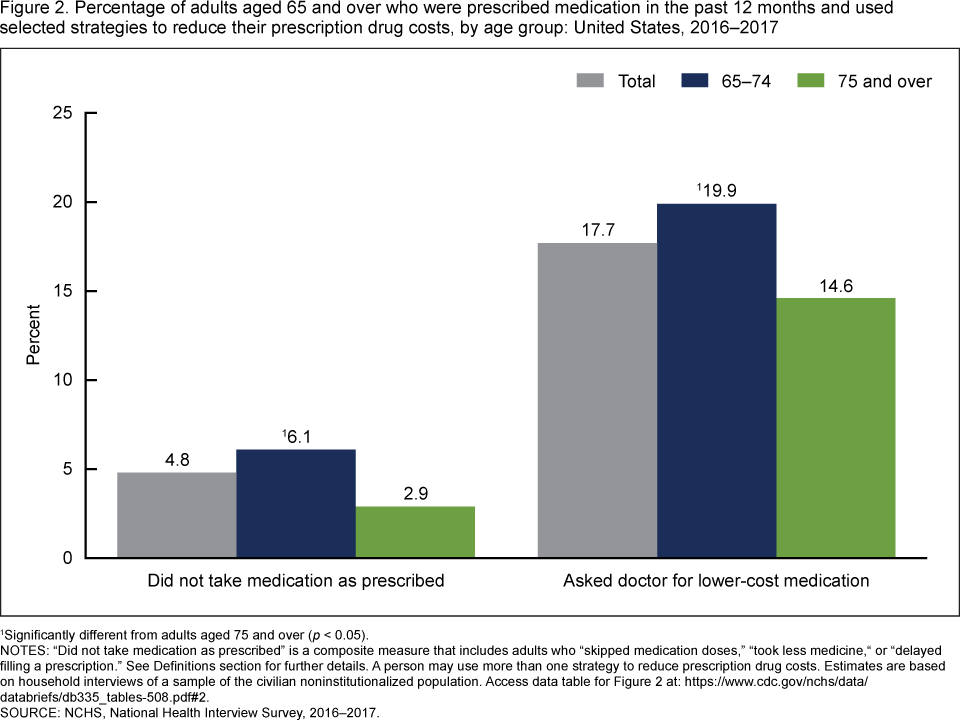
1Significantly different from adults aged 75 and over ( p < 0.05).
NOTES: “Did not take medication as prescribed” is a composite measure that includes adults who “skipped medication doses,” “took less medicine,” or “delayed filling a prescription.” See Definitions section for further details. A person may use more than one strategy to reduce prescription drug costs. Estimates are based on household interviews of a sample of the civilian noninstitutionalized population. Access data table for Figure 2.
SOURCE: NCHS, National Health Interview Survey, 2016–2017.
Among adults aged 65 and over, strategies used to reduce prescription drug costs varied by health insurance coverage.
- Among adults aged 65 and over who were prescribed medication in the past 12 months, those with Medicare only (8.1%) were more likely than those with Medicare Advantage (5.5%), Medicare and Medicaid (5.2%), or private coverage (3.1%) to not take their medication as prescribed to save money (Figure 3).
- The percentage of adults aged 65 and over who did not take their medication as prescribed to save money was lowest among those with private coverage (3.1%) compared with those having Medicare and Medicaid, Medicaid Advantage plans, or Medicare only.
- Adults aged 65 and over with Medicare only (20.4%), Medicare Advantage (19.2%), or private coverage (18.4%) were more likely than those with Medicare and Medicaid (14.1%) to ask their doctor for a lower-cost medication.
Figure 3. Percentage of adults aged 65 and over who were prescribed medication in the past 12 months and used selected strategies to reduce their prescription drug costs, by insurance coverage status: United States, 2016–2017
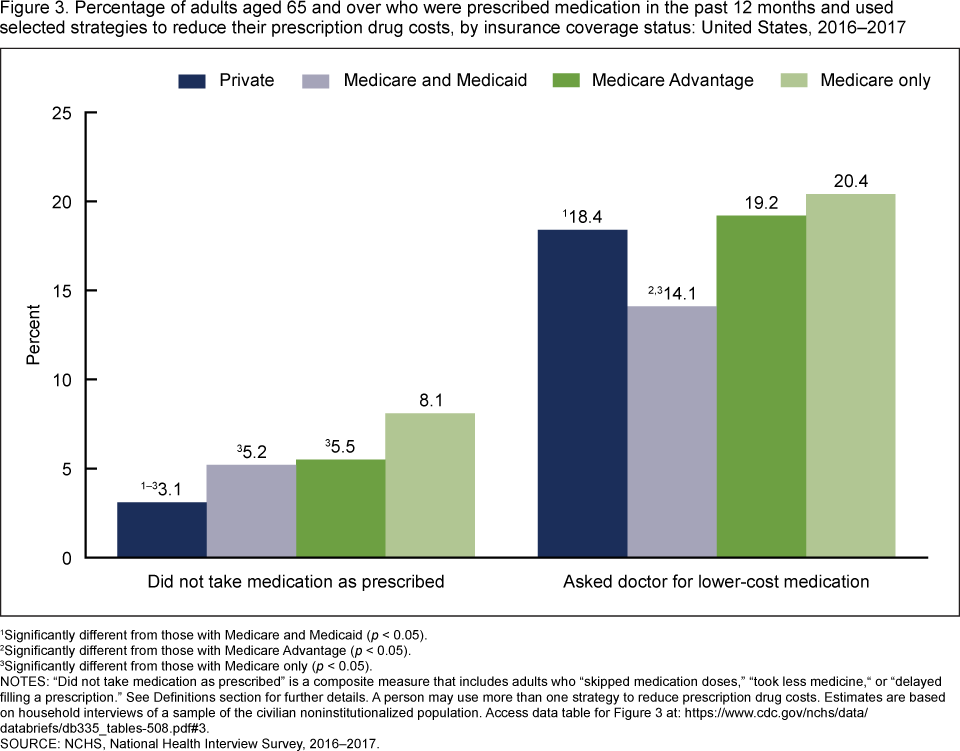
1Significantly different from those with Medicare and Medicaid ( p < 0.05).
2Significantly different from those with Medicare Advantage ( p < 0.05).
3Significantly different from those with Medicare only ( p < 0.05).
NOTES: “Did not take medication as prescribed” is a composite measure that includes adults who “skipped medication doses,” “took less medicine,” or “delayed filling a prescription.” See Definitions section for further details. A person may use more than one strategy to reduce prescription drug costs. Estimates are based on household interviews of a sample of the civilian noninstitutionalized population. Access data table for Figure 3.
SOURCE: NCHS, National Health Interview Survey, 2016–2017.
Among adults aged 65 and over, strategies used to reduce their prescription drug costs varied by poverty status.
- Among adults aged 65 and over who were prescribed medication in the past 12 months, those who were poor (7.6%) and those who were near poor (8.9%) were more likely than those who were not poor (3.3%) to not take their medication as prescribed to reduce their prescription drug costs (Figure 4).
- Adults who were near poor (21.2%) were more likely than those who were poor (17.3%) and those who were not poor (16.8%) to ask their doctor for a lower-cost medication.
Figure 4. Percentage of adults aged 65 and over who were prescribed medication in the past 12 months and used selected strategies to reduce their prescription drug costs, by poverty status: United States, 2016–2017
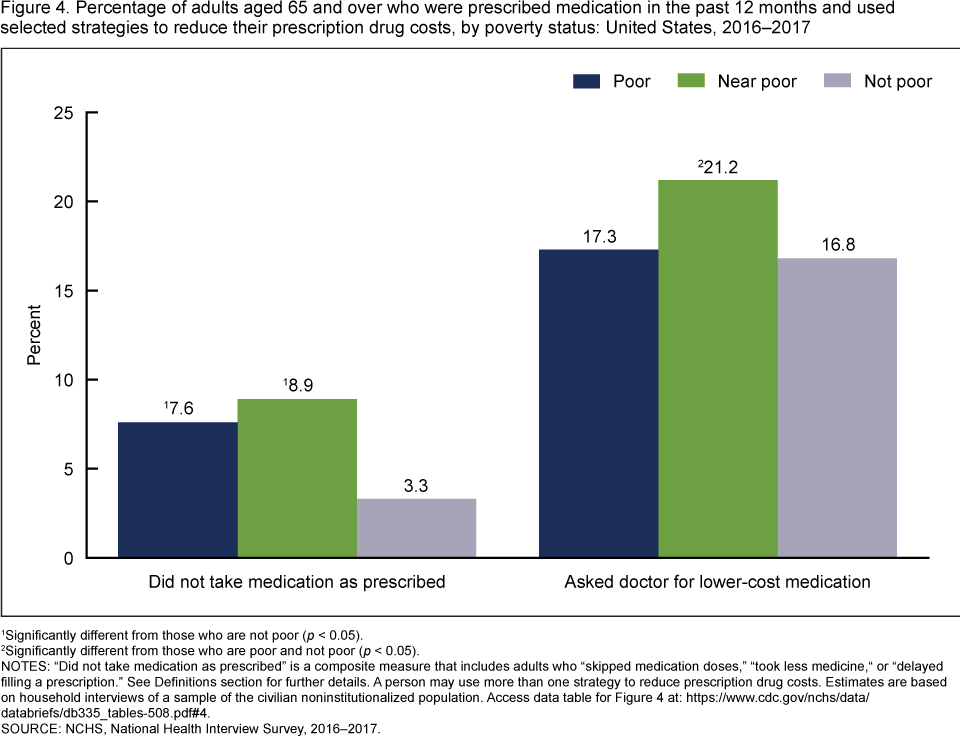
1Significantly different from those who are not poor ( p < 0.05).
1Significantly different from those who are poor and not poor ( p < 0.05).
NOTES: “Did not take medication as prescribed” is a composite measure that includes adults who “skipped medication doses,” “took less medicine,” or “delayed filling a prescription.” See Definitions section for further details. A person may use more than one strategy to reduce prescription drug costs. Estimates are based on household interviews of a sample of the civilian noninstitutionalized population. Access data table for Figure 4.
SOURCE: NCHS, National Health Interview Survey, 2016–2017.
Summary
In 2016–2017, among U.S. adults aged 65 and over who were prescribed medication in the past 12 months, the percentage who did not take their medication as prescribed or asked their doctor for a lower-cost medication to reduce their prescription drug costs varied by sex, age, insurance status, and poverty status. Among adults aged 65 and over, women, those aged 65–74, those with Medicare only, and those who were near poor were the most likely to not take their medication as prescribed. Adults aged 75 and over, those with Medicare and Medicaid coverage, and those who were not poor were the least likely to ask their doctor for a lower-cost medication.
In 2017, prescriptions for chronic conditions accounted for more than two-thirds of all the prescriptions in the United States (4). In 2016, 61.7% of adults aged 65 and over had at least two or more chronic conditions (5). In 2017, among adults aged 75 and over, 19.8% had been diagnosed with diabetes, 59.8% with hypertension, and 55.4% with arthritis (6). However, note that the National Health Interview Survey (NHIS) does not have information about the types of medication for which cost-saving strategies were used. Cost-saving strategies to reduce prescription drug costs may have implications for health status and have been associated with increased emergency room use and hospitalizations compared with adults who follow recommended pharmacotherapy (7,8).
Definitions
Strategies for reducing prescription drug costs: Based on the survey questions: The following questions concern the use of prescription medication: During the past 12 months, are any of the following true for you? … [1] You skipped medication doses to save money … [2] You took less medicine to save money … [3] You delayed filling a prescription to save money … [4] You asked your doctor for a lower-cost medication to save money. Adults were asked questions 1 through 4 only if they reported having been prescribed medication by a doctor or other health care provider during the past 12 months. For this analysis, only those adults who were prescribed medication in the past 12 months were included.
Did not take medication as prescribed: Based on a positive response to any of the following three questions described previously: … You skipped medication doses to save money … You took less medicine to save money … You delayed filling a prescription to save money.
Poverty status: Categories are based on the ratio of the family’s income in the previous calendar year to the appropriate poverty threshold (given the family’s size and number of children), as defined by the U.S. Census Bureau. Adults were considered poor if their family poverty level fell below 100% of the threshold. Adults were considered near poor if their family poverty level fell at or above 100% but below 200%. Adults were considered not poor if their family poverty level fell at or above 200%.
Health insurance coverage: At the time of interview, respondents reported their type(s) of coverage. A health insurance hierarchy of six mutually exclusive categories was developed (9,10). Adults with more than one type of health insurance were assigned to the first appropriate category in the following hierarchy: Private coverage, Medicare and Medicaid, Medicare Advantage, Medicare only (no Advantage), other coverage, and uninsured. Due to small sample sizes, adults with “other coverage” and those who are uninsured are included in the totals but are not shown separately.
In this report, strategies used to reduce prescription drug costs are based on the 12 months prior to interview, while health insurance coverage was measured at the time of interview. Therefore, adults’ health insurance status may have been different at the time they used a strategy to reduce their prescription drug costs.
Data source and methods
Data from the 2016–2017 NHIS were used for this analysis. NHIS is a nationally representative, household survey of the civilian noninstitutionalized U.S. population. It is conducted continuously throughout the year by the National Center for Health Statistics (NCHS). Interviews are conducted in the respondent’s home, but follow-ups to complete interviews may be conducted by telephone when necessary. For more information about NHIS, visit the NHIS website at: https://www.cdc.gov/nchs/nhis.htm.
Point estimates and the corresponding variances were calculated using SUDAAN software (11) to account for the complex sample design of NHIS. All estimates in this report meet NCHS standards of reliability as specified in, “National Center for Health Statistics Data Presentation Standards for Proportions” (12). Linear and quadratic trends by poverty status were evaluated using logistic regression. Differences between percentages were evaluated using two-sided significance tests at the 0.05 level.
About the authors
Robin A. Cohen and Peter Boersma are with the National Center for Health Statistics, Division of Health Interview Statistics.
References
- Boersma P, Cohen RA, Vahratian A. QuickStats: Percentage of adults aged ≥ 18 years who were prescribed medication in the past 12 months, by sex and age group—National Health Interview Survey, 2017. MMWR 68(4):97. 2019.
- Medicare Payment Advisory Commission. June 2018 data book: Health care spending and the Medicare program. 2018.
- Cohen RA, Villarroel MA. Strategies used by adults to reduce their prescription drug costs: United States, 2013. NCHS Data Brief, no 184. Hyattsville, MD: National Center for Health Statistics. 2015.
- IQVIA Institute for Human Data Science. Medicine use and spending in the U.S.: A review of 2017 and outlook to 2022. 2018.
- National Center for Health Statistics. Health, United States, 2017: With special feature on mortality. Hyattsville, MD. 2018.
- Blackwell DL, Villarroel MA. Tables of summary health statistics for U.S. adults: 2017 National Health Interview Survey. National Center for Health Statistics. 2018.
- Heisler M, Choi H, Rosen AB, Vijan S, Kabeto M, Langa KM, Piette JD. Hospitalizations and deaths among adults with cardiovascular disease who underuse medications because of cost: A longitudinal analysis. Med Care 48(2):87–94. 2010.
- Jha AK, Aubert RE, Yao J, Teagarden JR, Epstein RS. Greater adherence to diabetes drugs is linked to less hospital use and could save nearly $5 billion annually. Health Aff (Millwood) 31(8):1836–46. 2012.
- National Center for Health Statistics. Data file documentation, National Health Interview Survey, 2015 (machine-readable data file and documentation). 2016.
- National Center for Health Statistics. Technical notes for summary health statistics tables: National Health Interview Survey.
- RTI International. SUDAAN (Release 11.0.01) [computer software]. 2013.
- Parker JD, Talih M, Malec DJ, Beresovsky V, Carroll M, Gonzalez Jr JF. National Center for Health Statistics Data Presentation Standards for Proportions. National Center for Health Statistics. Vital Health Stat 2(175). 2017.
Suggested citation
Cohen RA, Boersma P. Strategies used by adults aged 65 and over to reduce their prescription drug costs, 2016–2017. NCHS Data Brief, no 335. Hyattsville, MD: National Center for Health Statistics. 2019.
Copyright information
All material appearing in this report is in the public domain and may be reproduced or copied without permission; citation as to source, however, is appreciated.
National Center for Health Statistics
Jennifer H. Madans, Ph.D., Acting Director
Amy M. Branum, Ph.D., Acting Associate Director for Science
Division of Health and Nutrition Examination Surveys
Stephen J. Blumberg, Ph.D., Director
Anjel Vahratian, Ph.D., M.P.H., Associate Director for Science