Hospitalization for Total Knee Replacement Among Inpatients Aged 45 and Over: United States, 2000–2010
- Key findings
- Did the rate of total knee replacement in the population aged 45 and over vary by sex from 2000 through 2010?
- Did the rate of total knee replacement vary by sex and age in 2000 and 2010?
- Has the mean age at which inpatients aged 45 and over have total knee replacement changed from 2000 through 2010?
- Did being discharged home after a total knee replacement vary by age and sex?
- Summary
- Definitions
- Data source and methods
- About the authors
- References
- Suggested citation
NCHS Data Brief No. 210, August 2015
PDF Version (751 KB)
Sonja N. Williams, M.P.H.; Monica L. Wolford, M.A.; and Anita Bercovitz, M.P.H., Ph.D.
Key findings
- The rate of total knee replacement increased for both men (86%) and women (99%) aged 45 and over from 2000 through 2010.
- For both 2000 and 2010, women had a higher rate of total knee replacement (33.0 and 65.5 per 10,000 population, respectively) than men (24.3 and 45.3 per 10,000, respectively).
- The mean age at total knee replacement decreased from 2000 through 2010 for both men and women aged 45 and over.
- Higher percentages of men and women aged 45 and over who were hospitalized for total knee replacement were discharged home in 2010 (69.8% and 54.1%) than in 2000 (53.5% and 40.8%).
- In both 2000 and 2010, a lower percentage of women aged 45 and over (40.8% and 54.1%, respectively) were discharged home after total knee replacement than men aged 45 and over (53.5% and 69.8%, respectively).
In 2010, total knee replacement was the most frequently performed inpatient procedure on adults aged 45 and over. In the 11-year period from 2000 through 2010, an estimated 5.2 million total knee replacements were performed. Adults aged 45 and over comprised 98.1% of those surgeries. This report uses data from the National Hospital Discharge Survey (NHDS) to present trends in the rate of hospitalizations for total knee replacement, mean age at hospitalization, and discharge status for inpatients aged 45 and over from 2000 through 2010.
Keywords: inpatient care • health care utilization • hospitalization trends • National Hospital Discharge Survey
Did the rate of total knee replacement in the population aged 45 and over vary by sex from 2000 through 2010?
- The rate of total knee replacement increased for both men and women. Among men, the rate increased from 24.3 per 10,000 population in 2000 to 45.3 per 10,000 in 2010 (an 86% increase) (Figure 1). Among women, the rate almost doubled from 33.0 per 10,000 in 2000 to 65.5 per 10,000 in 2010 (a 99% increase).
- The rate of total knee replacement was higher for women compared with men for each year of the 11-year period. In 2000, the rate of total knee replacement for women was 35.8% higher than for men (33.0 and 24.3, respectively). In 2010, the rate of total knee replacement for women was 45.6% higher than for men (65.5 and 45.3, respectively).
Figure 1. Total knee replacement among inpatients aged 45 and over, by sex: United States, 2000–2010
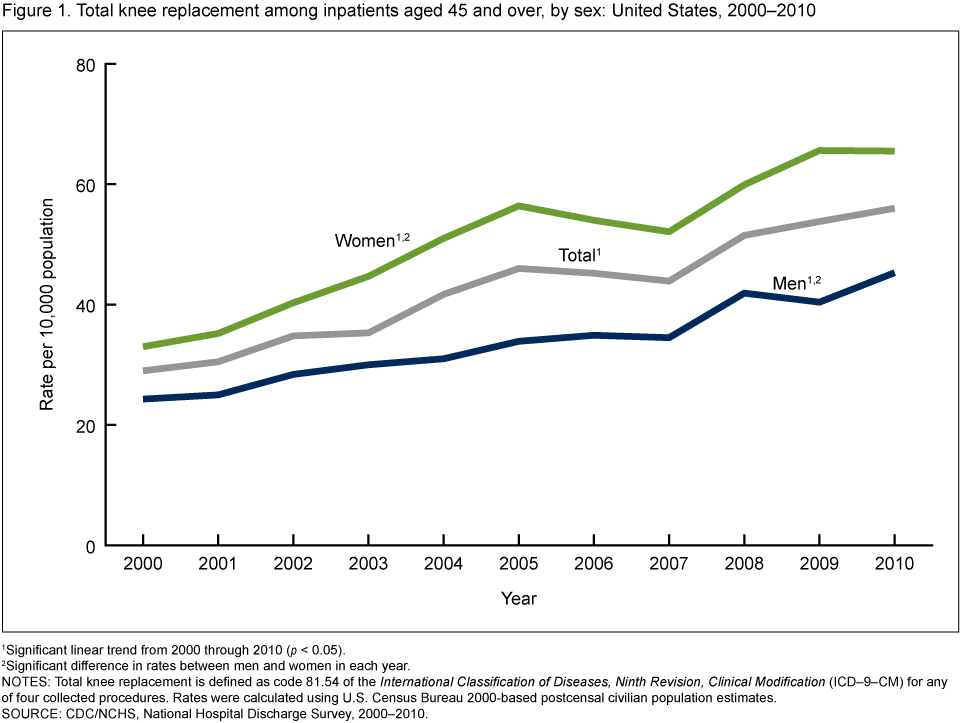
1Significant linear trend from 2000 through 2010 (p < 0.05).
2Significant difference in rates between men and women in each year.
NOTES: Total knee replacement is defined as code 81.54 of the International Classification of Diseases, Ninth Revision, Clinical Modification (ICD–9–CM) for any of four collected procedures. Rates were calculated using U.S. Census Bureau 2000-based postcensal civilian population estimates.
SOURCE: CDC/NCHS, National Hospital Discharge Survey, 2000–2010.
Did the rate of total knee replacement vary by sex and age in 2000 and 2010?
- Women aged 45–64 had higher rates (16.4 and 46.6) than men aged 45–64 (8.7 and 28.6) in both 2000 and 2010 (Figure 2).
- In 2000, there was no difference in the rate of total knee replacement between men and women aged 65 and over, while in 2010, women had a higher rate (99.3) than men (82.6).
- Those aged 65 and over had higher rates of total knee replacement than those aged 45–64 in both 2000 and 2010 (58.0 and 92.1, respectively for those aged 65 and over compared with 12.7 and 37.8 for those aged 45–64).
- Higher rates of total knee replacement were found for both men and women aged 65 and over compared with those aged 45–64 in both 2000 and 2010.
Figure 2. Total knee replacement among inpatients aged 45 and over, by sex and age group: United States, 2000 and 2010
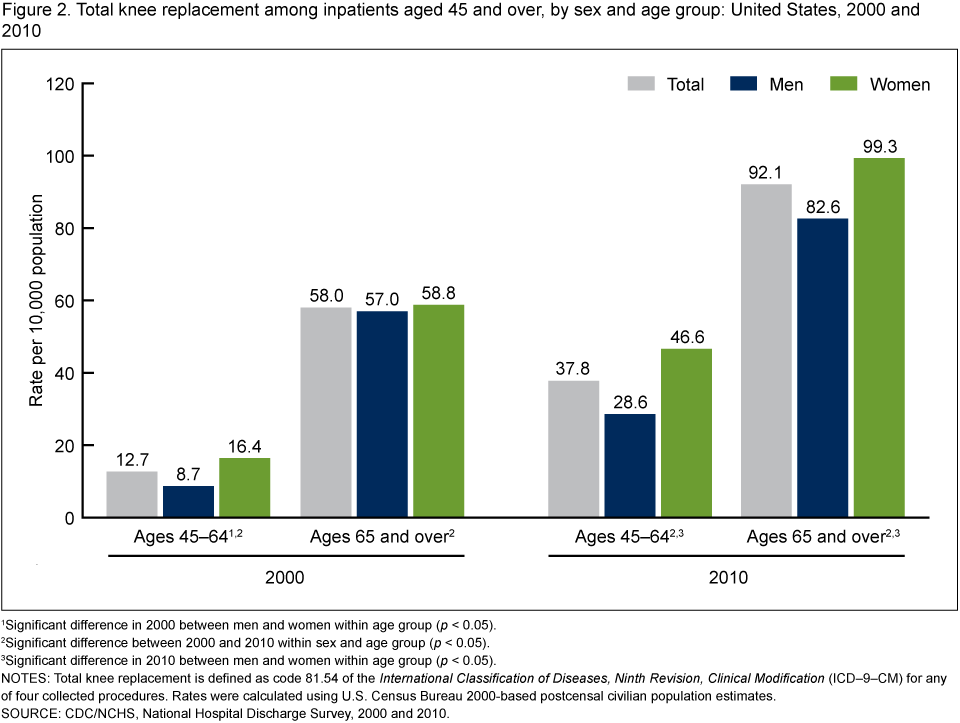
1Significant difference in 2000 between men and women within age group (p < 0.05).
2Significant difference between 2000 and 2010 within sex and age group (p < 0.05).
3Significant difference in 2010 between men and women within age group (p < 0.05).
NOTES: Total knee replacement is defined as code 81.54 of the International Classification of Diseases, Ninth Revision, Clinical Modification (ICD–9–CM) for any of four collected procedures. Rates were calculated using U.S. Census Bureau 2000-based postcensal civilian population estimates.
SOURCE: CDC/NCHS, National Hospital Discharge Survey, 2000 and 2010.
Has the mean age at which inpatients aged 45 and over have total knee replacement changed from 2000 through 2010?
- Overall, the mean age for having a total knee replacement was lower in 2010 compared with 2000, by 3.9%, decreasing from 68.9 in 2000 to 66.2 in 2010 (Figure 3).
- Among men, the mean age decreased from 69.3 to 66.5, and among women, the mean age decreased from 68.7 to 66.0.
Figure 3. Mean age at total knee replacement among inpatients aged 45 and over, by sex: United States, 2000 and 2010
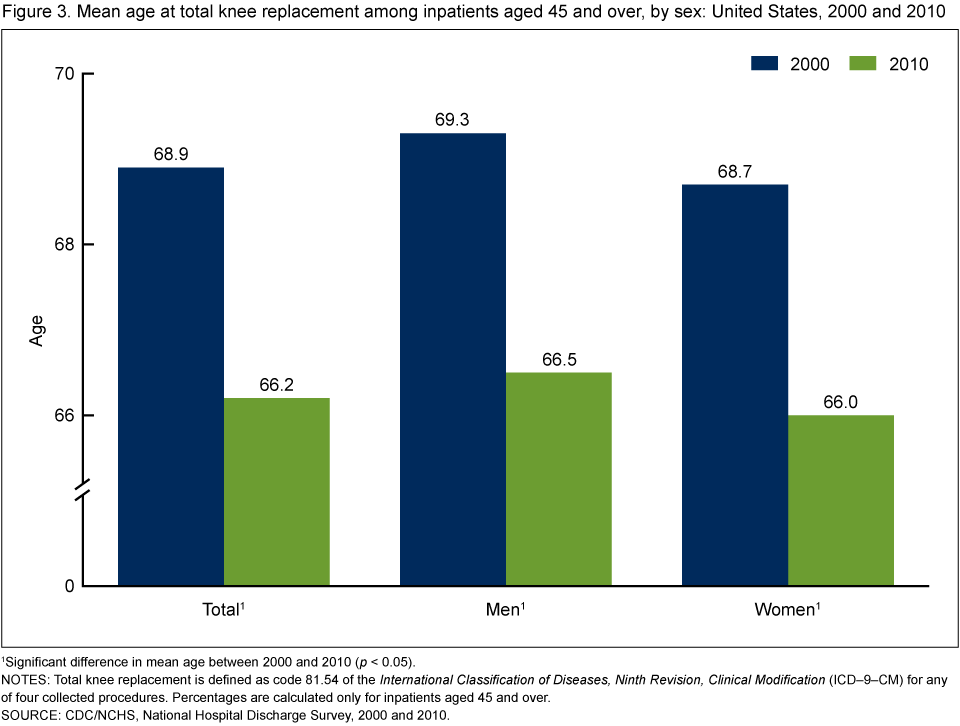
1Significant difference in mean age between 2000 and 2010 (p < 0.05).
NOTES: Total knee replacement is defined as code 81.54 of the International Classification of Diseases, Ninth Revision, Clinical Modification (ICD–9–CM) for any of four collected procedures. Percentages are calculated only for inpatients aged 45 and over.
SOURCE: CDC/NCHS, National Hospital Discharge Survey, 2000 and 2010.
Did being discharged home after a total knee replacement vary by age and sex?
- The percentages of men and women aged 45 and over discharged home after hospitalization for total knee replacement were higher in 2010 (69.8% and 54.1%, respectively) than in 2000 (53.5% and 40.8%, respectively) (Figure 4).
- In both 2000 and 2010, lower percentages of women than men were discharged home after total knee replacement.
- In 2010, nearly two-thirds of men aged 65 and over (62.3%) were discharged home, while less than one-half of women aged 65 and over (42.5%) were discharged home.
Figure 4. Inpatients aged 45 and over with total knee replacement discharged home, by sex and age group: United States, 2000 and 2010
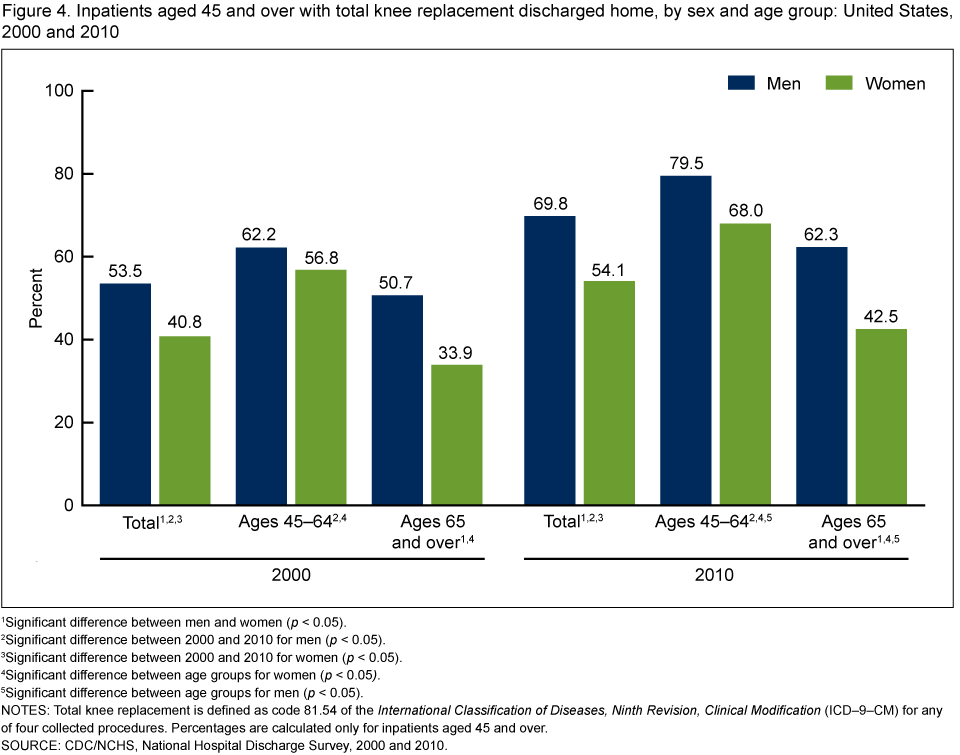
1Significant difference between men and women (p < 0.05).
2Significant difference between 2000 and 2010 for men (p < 0.05).
3Significant difference between 2000 and 2010 for women (p < 0.05).
4Significant difference between age groups for women (p < 0.05).
5Significant difference between age groups for men (p < 0.05).
NOTES: Total knee replacement is defined as code 81.54 of the International Classification of Diseases, Ninth Revision, Clinical Modification (ICD–9–CM) for any of four collected procedures. Percentages are calculated only for inpatients aged 45 and over.
SOURCE: CDC/NCHS, National Hospital Discharge Survey, 2000 and 2010.
Summary
From 2000 through 2010, total knee replacement was among the five most frequent of all inpatient procedures, and it was the most frequent procedure in 2008, 2009, and 2010 (data not shown). There were an estimated 693,400 total knee replacements performed among inpatients aged 45 and over in 2010.
The rate of total knee replacement for men and women almost doubled from 2000 through 2010. Among men, the rate increased from 24.3 per 10,000 in 2000 to 45.3 in 2010, and among women, the rate increased from 33.0 in 2000 to 65.5 in 2010. The rate of total knee replacement was, on average, 50% higher for women compared with men for each year from 2000 through 2010. Also, in both 2000 and 2010, women aged 45–64 had higher rates (16.4 and 46.6, respectively) of total knee replacement than men (8.7 and 28.6). For those aged 65 and over, women had a higher rate (99.3) than men (82.6), but only in 2010.
From 2000 through 2010, the mean age at which inpatients aged 45 and over had total knee replacement decreased significantly, from 68.9 to 66.2, a 3.9% decrease. Among men, the mean age decreased from 69.3 to 66.5, and among women, the mean age decreased from 68.7 to 66.0.
Most inpatients aged 45 and over were discharged home after a total knee replacement. In both 2000 and 2010, higher percentages of men aged 65 and over were discharged home than were women aged 65 and over. A higher percentage of women in this age group was discharged to long-term care facilities compared with men (data not shown).
Definitions
Total knee replacement: Total knee replacement or total knee arthroplasty is a surgery for people with severe knee damage. During a total knee replacement operation, the surgeon removes damaged cartilage and bone from the femur, tibia, and sometimes the patella, and replaces them with new, artificial parts. One or both knees may be replaced, though double knee replacements are rare. Partial knee replacement is a procedure where only one part of the knee is replaced, and these are excluded from this report (1).
Hospitalization for total knee replacement: Includes those admitted with at least one procedure code for total knee replacement as denoted by the International Classification of Diseases, Ninth Revision, Clinical Modification (ICD–9–CM) code 81.54 (2).
Rate: Refers to the number of hospitalizations per unit of population (i.e., per 10,000 population). Using rates removes the influence of different population sizes (e.g., age groups with different population sizes over multiple years) so that data can be compared across these groups. Rates were calculated using U.S. Census Bureau 2000-based postcensal civilian population estimates.
Home discharge status: Refers to inpatients discharged to return home. This includes all inpatients referred to home care services, specialty clinics, family physicians, home health care providers, or discharged to a relative, foster home, or transferred to a correctional institution.
Data source and methods
Data for this report are from NHDS, a national probability sample survey of discharges from nonfederal, short-stay hospitals or general hospitals in the United States. The survey was conducted from 1965 through 2010 by the Centers for Disease Control and Prevention’s (CDC) National Center for Health Statistics, Division of Health Care Statistics. Survey data on hospital discharges were obtained from the hospitals’ administrative data. If an individual is admitted to the hospital multiple times during the survey year, that individual could be counted more than once in NHDS.
Because of the complex multistage design of NHDS, the survey data must be inflated or weighted to produce national estimates. Estimates of inpatient care presented in this report are based on discharges aged 45 and over. More details about the design of NHDS have been published elsewhere (3).
From 2000 through 2009, information on up to four procedures was collected. The number of procedures was increased to eight in 2010. Trend data are based on data from up to four procedures, and for consistency, data reported for 2010 are also based on data from four procedures. The 2010 data were analyzed using both four and eight procedures; both methods generated an estimated 693,400 total knee replacements.
Statistics are based on the population aged 45 and over, and the denominator used for calculating percentages only includes those aged 45 and over. Inpatients under age 45 accounted for 1.9% (n = 103,000) of all total knee replacements from 2000 through 2010.
Age was imputed when missing. One percent of records or less had age imputed.
Differences among subgroups were evaluated with two-tailed t tests and Chi-square tests at the alpha = 0.05 level of significance. Terms that express differences such as “higher,” “lower,” “increased,” or “decreased” were only used when the differences were statistically significant. All comparisons reported in the text were statistically significant unless otherwise indicated. Data analyses were performed using the statistical packages SAS version 9.3 (SAS Institute, Cary, N.C.) and SUDAAN version 11.0 (RTI International, Research Triangle Park, N.C.).
About the authors
Sonja N. Williams, Monica L. Wolford, and Anita Bercovitz are with CDC’s National Center for Health Statistics, Division of Health Care Statistics.
References
- U.S. National Library of Medicine, MedlinePlus. Knee replacement. Bethesda, MD.
- Centers for Medicare & Medicaid Services. International classification of diseases, ninth revision, clinical modification. 6th ed. 2006.
- Hall MJ, DeFrances CJ, Williams SN, et al. National Hospital Discharge Survey: 2007 summary. National health statistics reports; no 29. Hyattsville, MD: National Center for Health Statistics. 2010.
Suggested citation
Williams SN, Wolford ML, Bercovitz A. Hospitalization for total knee replacement among inpatients aged 45 and over: United States, 2000–2010. NCHS data brief, no 210. Hyattsville, MD: National Center for Health Statistics. 2015.
Copyright information
All material appearing in this report is in the public domain and may be reproduced or copied without permission; citation as to source, however, is appreciated.
National Center for Health Statistics
Charles J. Rothwell, M.S., M.B.A., Director
Nathaniel Schenker, Ph.D., Deputy Director
Jennifer H. Madans, Ph.D., Associate Director for Science
Division of Health Care Statistics
Clarice Brown, M.S., Director