Depression and Obesity in the U.S. Adult Household Population, 2005–2010
- Key findings
- Adults with depression were more likely to be obese than adults without depression.
- In every age group, women with depression were more likely to be obese than women without depression.
- The relationship between obesity and depression varied by race and ethnicity only among women.
- The age-adjusted percentage of adults who were obese increased as depression severity increased.
- More than one-half of adults with moderate to severe depressive symptoms who were also taking antidepressant medication were obese.
- Summary
- Definitions
- Data sources and methods
- About the authors
- References
- Suggest citation
NCHS Data Brief No. 167, October 2014
PDF Version (670 KB)
Laura A. Pratt, Ph.D.; and Debra J. Brody, M.P.H.
Key findings
Data from the National Health and Nutrition Examination Surveys, 2005–2010
- Forty-three percent of adults with depression were obese, and adults with depression were more likely to be obese than adults without depression.
- In every age group, women with depression were more likely to be obese than women without depression.
- The prevalence of obesity was higher for non-Hispanic white women with depression compared with non-Hispanic white women without depression, a relationship that was not present in non-Hispanic black and Mexican-American women.
- The proportion of adults with obesity rose as the severity of depressive symptoms increased.
- Fifty-five percent of adults who were taking antidepressant medication, but still reported moderate to severe depressive symptoms, were obese.
In 2005–2010, 34.6% of U.S. adults aged 20 and over were obese and 7.2% had depression, based on depressive symptoms experienced in the past 2 weeks (1). Both obesity and depression are associated with many health risks, including cardiovascular disease, diabetes, and functional limitations (2–4). Studies have shown higher rates of obesity in persons with depression (5,6). This relationship may vary by sex (7). Almost 11% of adults take antidepressant medication (8) including persons who are responding well and persons who still have moderate to severe symptoms of depression. Use of some antidepressants is positively related to obesity (9). Understanding the relationship between depression (defined by moderate to severe symptoms) and antidepressant usage and obesity may inform treatment and prevention strategies for both conditions.
Keywords: NHANES, depressive symptoms, obese adults
Adults with depression were more likely to be obese than adults without depression.
Figure 1. Age-adjusted percentage of adults aged 20 and over who were obese, by sex and depression status: United States, 2005–2010
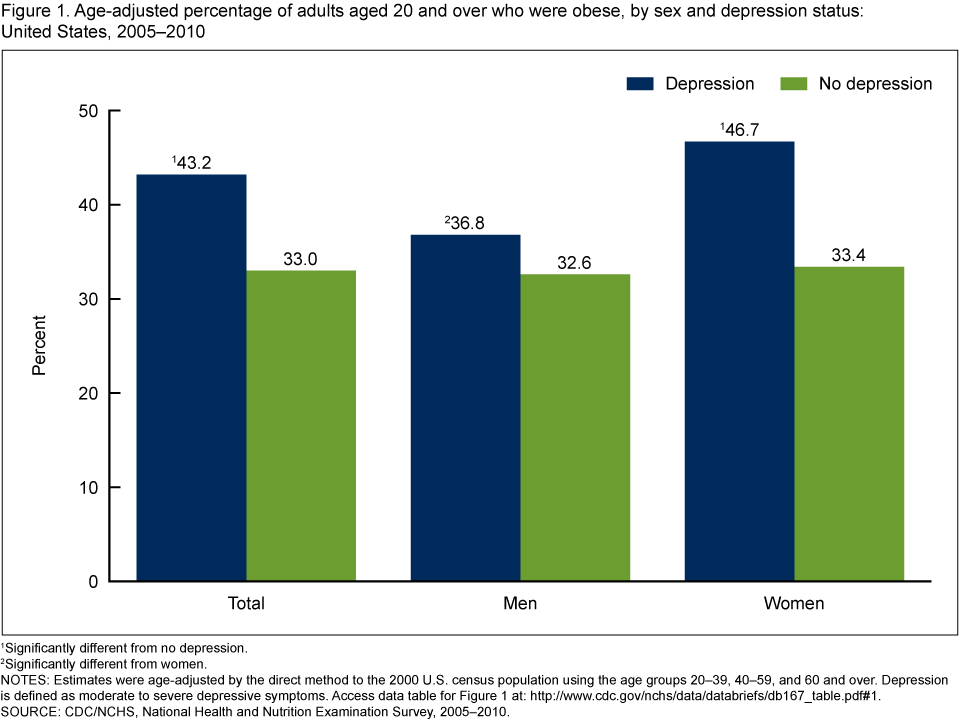
1Significantly different from no depression.
2Significantly different from women.
NOTES: Estimates were age-adjusted by the direct method to the 2000 U.S. census population using the age groups 20–39, 40–59, and 60 and over. Depression is defined as moderate to severe depressive symptoms. Access data table for Figure 1.
SOURCE: CDC/NCHS, National Health and Nutrition Examination Survey, 2005–2010.
- Forty-three percent of adults with depression were obese, while 33% of adults without depression were obese (Figure 1).
- Among men, rates of obesity did not differ by depression status.
- Women with depression were more likely to be obese than women without depression.
- Among persons with depression, women were more likely to be obese than men.
In every age group, women with depression were more likely to be obese than women without depression.
- Men aged 60 and over with depression were more likely to be obese than men of the same age without depression, but obesity rates did not differ by depression status for men under age 60 (Figure 2).
- Among men with depression, those aged 60 and over were more likely to be obese than those aged 20–39. Obesity did not vary by age among women with depression.
- Among men and women without depression, younger adults aged 20–39 were less likely to be obese than those aged 40 and over.
Figure 2. Percentage of adults aged 20 and over who were obese, by age, sex, and depression status: United States, 2005–2010
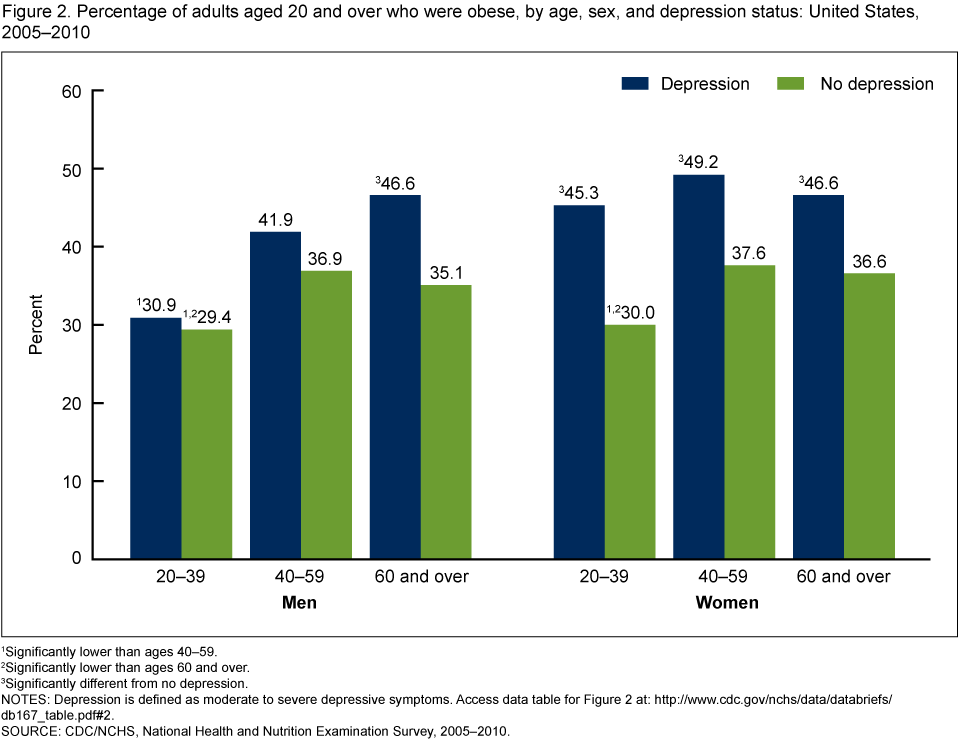
1Significantly lower than ages 40–59.
2Significantly lower than ages 60 and over.
3Significantly different from no depression.
NOTES: Depression is defined as moderate to severe depressive symptoms. Access data table for Figure 2.
SOURCE: CDC/NCHS, National Health and Nutrition Examination Survey, 2005–2010.
The relationship between obesity and depression varied by race and ethnicity only among women.
- Forty-five percent of non-Hispanic white women with depression were obese, while 32% of non-Hispanic white women who did not have depression were obese (Figure 3).
- Among non-Hispanic black and Mexican-American men and women, rates of obesity did not differ by depression status.
Figure 3. Age-adjusted percentage of adults aged 20 and over who were obese, by sex, race/ethnicity, and depression status: United States, 2005–2010
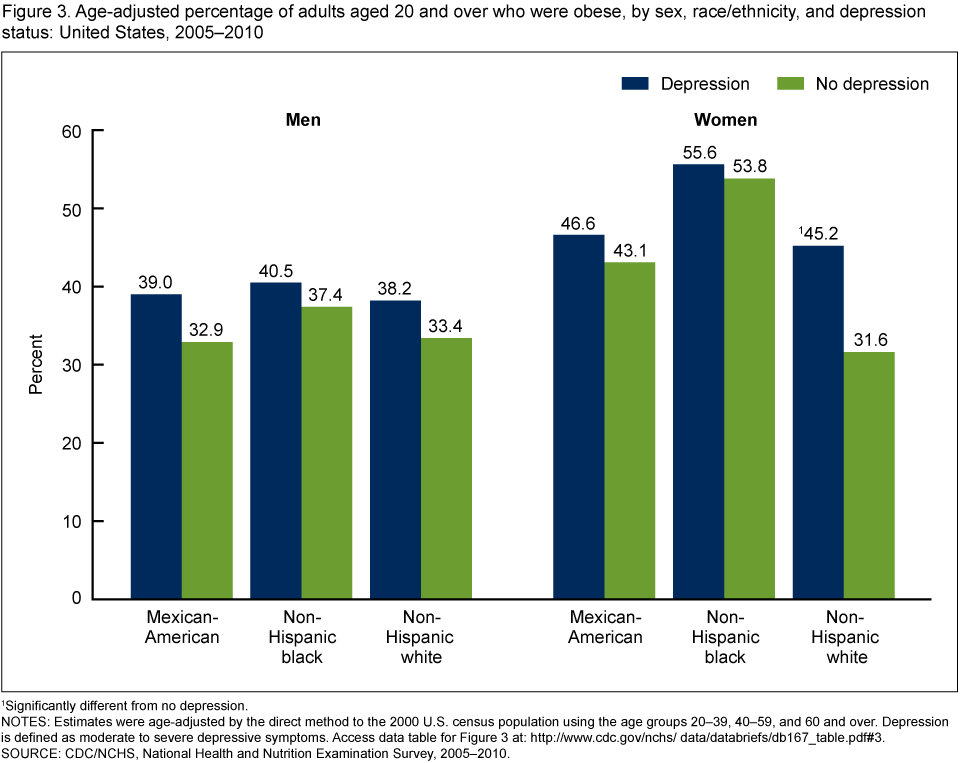
1Significantly different from no depression.
NOTES: Estimates were age-adjusted by the direct method to the 2000 U.S. census population using the age groups 20–39, 40–59, and 60 and over. Depression is defined as moderate to severe depressive symptoms. Access data table for Figure 3.
SOURCE: CDC/NCHS, National Health and Nutrition Examination Survey, 2005–2010.
The age-adjusted percentage of adults who were obese increased as depression severity increased.
- Obesity was related to depression severity only among women (Figure 4).
- One-half of women with severe depressive symptoms were obese compared with one-third of women with no depressive symptoms.
- Women at any level of depressive symptom severity were more likely to be obese than women with no depressive symptoms.
Figure 4. Age-adjusted percentage of adults aged 20 and over who were obese, by sex and depression severity: United States, 2005–2010

1Statistically significant trend.
2Significantly different than other severity categories.
NOTES: Estimates were age-adjusted by the direct method to the 2000 U.S. census population using the age groups 20–39, 40–59, and 60 and over. Moderate and severe indicate depression, while mild indicates mild depressive symptoms, which are not included in the definition of depression. Access data table for Figure 4.
SOURCE: CDC/NCHS, National Health and Nutrition Examination Survey, 2005–2010.
More than one-half of adults with moderate to severe depressive symptoms who were also taking antidepressant medication were obese.
- Among adults who took antidepressant medication, of those with moderate or severe depressive symptoms, 55% were obese while 38% with mild or no depressive symptoms were obese (Figure 5).
- Among adults not taking antidepressant medication, 39% of adults with moderate or severe depressive symptoms were obese compared with 33% of adults with mild or no depressive symptoms.
- Adults who took antidepressant medication were more likely to be obese than those not taking antidepressants both among adults with moderate to severe depressive symptoms and adults with mild or no depressive symptoms.
Figure 5. Age-adjusted percentage of adults aged 20 and over who were obese, by depressive symptoms and use of antidepressants: United States, 2005–2010
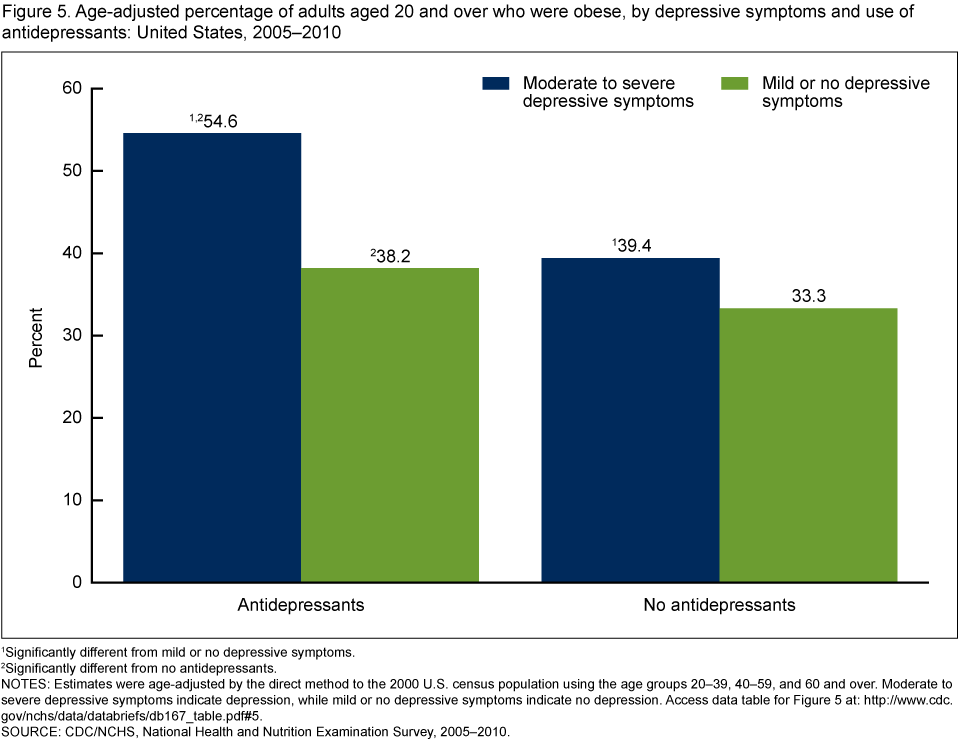
1Significantly different from mild or no depressive symptoms.
2Significantly different from no antidepressants.
NOTES: Estimates were age-adjusted by the direct method to the 2000 U.S. census population using the age groups 20–39, 40–59, and 60 and over. Moderate to severe depressive symptoms indicate depression, while mild or no depressive symptoms indicate no depression. Access data table for Figure 5.
SOURCE: CDC/NCHS, National Health and Nutrition Examination Survey, 2005–2010.
Summary
Forty-three percent of adults with depression were obese as compared with 33% of adults without depression. Women with depression were more likely to be obese than women without depression. The relationship was consistent across all age groups among women and was also seen in men aged 60 and over. Non-Hispanic white women with depression were more likely to be obese than non-Hispanic white women without depression. This relationship was not seen in non-Hispanic black or Hispanic women or among men of any racial or ethnic background. As the severity of depression increased, the percentage of all adults and of women with obesity increased as well.
Both moderate to severe depressive symptoms and antidepressant use were associated with increased obesity. Moderate to severe depressive symptoms were associated with a higher rate of obesity both in persons who were taking antidepressant medication and those who were not, and antidepressant use was associated with a higher rate of obesity in persons with moderate to severe depressive symptoms and those with mild or no depressive symptoms. Of the four categories, the highest prevalence of obesity (54.6%) was found in persons who had moderate or severe depressive symptoms and took antidepressant medication.
In this study, it is not clear whether depression or obesity occurred first because they were both measured at the same time. Other studies have shown a bidirectional relationship, meaning obesity increases risk of depression and depression increases risk of obesity (10). Knowledge of these risks may help general medical practitioners and mental health professionals plan prevention and treatment.
Definitions
Obesity: Body mass index (BMI) is calculated as weight in kilograms divided by height in meters squared. Obesity in adults is defined as BMI greater than or equal to 30.
Depression: Measured using the Patient Health Questionnaire (PHQ–9), a 9-item instrument that asks questions about the frequency of symptoms of depression over the past 2 weeks (11). In the PHQ–9, response categories “not at all,” “several days,” “more than half the days,” and “nearly every day” are given a score ranging from 0 (not at all) to 3 (nearly every day). A total score is calculated ranging from 0 to 27. Depression was defined as a PHQ–9 score of 10 or higher, a cut point that has been well validated and is commonly used in clinical studies that measure depression (11). No depression was defined as a PHQ–9 score of 0–9.
PHQ–9 is based on the diagnostic criteria for major depressive disorder in the Diagnostic and Statistical Manual of Mental Disorders, Fourth Edition. Major depression includes mood symptoms such as feelings of sadness or irritability; loss of interest in usual activities; inability to experience pleasure; feelings of guilt or worthlessness; and thoughts of death or suicide; cognitive symptoms such as inability to concentrate and difficulty making decisions; and physical symptoms such as fatigue, lack of energy, feeling restless or slowed down, and changes in sleep, appetite, and activity levels (12).
Depression severity: Refers to the severity of depressive symptoms. The following four severity categories were defined based on the total score from the PHQ–9 (13): None or minimal (0–4), Mild (5–9), Moderate (10–14), and Severe (15 or more).
These depression severity categories are used in Figures 4 and 5. In Figures 1–3, none or minimal and mild depressive symptoms (PHQ–9 scores of 0–9) correspond to “no depression,” while moderate and severe depressive symptoms (scores of 10 or more) correspond to “depression.” Persons who have been diagnosed with depression, but who are not experiencing moderate or severe symptoms due to medication use or other factors, are not defined as having depression in this analysis.
Antidepressant medication: Prescription drugs were classified based on the three-level nested therapeutic classification scheme of Cerner Multum’s Lexicon (13). Antidepressants were identified using the second level of drug categorical codes, specifically code 249.
Data sources and methods
NHANES is a continuous survey conducted to assess the health and nutrition of the American people. The survey is designed to be nationally representative of the U.S. civilian noninstitutionalized population. Survey participants complete a household interview and visit a mobile examination center (MEC) for a physical examination and private interview.
During the household interview, survey participants were asked if they had taken a prescription drug in the past month. Those who answered “yes” were asked to show the interviewer the medication containers of all prescription drugs. Height and weight, used to calculate BMI, were measured during the MEC physical examination. The questions on depression were asked in the private interview in the MEC.
NHANES sample examination weights, which account for the differential probabilities of selection, nonresponse, and noncoverage, were used for all analyses. Standard errors of the percentages were estimated using Taylor series linearization, a method that incorporates the sample design and weights.
Prevalence estimates for the total adult population were age-adjusted using the direct method to the 2000 U.S. census population using the age groups 20–39, 40–59, and 60 and over. Differences between groups were tested using a univariate t statistic at the p < 0.05 significance level. All differences reported are statistically significant unless otherwise indicated. No adjustments were made for multiple comparisons. A test for trends was done to evaluate changes in the estimates by depression severity (Figure 3). Statistical analyses were conducted using the SAS system for Windows, release 9.3 (SAS Institute Inc., Cary, N.C.) and SUDAAN, release 10.0 (RTI International, Research Triangle Park, N.C.).
About the authors
Laura A. Pratt is with CDC’s National Center for Health Statistics, Office of Analysis and Epidemiology. Debra J. Brody is with CDC’s National Center for Health Statistics, Division of Health and Nutrition Examination Surveys.
References
- CDC. National Health and Nutrition Examination Survey data. Hyattsville, MD: National Center for Health Statistics. 2005–2010.
- McElroy SL, Kotwal R, Malhotra S, Nelson EB, Keck PE, Nemeroff CB. Are mood disorders and obesity related? A review for the mental health professional. J Clin Psychiatry 65(5):634–51. 2004.
- Ferraro KF, Su Y, Gretebeck RJ, Black DR, Badylak SF. Body mass index and disability in adulthood: A 20-year panel study. Am J Public Health 92(5):834–40. 2002.
-
Katon W, Ciechanowski P. Impact of major depression on chronic medical illness.
J Psychosom Res 53(4):859–63. 2002. - Zhao G, Ford ES, Dhingra S, Li C, Strine TW, Mokdad AH. Depression and anxiety among US adults: Associations with body mass index. Intl J Obesity 33(2):257–66. 2009.
- Onyike CU, Crum RM, Lee HB, Lyketsos DG, Eaton WW. Is obesity associated with major depression? Results from the Third National Health and Nutrition Examination Survey. Am J Epidemiol 158(12):1139–47. 2003.
- Carpenter KM, Hasin DS, Allison DB, Faith MS. Relationships between obesity and DSM-IV major depressive disorder, suicide ideation, and suicide attempts: Results from a general population study. Am J Public Health 90(2):251–7. 2000.
- Pratt LA, Brody DJ, Gu Q. Antidepressant use in persons aged 12 and over: United States, 2005–2008. NCHS data brief, no 76. Hyattsville, MD: National Center for Health Statistics. 2011.
- Aronne LJ, Segal KR. Weight gain in the treatment of mood disorders. J Clin Psychiatry 64(Suppl 8):22–9. 2003.
- Luppino FS, de Wit LM, Bouvy PF, Stijnen T, Cuijpers P, Penninx BW, Zitman FG. Overweight, obesity, and depression: A systematic review and meta-analysis of longitudinal studies. Arch Gen Psychiatry 67(3):220–9. 2010.
- Kroenke K, Spitzer RL, Williams JB. The PHQ-9: Validity of a brief depression severity measure. J Gen Intern Med 16(9):606-13. 2001.
- American Psychiatric Association. Diagnostic and Statistical Manual of Mental Disorders. Fourth Edition. Washington, DC: American Psychiatric Association. 2000.
- Multum Lexicon database. In: National Health and Nutrition Examination Survey: 1988–2010 data documentation, codebook, and frequencies. 2012.
Suggested citation
Pratt LA, Brody DJ. Depression and obesity in the U.S. adult household population, 2005–2010. NCHS data brief, no 167. Hyattsville, MD: National Center for Health Statistics. 2014.
Copyright information
All material appearing in this report is in the public domain and may be reproduced or copied without permission; citation as to source, however, is appreciated.
National Center for Health Statistics
Charles J. Rothwell, M.S., M.B.A., Director
Jennifer H. Madans, Ph.D., Associate Director for Science
Office of Analysis and Epidemiology
Irma E. Arispe, Ph.D., Director
Division of Health and Nutrition Examination Surveys
Kathryn S. Porter, M.D., M.S., Director