Health Care Expenditures
National health expenditures represent the amount spent on health care and related activities such as private and public health insurance, health research, and public health activities (1). Personal health care expenditures—which account for the largest shares of total national health expenditures— are outlays for goods and services relating directly to patient care, such as hospital care, physicians’ and dentists’ services, prescription drugs, eyeglasses, and nursing home care.
Key Findings
National health expenditures

In 2019, current (nominal dollars) spending for national health expenditures was $3,795 billion. Total national health expenditures (constant dollars) were 30% higher in 2019 ($3,453 billion) than in 2009 ($2,658 billion). Examining constant dollars removes the effect of inflation on spending.
SOURCE: Centers for Medicare & Medicaid Services, National Health Expenditure Accounts. See Sources and Definitions, Inflation-adjusted expenditures; National Health Expenditure Accounts (NHEA) and Health, United States, 2020–2021 Table HExpGDP.
Personal health care expenditures

Personal health care expenditures account for about 85% of national health expenditures (2). In 2019, current (nominal dollars) spending for personal health care was $3,207 billion. Personal health care expenditures (constant dollars) were 31% higher in 2019 ($2,937 billion) than in 2009 ($2,249 billion). Examining constant dollars removes the effect of inflation on spending. See Featured Charts for additional analysis.
SOURCE: Centers for Medicare & Medicaid Services, National Health Expenditure Accounts. See Sources and Definitions, Inflation-adjusted expenditures; National Health Expenditure Accounts (NHEA) and Health, United States, 2020–2021 Table HExpPers.
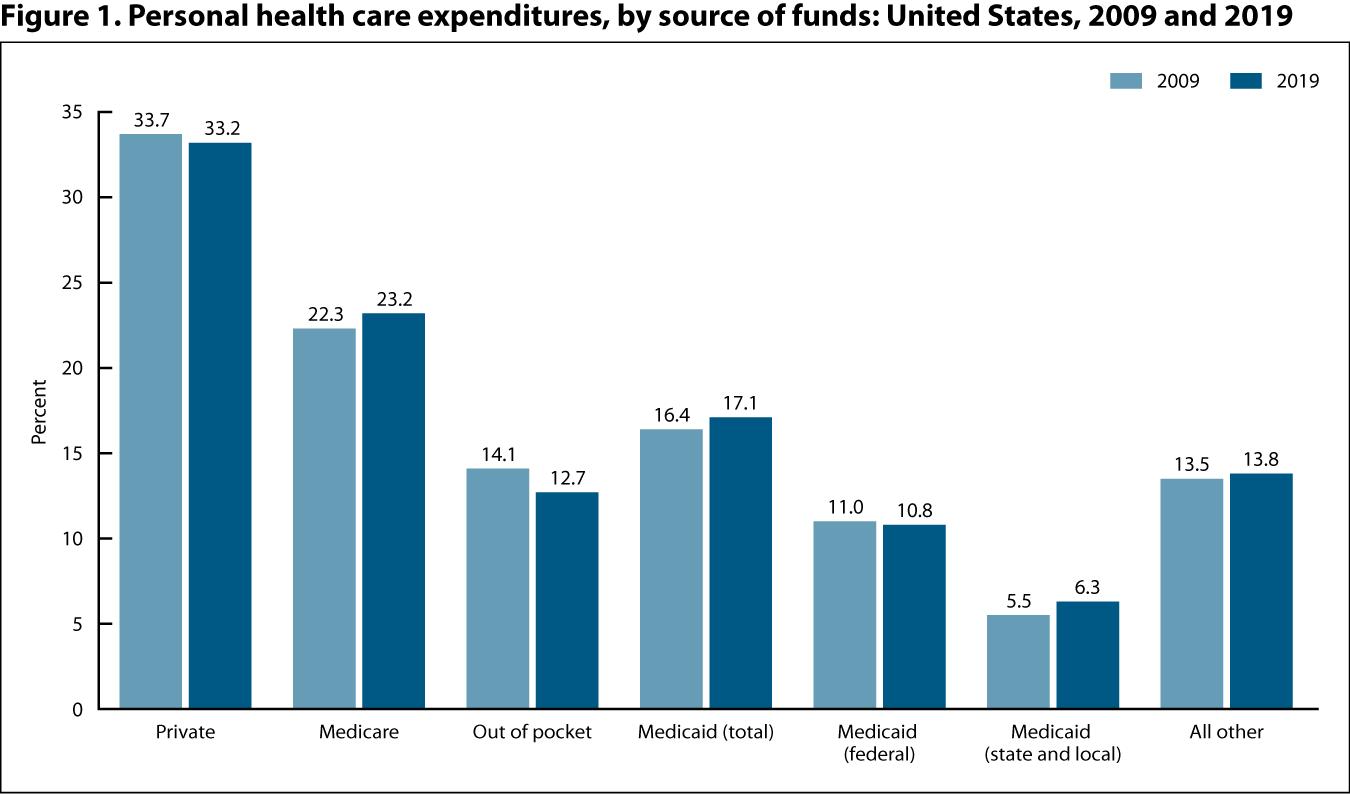
Private health insurance was the largest source of funding for personal health care expenditures.

SOURCE: Centers for Medicare & Medicaid Services, National Health Expenditures Accounts. See Sources and Definitions, National Health Expenditure Accounts (NHEA) and Health, United States, 2020–2021 Table HExpPers.
- The percentage of personal health care expenditures from out-of-pocket spending was lower in 2019 (12.7%) than in 2009 (14.1%), while the percentages from Medicare and Medicaid (total) were higher in 2019 (23.2% and 17.1%, respectively) than in 2009 (22.3% and 16.4%, respectively).
- The percentage of personal health care expenditures from federal Medicaid spending was similar in 2009 and 2019, while state and local Medicaid spending was higher in 2019 (6.3%) than in 2009 (5.5%).
- In 2019, private health insurance was the largest source of personal health care expenditures—accounting for about one-third of personal health care spending—followed by Medicare, Medicaid (total), all other payers, and out-of-pocket spending.
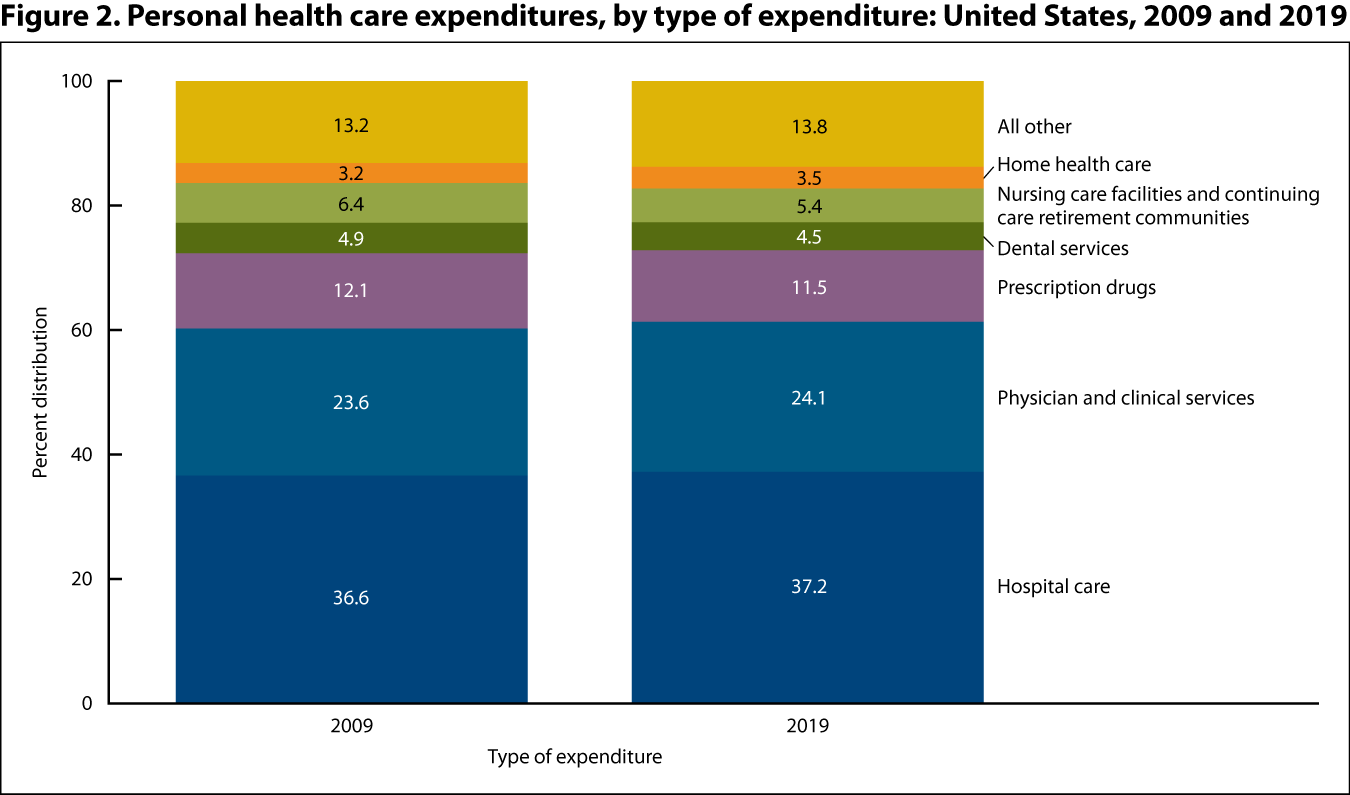
Spending for hospital care represented the largest share of personal health care expenditures.

SOURCE: Centers for Medicare & Medicaid Services, National Health Expenditures Accounts. See Sources and Definitions, National Health Expenditure Accounts (NHEA) and Health, United States, 2020–2021 Table HExpType.
- The percentages of personal health care expenditures for prescription drugs, nursing care facilities and continuing care retirement communities, and dental services were lower in 2019 than 2009, while the percentage share for hospital care, physician and clinical services, and home health care was higher in 2019 than in 2009.
- In 2019, hospital care spending (37.2%) made up the largest share of personal health care expenditures, followed by spending on physician and clinical services (24.1%), prescription drugs (11.5%), nursing care facilities and continuing care retirement communities (5.4%), dental services (4.5%), and home health care (3.5%). All other types of expenditures, such as other health, residential, and personal care; durable medical equipment; and other nondurable medical products, accounted for the remaining 13.8% of personal health care spending.
Download the data
Gross domestic product, national health expenditures, per capita amounts, percent distribution, and average annual percent change: United States, selected years 1960–2019
SOURCE: Centers for Medicare & Medicaid Services, National Health Expenditure Accounts.
National health expenditures, average annual percent change, and percent distribution, by type of expenditure: United States, selected years 1960–2019
SOURCE: Centers for Medicare & Medicaid Services, National Health Expenditure Accounts.
- Inflation-adjusted expenditures: To accurately compare expenditures over time while accounting for inflation, current (nominal) dollar values are adjusted to constant (real) dollars using a deflator. The resulting measure of “real” spending reflects growth in nonprice factors, such as technological developments, changes in the age and sex composition of the population, and any changes in the intensity and quantity of health care services delivered per person. See Sources and Definitions, Inflation-adjusted expenditures.
- National health expenditures: Estimates from the Centers for Medicare & Medicaid Services that measure calendar year spending for health care in the United States by type of service delivered (for example, hospital care, physician services, or nursing home care) and source of funding for those services (for example, private health insurance, Medicare, Medicaid, or out-of-pocket spending). See Sources and Definitions, Health expenditures, national.
- Personal health care expenditures: Outlays for goods and services relating directly to patient care. These expenditures are total national health expenditures minus expenditures for investment, health insurance program administration and the net cost of insurance, and public health activities. See Sources and Definitions, Health expenditures, personal.
- Centers for Medicare & Medicaid Services. National health expenditures accounts: Methodology paper, 2020. Available from: https://www.cms.gov/files/document/definitions-sources-and-methods.pdf.
- Martin AB, Hartman M, Lassman D, Catlin A. National health care spending in 2019: Steady growth for the fourth consecutive year. Health Aff 40(1):14–24. 2021.

