Suicide Rates for Females and Males by Race and Ethnicity: United States, 1999 and 2017
by Sally C. Curtin, M.A., Division of Vital Statistics, and Holly Hedegaard, M.D., M.S.P.H., Division of Analysis and Epidemiology
The age-adjusted suicide rate in the United States in 2017 (14.0 per 100,000 standard population) was 33% higher than the rate in 1999 (10.5) (1). This NCHS Health E-Stat provides supplemental information on suicide rates by sex, age, and race and ethnicity.
For females, age-adjusted suicide rates increased significantly between 1999 and 2017 for all race and ethnicity groups except non-Hispanic Asian or Pacific Islander (API). The largest increase occurred for non-Hispanic American Indian or Alaska Native (AIAN) females (139%, from 4.6 to 11.0) (Figure 1, Table). In 2017, for the three age groups for which reliable rates could be computed for all race and ethnicity groups (15–24, 25–44, and 45–64), rates for females aged 15–24 and 25–44 were highest for non-Hispanic AIAN females (20.5 and 20.7, respectively). For females aged 45–64, the rate was highest for non-Hispanic white females (12.8).
For males, age-adjusted suicide rates increased significantly between 1999 and 2017 for all race and ethnicity groups except non-Hispanic API, with the largest increase observed among non-Hispanic AIAN males (71%, from 19.8 to 33.8) (Figure 2, Table). In 2017, for the three age groups for which reliable rates could be calculated for all race and ethnicity groups, rates for males aged 15–24 and 25–44 were highest for non-Hispanic AIAN males (53.7 and 58.1, respectively). For males aged 45–64, the rate was highest for non-Hispanic white males (38.2).
Studies have shown that deaths for all causes for non-Hispanic AIAN, non-Hispanic API, and Hispanic persons are sometimes misclassified to other race and ethnicity groups, resulting in an underestimation of deaths by about 33%, 3%, and 3%, respectively (2). The specific extent and direction of misclassification of suicide deaths is unknown; however, the number of suicide deaths for these race and ethnicity groups may also be underestimated. Nevertheless, non-Hispanic AIAN persons had the highest suicide rates for both females and males aged 15–24 and 25–44 in 2017.
Data source and methods
Data are from the National Vital Statistics System Multiple Cause of Death files for 1999 and 2017 (3). Suicides were classified using the International Statistical Classification of Diseases, 10th Revision (ICD–10) underlying cause of death codes U03, X60–X84, and Y87.0 (4).
Age-adjusted death rates were calculated using the direct method and the 2000 U.S. standard population (4). Age-specific death rates were computed for the groups in which the number of suicides was 20 or more, below which the rates are not considered statistically reliable. Population data for 1999 and 2017 are July 1 bridged-race estimates from the Vintage 2017 intercensal and postcensal series. Statistical significance of differences in rates was assessed using a z test. All differences mentioned were significant at the 0.05 level.
References
- Hedegaard H, Curtin SC, Warner M. Suicide mortality in the United States, 1999–2017. Data Brief, no 330. Hyattsville, MD: National Center for Health Statistics. 2018.
- Arias E, Heron M, Hakes JK. The validity of race and Hispanic-origin reporting on death certificates in the United States: An update. National Center for Health Statistics. Vital Health Stat 2(172). 2016.
- National Center for Health Statistics. CDC WONDER: About underlying cause of death,1999–2017. 2019.
- World Health Organization. International statistical classification of diseases and related health problems, 10th revision (ICD–10). 2008 ed. Geneva, Switzerland. 2009.
Acknowledgments
The authors would like to thank Melonie Heron of the Division of Vital Statistics, Mortality Statistics Branch, for providing content review. This report was edited and produced by NCHS Office of Information Services, Information Design and Publishing Staff: Jane Sudol edited the report, and typesetting and graphics were produced by Michael W. Jones (contractor).
Suggested citation
Curtin SC, Hedegaard H. Suicide rates for females and males by race and ethnicity: United States, 1999 and 2017. NCHS Health E-Stat. 2019.
Figures
Figure 1. Age-adjusted suicide rates for females, by race and ethnicity: United States, 1999 and 2017
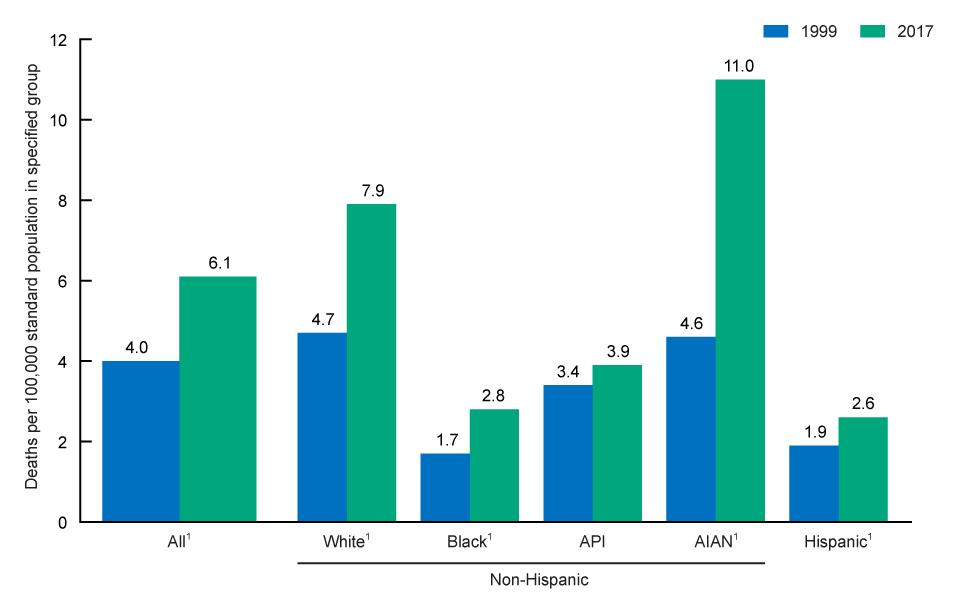
1Significant difference in rates between 1999 and 2017 (p < 0.05).
NOTES: Suicides are identified with International Classification of Diseases, 10th Revision (ICD–10) codes U03, X60–X84, and Y87.0. Death rates for non-Hispanic Asian or Pacific Islander (API), non-Hispanic American Indian or Alaska Native (AIAN), and Hispanic persons may be underestimated and should be interpreted with caution. See Data source and methods.
SOURCE: NCHS, National Vital Statistics System, Mortality.
Figure 2. Age-adjusted suicide rates for males, by race and ethnicity: United States, 1999 and 2017
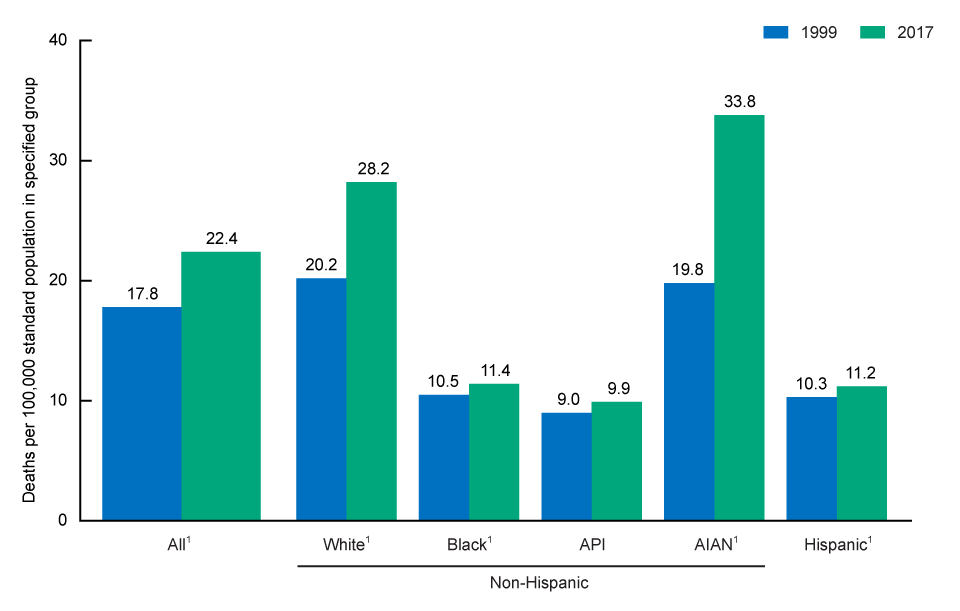
1Significant difference in rates between 1999 and 2017 (p < 0.05).
NOTES: Suicides are identified with International Classification of Diseases, 10th Revision (ICD–10) codes U03, X60–X84, and Y87.0. Death rates for non-Hispanic Asian or Pacific Islander (API), non-Hispanic American Indian or Alaska Native (AIAN), and Hispanic persons may be underestimated and should be interpreted with caution. See Data source and methods.
SOURCE: NCHS, National Vital Statistics System, Mortality.
Table
Number of deaths, age-adjusted death rates, and age-specific death rates for suicide, by sex and race and ethnicity: United States, 1999 and 2017
[Rates per 100,000 population; populations used for computing death rates were estimated as of July 1]
| Race, ethnicity, and age group (years) |
Female | Male | ||||||||
|---|---|---|---|---|---|---|---|---|---|---|
| 1999 | 2017 | Percent change in rate, 1999 and 2017 | 1999 | 2017 | Percent change in rate, 1999 and 2017 | |||||
| Number | Rate | Number | Rate | Number | Rate | Number | Rate | |||
| All ages2 | 5,741 | 4.0 | 10,391 | 6.1 | †53 | 23,458 | 17.8 | 36,782 | 22.4 | †26 |
| 10–14 | 50 | 0.5 | 169 | 1.7 | †240 | 192 | 1.9 | 348 | 3.3 | †74 |
| 15–24 | 575 | 3.0 | 1,225 | 5.8 | †93 | 3,326 | 16.8 | 5,027 | 22.7 | †35 |
| 25–44 | 2,359 | 5.5 | 3,339 | 7.8 | †42 | 9,213 | 21.6 | 11,944 | 27.5 | †27 |
| 45–64 | 1,868 | 6.0 | 4,172 | 9.7 | †62 | 6,109 | 20.8 | 12,371 | 30.1 | †45 |
| 65–74 | 420 | 4.1 | 982 | 6.2 | †51 | 2,051 | 24.7 | 3,638 | 26.2 | †6 |
| 75 and over | 469 | 4.5 | 501 | 4.0 | †–11 | 2,549 | 42.4 | 3,447 | 39.7 | †–6 |
| Not stated | – | * | 2 | * | * | 16 | * | 3 | * | * |
| All ages2 | 4,914 | 4.7 | 8,398 | 7.9 | †68 | 19,620 | 20.2 | 29,708 | 28.2 | †40 |
| 10–14 | 33 | 0.5 | 101 | 1.9 | †280 | 140 | 2.1 | 226 | 4.0 | †90 |
| 15–24 | 414 | 3.4 | 746 | 6.4 | †88 | 2,416 | 19.2 | 3,328 | 27.2 | †42 |
| 25–44 | 1,981 | 6.8 | 2,538 | 10.4 | †53 | 7,415 | 25.2 | 8,912 | 35.9 | †42 |
| 45–64 | 1,678 | 7.0 | 3,689 | 12.8 | †83 | 5,389 | 23.4 | 10,734 | 38.2 | †63 |
| 65–74 | 380 | 4.6 | 880 | 7.4 | †61 | 1,869 | 27.0 | 3,297 | 30.7 | †14 |
| 75 and over | 428 | 4.8 | 443 | 4.5 | –6 | 2,384 | 45.7 | 3,209 | 46.2 | 1 |
| Not stated | – | * | 1 | * | * | 6 | * | 1 | * | * |
| All ages2 | 294 | 1.7 | 616 | 2.8 | †65 | 1,630 | 10.5 | 2,324 | 11.4 | †9 |
| 10–14 | 7 | * | 19 | * | * | 22 | 1.4 | 44 | 2.8 | †100 |
| 15–24 | 55 | 2.0 | 145 | 4.5 | †125 | 408 | 14.8 | 565 | 16.8 | †14 |
| 25–44 | 142 | 2.5 | 265 | 4.3 | †72 | 785 | 15.5 | 1,043 | 18.2 | †17 |
| 45–64 | 64 | 1.9 | 150 | 2.7 | †42 | 278 | 9.8 | 504 | 10.6 | 8 |
| 65–74 | 16 | * | 24 | 1.5 | * | 78 | 11.7 | 108 | 8.7 | –26 |
| 75 and over | 10 | * | 12 | * | * | 57 | 14.1 | 58 | 9.1 | †–35 |
| Not stated | – | * | – | * | * | 2 | * | – | * | * |
or Pacific Islander3,4 |
||||||||||
| All ages2 | 188 | 3.4 | 424 | 3.9 | 15 | 457 | 9.0 | 990 | 9.9 | 10 |
| 10–14 | 1 | * | 11 | * | * | 6 | * | 11 | * | * |
| 15–24 | 35 | 4.1 | 87 | 6.6 | †61 | 82 | 9.5 | 228 | 16.9 | †78 |
| 25–44 | 76 | 3.8 | 145 | 4.2 | 11 | 203 | 10.8 | 366 | 11.5 | 6 |
| 45–64 | 46 | 3.9 | 110 | 4.2 | 8 | 118 | 11.5 | 254 | 11.2 | –3 |
| 65–74 | 14 | * | 41 | 5.1 | * | 22 | 10.1 | 75 | 11.7 | 16 |
| 75 and over | 16 | * | 30 | 5.4 | * | 25 | 19.4 | 56 | 14.2 | –27 |
| Not stated | – | * | – | * | * | 1 | * | – | * | * |
| All ages2 | 54 | 4.6 | 154 | 11.0 | †139 | 222 | 19.8 | 448 | 33.8 | †71 |
| 10–14 | – | * | 7 | * | * | 2 | * | 5 | * | * |
| 15–24 | 13 | * | 43 | 20.5 | * | 77 | 39.1 | 116 | 53.7 | †37 |
| 25–44 | 29 | 8.2 | 77 | 20.7 | †152 | 102 | 30.0 | 214 | 58.1 | †94 |
| 45–64 | 12 | * | 25 | 7.3 | * | 30 | 14.9 | 92 | 29.5 | †98 |
| 65–74 | – | * | 2 | * | * | 9 | * | 13 | * | * |
| 75 and over | – | * | – | * | * | 2 | * | 8 | * | * |
| Not stated | – | * | – | * | * | – | * | – | * | * |
| All ages2 | 265 | 1.9 | 758 | 2.6 | †37 | 1,430 | 10.3 | 3,175 | 11.2 | †9 |
| 10–14 | 9 | * | 30 | 1.2 | * | 21 | 1.4 | 60 | 2.3 | †64 |
| 15–24 | 53 | 1.8 | 200 | 4.2 | †133 | 338 | 9.9 | 780 | 15.6 | †58 |
| 25–44 | 121 | 2.3 | 303 | 3.5 | †52 | 671 | 11.3 | 1,365 | 14.8 | †31 |
| 45–64 | 59 | 2.5 | 184 | 3.2 | 28 | 263 | 11.8 | 726 | 12.6 | 7 |
| 65–74 | 10 | * | 27 | 1.9 | * | 63 | 13.8 | 133 | 11.5 | –17 |
| 75 and over | 13 | * | 14 | * | * | 72 | 30.2 | 109 | 16.4 | †–46 |
| Not stated | – | * | – | * | * | 2 | * | 1 | * | * |
† Difference in rates between 1999 and 2017 was significant at p < 0.05.
– Quantity zero.
* Rate or percent change in rate does not meet standards of reliability; based on fewer than 20 cases in the numerator.
1Includes Hispanic origin not stated.
2Age adjusted using the direct method and the 2000 standard U.S. population. Figures for age not stated are included in “All ages” but not distributed among age groups.
3Race categories are consistent with the 1977 Office of Management and Budget (OMB) standards. In 2017, multiple race data were reported by 49 states and the District of Columbia. The multiple-race data for these reporting areas were bridged to the single-race categories of the 1977 OMB standards for comparability with other reporting areas.
4Includes Aleut and Eskimo persons.
5Includes Chinese, Filipino, Hawaiian, Japanese, and other Asian or Pacific Islander persons.
6Persons of Hispanic origin may be of any race.
SOURCE: NCHS, National Vital Statistics System, Mortality, 1999 and 2017.