|
TABLE. Number,* rate,† and median days absent from work for employer-reported nonfatal occupational injuries and illnesses resulting in lost workdays, by age group and selected characteristics --- United States, 2009 |
|||||||||||||||
|---|---|---|---|---|---|---|---|---|---|---|---|---|---|---|---|
|
Characteristic |
Persons aged 55--64 yrs |
Persons aged ≥65 yrs |
Total (all ages) |
||||||||||||
|
No. |
Rate |
(95% CI§) |
(%¶) |
Median days absent |
No. |
Rate |
(95% CI) |
(%) |
Median days absent |
No. |
Rate |
(95% CI) |
(%) |
Median days absent |
|
|
Total** |
176,280 |
116.8 |
(±1.8) |
(100.0) |
11 |
34,540 |
105.9 |
(±2.7) |
(100.0) |
12 |
1,238,490 |
117.2 |
(±1.6) |
(100.0) |
8 |
|
Sex |
|||||||||||||||
|
Male |
96,900 |
---†† |
--- |
(55.0) |
14 |
19,280 |
--- |
--- |
(55.8) |
13 |
754,910 |
129.3 |
(±1.8) |
(61.0) |
9 |
|
Female |
78,640 |
--- |
--- |
(44.6) |
8 |
15,230 |
--- |
--- |
(44.1) |
11 |
477,620 |
102.2 |
(±1.6) |
(38.6) |
7 |
|
Nature of injury§§ |
|||||||||||||||
|
Sprains, strains, tears |
66,590 |
44.1 |
(±1.0) |
(37.8) |
14 |
10,190 |
31.3 |
(±1.3) |
(29.5) |
13 |
493,170 |
46.7 |
(±0.6) |
(39.8) |
10 |
|
Soreness, pain |
19,370 |
12.8 |
(±0.4) |
(11.0) |
8 |
4,050 |
12.4 |
(±0.8) |
(11.7) |
10 |
137,660 |
13.0 |
(±0.2) |
(11.1) |
8 |
|
Fractures |
18,810 |
12.5 |
(±0.4) |
(10.7) |
32 |
5,270 |
16.2 |
(±0.9) |
(15.3) |
42 |
90,160 |
8.5 |
(±0.2) |
(7.3) |
30 |
|
Bruises, contusions |
17,700 |
11.7 |
(±0.4) |
(10.0) |
5 |
3,860 |
11.8 |
(±0.8) |
(11.2) |
5 |
113,280 |
10.7 |
(±0.2) |
(9.1) |
4 |
|
Cuts, lacerations, punctures |
9,720 |
6.4 |
(±0.3) |
(5.5) |
5 |
2,370 |
7.3 |
(±0.6) |
(6.9) |
4 |
97,460 |
9.2 |
(±0.2) |
(7.9) |
4 |
|
Multiple injuries |
9,680 |
6.4 |
(±0.3) |
(5.5) |
10 |
2,690 |
8.2 |
(±0.6) |
(7.8) |
13 |
52,550 |
5.0 |
(±0.1) |
(4.2) |
8 |
|
Part of body affected§§ |
|||||||||||||||
|
Trunk (total) |
55,390 |
36.7 |
(±0.8) |
(31.4) |
17 |
11,310 |
34.7 |
(±1.4) |
(32.7) |
18 |
406,370 |
38.5 |
(±0.6) |
(32.8) |
10 |
|
Back |
27,160 |
18.0 |
(±0.5) |
(15.4) |
11 |
4,860 |
14.9 |
(±0.9) |
(14.1) |
7 |
242,380 |
22.9 |
(±0.4) |
(19.6) |
7 |
|
Pelvic region |
3,900 |
2.6 |
(±0.2) |
(2.2) |
20 |
1,460 |
4.5 |
(±0.5) |
(4.2) |
59 |
19,550 |
1.9 |
(±0.1) |
(1.6) |
10 |
|
Hip(s) |
2,390 |
1.6 |
(±0.1) |
(1.4) |
35 |
1,090 |
3.3 |
(±0.4) |
(3.2) |
67 |
9,780 |
0.9 |
(±0.0) |
(0.8) |
15 |
|
Lower extremities |
43,300 |
28.7 |
(±0.7) |
(24.6) |
13 |
7,910 |
24.3 |
(±1.1) |
(22.9) |
15 |
281,820 |
26.7 |
(±0.4) |
(22.8) |
10 |
|
Upper extremities |
33,470 |
22.2 |
(±0.6) |
(19.0) |
10 |
5,900 |
18.1 |
(±1.0) |
(17.1) |
10 |
265,980 |
25.2 |
(±0.4) |
(21.5) |
7 |
|
Multiple parts |
28,040 |
18.6 |
(±0.5) |
(15.9) |
8 |
6,070 |
18.6 |
(±1.0) |
(17.6) |
8 |
153,890 |
14.6 |
(±0.3) |
(12.4) |
9 |
|
Head |
10,240 |
6.8 |
(±0.3) |
(5.8) |
3 |
2,190 |
6.7 |
(±0.6) |
(6.3) |
4 |
81,000 |
7.7 |
(±0.2) |
(6.5) |
3 |
|
Event§§ |
|||||||||||||||
|
Fall on same level |
41,470 |
27.5 |
(±0.6) |
(23.5) |
11 |
12,780 |
39.2 |
(±1.5) |
(37.0) |
13 |
186,630 |
17.7 |
(±0.3) |
(15.1) |
9 |
|
Overexertion |
34,840 |
23.1 |
(±0.6) |
(19.8) |
15 |
4,550 |
13.9 |
(±0.8) |
(13.2) |
16 |
277,560 |
26.3 |
(±0.4) |
(22.4) |
10 |
|
Contact with objects equipment |
33,140 |
21.9 |
(±0.6) |
(18.8) |
6 |
6,320 |
19.4 |
(±1.0) |
(18.3) |
7 |
299,030 |
28.3 |
(±0.4) |
(24.1) |
5 |
|
Fall to lower level |
15,700 |
10.4 |
(±0.4) |
(8.9) |
16 |
2,490 |
7.6 |
(±0.6) |
(7.2) |
16 |
79,050 |
7.5 |
(±0.1) |
(6.4) |
13 |
|
* The number of nonfatal occupational injuries and illnesses resulting in lost workdays reported by employers to the U.S. Department of Labor, Bureau of Labor Statistics (BLS) Survey of Occupational Injuries and Illnesses (SOII). Farms with fewer than 11 employees, private household workers, the self-employed, and federal employees are excluded. Additional information available at http://www.bls.gov/opub/hom/homch9.htm. † Per 10,000 full-time equivalent (FTE) workers; one FTE = 2,000 hours worked per year. FTE are derived from employment data collected in the SOII augmented by data collected in the Current Population Survey and the BLS Occupational Employment Statistics Program. Additional information is available at http://www.bls.gov/opub/hom/homch9.htm § Confidence interval for rate. ¶ Percentages might not add to 100 because of rounding or because of reporting on only selected values based on highest frequency (i.e., nature of injury or illness, part of body affected, and event or exposure). ** The sum of the number of injuries for persons aged 55--64 years and ≥65 years (210,820) does not equal the total of 210,830 that is reported in the report because of rounding of the sample-based estimates. †† Data do not meet BLS standards for publication. §§ Classified according to the BLS Occupational Injury and Illness Classification System. Additional information available at http://www.bls.gov/iif/oshoiics.htm. |
|||||||||||||||
Persons using assistive technology might not be able to fully access information in this file. For assistance, please send e-mail to: mmwrq@cdc.gov. Type 508 Accommodation and the title of the report in the subject line of e-mail.
Nonfatal Occupational Injuries and Illnesses Among Older Workers --- United States, 2009
Older workers (defined as those aged ≥55 years) represented 19% of the U.S. workforce in 2009* and are the nation's fastest growing segment of the working population (1). To identify occupational safety issues affecting older workers, an analysis of data from the Bureau of Labor Statistics (BLS) Survey of Occupational Injuries and Illnesses (SOII) was conducted by CDC, BLS, and several state partners. This report summarizes the results of that analysis, which indicated that, based on employer reports, an estimated 210,830 nonfatal occupational injuries and illnesses among older workers in 2009 resulted in lost workdays. Although older workers had similar or lower rates for all injuries and illnesses combined compared with younger workers, the length of absence from work increased steadily with age and was highest for older workers (medians of 11 and 12 days for workers aged 55--64 years and ≥65 years, respectively). Older workers had higher rates of falls on the same level, fractures, and hip injuries compared with younger workers and workers of all ages. Public health and research agencies should conduct research to better understand the overall burden of occupational injuries and illnesses on older workers, aging-associated risks, and effective prevention strategies. Employers and others should take steps to address specific risks for older workers such as falls (e.g., by ensuring floor surfaces are clean, dry, well-lit, and free from tripping hazards).
SOII is a collaborative federal/state survey program administered by BLS based on reports from approximately 240,000 employers (220,000 private sector employers and 20,000 state and local government employers)† (2). The sampling frame is representative at the national level and at the state level for most states.§ Employers report injuries and illnesses that meet recordkeeping requirements of the Occupational Safety and Health Administration (OSHA).¶ BLS estimates the incidence of work-related injuries and illnesses based on these data. For those injuries and illnesses resulting in lost workdays, employers provide information on worker characteristics, including age and sex, and data about the nature and circumstances of injuries and illnesses, including an "event" variable that describes the manner in which the injury or illness occurred.** Rates of nonfatal occupational injuries and illnesses resulting in at least 1 day away from work were calculated using hours of work data collected in SOII, augmented by data collected in the Current Population Survey (CPS) and the BLS Occupational Employment Statistics program.†† Rates were calculated per 10,000 full-time equivalent (FTE) workers (one FTE = 2,000 hours worked per year); 95% confidence intervals also were calculated (2).
In 2009, an estimated 210,830 nonfatal occupational injuries and illnesses among older workers resulted in lost workdays; 17% of the total 1,238,490 for all workers. The majority (94%) of the cases were classified as acute traumatic injuries, with chronic injuries such as back pain and illnesses such as dermatitis comprising the remainder of the cases. (In this report, cases generically are referred to as injuries.) Males, who represented 52% of workers aged ≥55 years,§§ accounted for 55% of injuries among older workers and had longer absences from work compared with females (medians of 14 and 9 days away from work, respectively).
Workers aged 55--64 years had a rate of nonfatal occupational injuries and illnesses resulting in lost workdays of 116.8 per 10,000 FTE workers, and workers aged ≥65 years had a rate of 105.9 per 10,000 FTE workers. The rate for workers of all ages combined was 117.2 per 10,000 FTE workers. No consistent age-related trend in overall rates by age group was observed (Figure). However, age-related trends were observed for the most frequent events. Rates for falls on the same level (e.g. falling to a floor, a walkway, or the ground or onto/against objects such as a desk, wall, or door) increased steadily with age, rates for contact with objects and equipment (e.g., being struck by or against, or caught in or crushed by various tools, equipment, machinery, parts, or materials) decreased with age, and rates for overexertion were lowest for younger worker (16--19 years and 20--24 years) and older worker (55--64 years and ≥65 years) age groups. Conversely, median number of days absent from work increased steadily with age and was highest among older worker age groups for all injuries and the most frequent events (Figure).
Older worker age groups had lower injury rates than workers of all ages combined for several types of injuries, including sprains, strains, and tears for workers aged ≥65 years, and cuts, lacerations, and punctures for both older worker age groups (Table). In contrast, rates for fractures and multiple injuries were high for both older worker age groups compared with rates for all workers. Fractures accounted for 11% of all injuries among workers aged ≥55 years and were associated with high median numbers of days absent from work (32 days for workers aged 55--64 years and 42 days for workers aged ≥65 years). The most frequently fractured body parts among workers aged ≥55 years were ankles (13% of fractures), wrists (13%), arms (11%), feet (11%), legs (11%), fingers (7%), and hips (7%).
Older worker groups had lower injury rates compared with workers of all ages combined for several parts of the body, including the back and upper extremities (Table). Although hip injuries accounted for only 2% of older worker injuries, the rates were high for both older worker age groups compared with workers of all ages, and median numbers of days absent from work were high (35 days for workers aged 55--64 years and 67 days for workers aged ≥65 years). Forty-nine percent of the hip injuries among workers aged ≥55 years were fractures. Fifty-four percent of the hip injuries among workers aged ≥55 years were the result of falls on the same level; another 16% were from falls to a lower level. Females accounted for 52% of the hip injuries among workers aged ≥55 years. Females with hip injuries were absent from work for a median of 44 days, compared with 59 days for males with hip injuries.
Reported by
Sara E. Wuellner, MPH, Washington State Dept of Labor and Industries. Jaime K. Walters, MPH, Oregon Public Health Div. Thomas St. Louis, MSPH, Connecticut Dept of Public Health. Kathy Leinenkugel, MPA, Iowa Dept of Public Health. Pamela F. Rogers, MPH, Wisconsin Div of Public Health. Daniel Lefkowitz, PhD, New Jersey Dept of Health and Senior Svcs. Letitia K. Davis, ScD, Massachusetts Dept of Public Health. Kitty Gelberg, PhD, New York State Dept of Health. Mark J. Zak, Bur of Labor Statistics, US Dept of Labor. Dawn N. Castillo, MPH, National Institute for Occupational Safety and Health, CDC. Corresponding contributor: Dawn N. Castillo, CDC, 304-285-6012, dcastillo@cdc.gov.
Editorial Note
The population of older workers that forgo retirement because of various factors (e.g., better health, changes in social or retirement policy, lack of younger replacement workers, economic need, or desire to change careers) is growing (3,4). In 2009, U.S. workers aged ≥55 years accounted for 17% of injuries resulting in lost workdays reported in SOII overall and among private sector employers. A 2003 analysis of SOII data that was limited to private sector employment indicated that 12% of injuries were among older workers (3), suggesting that the proportion of older worker injuries has increased during the past 6 years. Researchers and practitioners suggest that accommodating older workers positively impacts the entire workforce (4,5). For example, employer efforts to reduce fall risks for older workers, such as ensuring walkways are well-lit, removing slipping and tripping hazards, and use of more slip-resistant floors, will improve the safety of all workers.
The findings described in this report are consistent with previous studies, which indicate that when older workers are injured, recovery times are longer compared with younger workers, and falls and fractures are common (3,4,6). These findings also suggest substantive impacts on older workers' quality of life and health-care costs. The analysis did not include fatal injuries; previous analyses have found that older workers have the highest fatal injury rates (3,4), and preliminary data for 2009 suggest that workers aged ≥55 years accounted for 31% of all occupational injury deaths that year.¶¶ The findings in this report show that although older workers have higher rates for some types of injuries (e.g., falls on the same level), for other types of injuries (e.g., contact with objects and equipment), they have lower rates compared with other age groups. Additional research is needed to elucidate why older workers have increased rates for some types of injury and not others, and most importantly, to identify the most effective strategies for ensuring the health and well-being of older workers. Increased attention should be paid to the complex safety issues of this growing worker population, which is projected to comprise nearly one quarter of the U.S. workforce by 2018 (1).
Although SOII provides some representative data for occupational injuries and is a good source for addressing injury severity, it is limited to those injuries reported by employers that result in at least 1 day away from work, and it does not include data on long-term disability or costs associated with nonfatal occupational injuries. In an analysis of 2004 nationally representative hospital emergency department data (6), researchers estimated that approximately twice as many older worker injuries had occurred as were estimated by SOII that same year, and the analysis suggested injury rates declined with increasing age.*** The differences in findings from these two data sources might reflect differences in worker populations and the types of injuries captured by each system. Analyzing other sources of occupational injury and illness data, such as data from hospitals and workers' compensation systems, will provide a more accurate and complete picture of older worker injuries and illnesses. Additionally, these data might include estimates of costs that provide another measure of public health burden. In an analysis of carpal tunnel syndrome in Washington based on workers' compensation data, associated costs were greater for older workers compared with younger workers (7).
The findings in this report are subject to at least four limitations. First, SOII data exclude farms with fewer than 11 employees, private household workers, the self-employed, and federal workers (2). The distribution of older workers in these groups is not known, although an analysis of CPS data suggested that 22% of workers aged ≥55 years were self-employed or federal workers in 2009, much higher than the 12% of workers aged <55 years who were self-employed or federal workers in 2009.††† Second, some injuries and illnesses might not be reported because of employer and employee disincentives for reporting injuries and illnesses or misinterpretation of recordkeeping requirements (8); whether injuries among older workers are more likely to be underreported than those among other age groups is unknown. Third, information on age is available in SOII only for injuries and illnesses that result in lost workdays; 70% of injuries and illnesses reported by employers in 2009 did not result in lost workdays.§§§ Finally, SOII undercounts the number of work-related illnesses because of difficulty in attributing many occupational illnesses specifically to work exposures (2) (e.g., arthritis, respiratory illnesses, and cancers), and this might be a larger problem for older workers who have a lifetime of work and environmental exposures.
Worker safety is a shared responsibility of employers and employer groups, workers and their organizations and medical providers, and government agencies. Although focusing on the health and well-being of all workers throughout their working lifetime is imperative, an urgent need exists to understand and address the needs of older workers as the nation's workforce ages (4). Additional research is needed to guide prevention activities, with specific attention to preventing falls (given the large percentage of fall-related injuries among older workers and the high rates and severity of associated injuries). More research is needed to build the evidence base for preventing older worker injuries and illnesses; however, the increases in the numbers of older workers and associated injuries dictate that interim guidance be developed using available data and research (4).
Examples of such guidance are available from CDC and state public health agencies (5,9,10) and include recommendations for age-awareness training for supervisors and workers, medical assessments of underlying medical conditions and characteristics of the aging process that might increase risk and susceptibility to injury (e.g., loss of visual acuity, hearing loss, and osteoporosis), and reasonable accommodations for older workers. For example, the New Jersey Department of Health and Senior Services has recommended that older workers discuss with their personal physician their ability to work and precautionary measures to address medical or underlying conditions that might increase risk and susceptibility to injury (10). Government agencies, research organizations, and labor and trade organizations should develop, implement, and evaluate additional guidance and programs, including guidance specific to reducing falls among older workers, the various types of work done by older workers, and the diverse industries in which they work.
Acknowledgment
This report is based, in part, on contributions by James Rice, Bur of Labor Statistics, US Dept of Labor.
References
- Toossi M. Employment outlook: 2008-18: labor force projections to 2018: older workers staying more active. Mon Labor Rev 2009;132:30--51.
- US Department of Labor, Bureau of Labor Statistics. Occupational safety and health statistics [Chapter 9]. In: BLS handbook of methods. Washington, DC: US Department of Labor, Bureau of Labor Statistics; 2009. Available at http://www.bls.gov/opub/hom. Accessed January 25, 2011.
- Rogers E, Wiatrowski WJ. Injuries, illnesses, and fatalities among older workers. Mon Labor Rev 2005;128:24--30.
- Society for Occupational and Environmental Health, Association of Occupational and Environmental Clinics. Healthy aging for a sustainable workforce: a conference report, November 2009. Available at http://www.soeh.org/pdf/agingworkersworkshopreport_11%2009_final.pdf. Accessed January 25, 2011.
- CDC. A story of impact: an age-related training tool developed by NIOSH researchers raises awareness about workplace accommodations. Cincinnati, OH: US Department of Health and Human Services, CDC; 2010. Available at http://www.cdc.gov/niosh/docs/2010-165. Accessed January 29, 2011.
- CDC. Nonfatal occupational injuries and illnesses---United States, 2004. MMWR 2007;56:393--7.
- Foley M, Silverstein B, Polissar N. The economic burden of carpal tunnel syndrome: long-term earnings of CTS claimants in Washington State Am J Ind Med 2007;50:155--72.
- US Government Accounting Office. Workplace safety and health: Enhancing OSHA's records audit process could improve the accuracy of worker injury and illness data. Washington, DC: US Government Accounting Office; 2009. Available at http://www.gao.gov/products/GAO-10-10. Accessed January 28, 2011.
- CDC. Fact sheet: older drivers in the workplace: crash prevention for employers and workers. Cincinnati, OH: US Department of Health and Human Services, CDC; 2005. Available at http://www.cdc.gov/niosh/docs/2005-159. Accessed January 29, 2011.
- New Jersey Department of Health and Human Services. Occupational safety and health issues for the older worker. Trenton, NJ: New Jersey Department of Health and Human Services; 2003. Available at http://www.state.nj.us/health/surv/documents/olderwkinfo.pdf. Accessed January 29, 2011.
* Based on a CDC analysis of 2009 Current Population Survey (CPS) microdata files. CPS is the primary source of U.S. labor force statistics and is based on monthly household surveys by the U.S. Census Bureau. Additional information available at http://www.census.gov/cps.
† The survey excludes farms with fewer than 11 employees, private household workers, the self-employed, and federal workers. Data for employees covered by specific federal safety and health legislation are provided by the Mine Safety and Health Administration of the U.S. Department of Labor and the Federal Railroad Administration of the U.S. Department of Transportation. Additional information available at http://www.bls.gov/opub/hom/homch9.htm.
§ The base sample for SOII is designed to produce national estimates. However, each year, approximately 40 states participate in a federal/state cooperative program, through which the base sample is augmented to generate state-specific estimates that meet the individual needs of participating states. In 2009, a total of 40 states and the District of Columbia participated in this program.
¶ Occupational injuries and illnesses are recordable if they involve one or more of the following: loss of consciousness, restriction of work or motion, transfer to another job, or medical treatment (other than first-aid). Additional information available at http://www.osha.gov/recordkeeping/handbook/index.html#1904.4_4.
** Classified according to the BLS Occupational Injury and Illness Classification System. The BLS variable for "event or exposure" is abbreviated in this report as "event." Additional information available at http://www.bls.gov/iif/oshoiics.htm.
†† The BLS Occupational Employment Statistics program produces employment and wage estimates for approximately 800 occupations nationally and at the state level. Additional information available at http://www.bls.gov/oes.
§§ Based on CDC analysis of 2009 CPS microdata files. Additional information available at http://www.census.gov/cps.
¶¶ Based on preliminary data from the BLS Census of Fatal Occupational Injuries. Additional information available at http://www.bls.gov/iif/oshwc/cfoi/cfoi_rates_2009hb.pdf.
*** The emergency department analysis identified 303,000 injuries, compared with 152,760 reported by SOII for private industry workers in 2004. Data from the 2004 SOII are available at http://www.bls.gov/iif/oshcdnew2004.htm#04m. The emergency department data indicated that the highest injury and illness rates were for workers aged 18--19 years, with steady declines for older age groups. These data are available at http://www.cdc.gov/mmwr/preview/mmwrhtml/mm5616a3.htm.
††† A CDC analysis of 2009 CPS microdata files provided estimates of 4,984,091 self-employed and 867,989 federal workers aged ≥55 years (22% of the 27,132,249 workers aged ≥55 years) based on primary job. Similar analyses showed that only 12% of workers aged <55 years worked in these employment categories. Data on private household workers and employees on farms with fewer than 11 employees are not available in CPS. Additional information on CPS and microdata files is available at http://www.census.gov/cps.
§§§ SOII reported 4,140,700 total recordable cases in 2009. Of these, 1,238,490 (30%) involved days away from work (lost workdays). Additional information available at http://data.bls.gov/cgi-bin/dsrv?ii.
What is already known on this topic?
Older workers (defined as those aged ≥55 years) are the nation's fastest growing segment of the working population. These workers have the highest rates of all age groups for fatal occupational injuries and require more time than younger workers to recover from nonfatal occupational injuries.
What is added by this report?
In 2009, 17% of employer-reported nonfatal occupational injuries and illnesses were among workers aged ≥55 years, and median number of days absent from work exceeded those for younger age groups. Older workers have unique patterns of injury compared with other age groups, including lower rates for some types of injuries and illnesses (e.g., such as contact with objects and equipment) and increased rates for others (e.g., falls on the same level, fractures, and hip injuries).
What are the implications for public health practice?
As the workforce ages, additional research and interventions by public health agencies are needed to protect worker health. Steps to improve older worker safety and health are expected to affect the larger workforce because many efforts, such as implementing fall-prevention strategies, would be beneficial for workers of all ages.
FIGURE. Rate* and median days absent from work for employer-reported nonfatal occupational injuries and illnesses resulting in lost workdays, by age group and event† --- United States, 2009
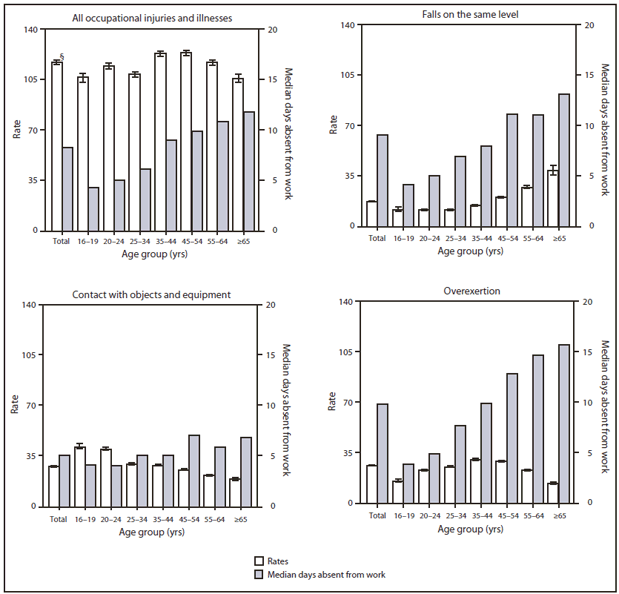
* Per 10,000 full-time equivalent (FTE) workers; one FTE = 2,000 hours worked per year. Data are from the U.S. Department of Labor's Bureau of Labor Statistics (BLS) Survey of Occupational Injuries and Illnesses (SOII). Data represent nonfatal occupational injuries and illnesses resulting in lost workdays reported by employers to the BLS SOII. Farms with fewer than 11 employees, private household workers, the self-employed, and federal employees are excluded. Additional information available at http://www.bls.gov/opub/hom/homch9.htm.
† Classified according to the BLS Occupational Injury and Illness Classification System. Additional information available at http://www.bls.gov/iif/oshoiics.htm.
§ 95% confidence interval.
Alternate Text: The figure above shows the rate and median days absent from work for employer-reported nonfatal occupational injuries and illnesses resulting in lost workdays, by age group and event in the United States in 2009. Workers aged 55-64 years had a rate of nonfatal occupa¬tional injuries and illnesses resulting in lost workdays of 116.8 per 10,000 full-time equivalent (FTE) workers, and workers aged ≥65 years had a rate of 105.9 per 10,000 FTE workers. The rate for workers of all ages combined was 117.2 per 10,000 FTE workers. No consistent age-related trend in overall rates by age group was observed.
Use of trade names and commercial sources is for identification only and does not imply endorsement by the U.S. Department of
Health and Human Services.
References to non-CDC sites on the Internet are
provided as a service to MMWR readers and do not constitute or imply
endorsement of these organizations or their programs by CDC or the U.S.
Department of Health and Human Services. CDC is not responsible for the content
of pages found at these sites. URL addresses listed in MMWR were current as of
the date of publication.
All MMWR HTML versions of articles are electronic conversions from typeset documents.
This conversion might result in character translation or format errors in the HTML version.
Users are referred to the electronic PDF version (http://www.cdc.gov/mmwr)
and/or the original MMWR paper copy for printable versions of official text, figures, and tables.
An original paper copy of this issue can be obtained from the Superintendent of Documents, U.S.
Government Printing Office (GPO), Washington, DC 20402-9371;
telephone: (202) 512-1800. Contact GPO for current prices.
**Questions or messages regarding errors in formatting should be addressed to
mmwrq@cdc.gov.
