 |
|
|
|
|
|
|
| ||||||||||
|
|
|
|
|
|
|
||||
| ||||||||||
|
|
|
|
|
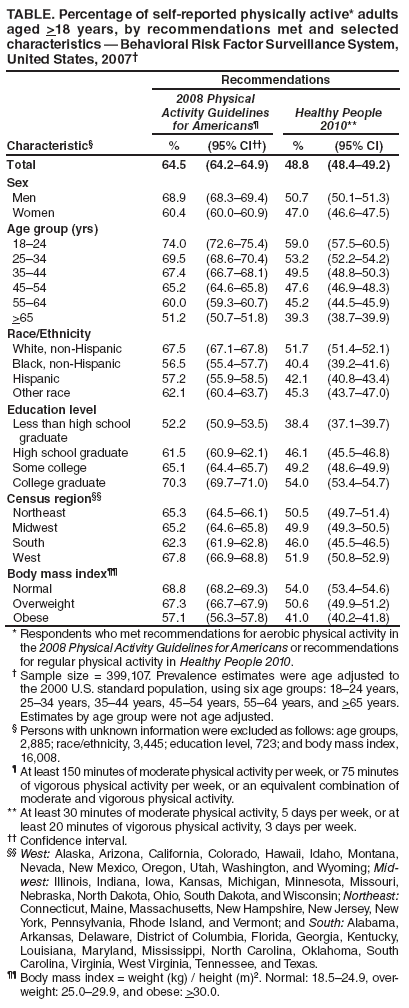
Persons using assistive technology might not be able to fully access information in this file. For assistance, please send e-mail to: mmwrq@cdc.gov. Type 508 Accommodation and the title of the report in the subject line of e-mail. Prevalence of Self-Reported Physically Active Adults --- United States, 2007The report, 2008 Physical Activity Guidelines for Americans (2008 Guidelines), released in October by the U.S. Department of Health and Human Services, provides new guidelines for aerobic physical activity (i.e., activity that increases breathing and heart rate) and muscle strengthening physical activity (1). Under the 2008 Guidelines, the minimum recommended aerobic physical activity required to produce substantial health benefits in adults is 150 minutes of moderate-intensity activity per week, or 75 minutes of vigorous-intensity activity per week, or an equivalent combination of moderate- and vigorous-intensity physical activity. Recommendations for aerobic physical activity in the 2008 Guidelines differ from those used in Healthy People 2010 (HP2010) objectives, which call for adults to engage in at least 30 minutes of moderate-intensity activity, 5 days per week, or 20 minutes of vigorous-intensity activity, 3 days per week (2). To establish baseline data for the 2008 Guidelines and compare the percentage of respondents who reported meeting these guidelines with the percentage who reported meeting HP2010 objectives, CDC analyzed data from the 2007 Behavioral Risk Factor Surveillance System (BRFSS) survey. This report summarizes the results of that analysis, which indicated that, overall, 64.5% of respondents in 2007 reported meeting the 2008 Guidelines, and 48.8% of the same respondents reported meeting HP2010 objectives. Public health officials should be aware that, when applied to BRFSS data, the two sets of recommendations yield different results. Additional efforts are needed to further increase physical activity. BRFSS is a state-based, random-digit--dialed telephone survey of the noninstitutionalized U.S. civilian population aged >18 years. Data for the 2007 BRFSS survey were collected from 430,912 respondents (median response rate: 50.6%; median cooperation rate: 72.1%*) and reported by the 50 states, District of Columbia, Puerto Rico, and U.S. Virgin Islands. Response rates were calculated using guidelines from the Council of American Survey and Research Organizations (CASRO). A total of 31,805 respondents with missing physical activity data were excluded, resulting in a final sample of 399,107. Since 2001, in alternate years, BRFSS surveys have included the same questions regarding participation in moderate-intensity and vigorous-intensity physical activities. In 2007, to assess participation in moderate activities, respondents were asked, "When you are not working, in a usual week, do you do moderate activities for at least 10 minutes at a time, such as brisk walking, bicycling, vacuuming, gardening, or anything else that causes some increase in breathing or heart rate?" Respondents who answered "yes" were then asked, "How many days per week do you do these moderate activities for at least 10 minutes at a time?" Finally, they were asked, "On days when you do moderate activities for at least 10 minutes at a time, how much total time per day do you spend doing these activities?" To assess participation in vigorous-intensity activities, respondents were asked, "When you are not working, in a usual week, do you do vigorous activities for at least 10 minutes at a time, such as running, aerobics, heavy yard work, or anything else that causes large increases in breathing or heart rate?" Respondents who answered "yes" were then asked, "How many days per week do you do these vigorous activities for at least 10 minutes at a time?" Finally, they were asked, "On days when you do vigorous activities for at least 10 minutes at a time, how much total time per day do you spend doing these activities?" Using the 2008 Guidelines, respondents were classified as physically active if they reported at least 150 minutes per week of moderate-intensity activity, or at least 75 minutes per week of vigorous-intensity activity, or a combination of moderate-intensity and vigorous-intensity activity (multiplied by two) totaling at least 150 minutes per week. Using the HP2010 objectives, respondents were classified as physically active if they reported at least 30 minutes of moderate activity, 5 or more days per week, or at least 20 minutes of vigorous activity, 3 or more days per week.† Data were analyzed by selected characteristics, age adjusted to the 2000 U.S. standard population, and weighted to provide overall estimates; 95% confidence intervals were calculated. Statistically significant differences in prevalence were determined by t-test (p<0.05). Using the 2008 Guidelines, 64.5% of U.S. adults were classified as physically active in 2007, including 68.9% of men and 60.4% of women (Table). By age group, the percentage classified as physically active ranged from 51.2% (>65 years) to 74.0% (18--24 years). Among racial/ethnic populations, prevalence was lower for non-Hispanic blacks (56.5%) than for non-Hispanic whites (67.5%, p<0.01). By education level, prevalence was lowest for persons with less than a high school diploma (52.2%) and highest among college graduates (70.3%). By U.S. census region,§ prevalence was lowest among respondents in the South (62.3%) and highest among those in the West (67.8%). A smaller percentage of persons classified as obese (57.1%) were physically active than persons classified as overweight (67.3%, p<0.01) or of normal weight (68.8%, p<0.01).¶ Applying the HP2010 objectives to the same respondents, the percentage of U.S. adults overall in 2007 classified as physically active was 48.8%, including 50.7% of men and 47.0% of women (Table). Greater prevalence estimates were noted across all variables when comparing the 2008 Guidelines with the HP2010 objectives; patterns by sex, age group, race/ethnicity, education level, census region, and weight classification were similar. Reported by: SA Carlson, MPH, JE Fulton, PhD, DA Galuska, PhD, J Kruger, PhD, Div of Nutrition, Physical Activity, and Obesity, National Center for Chronic Disease Prevention and Health Promotion; F Lobelo, MD, FV Loustalot, PhD, EIS officers, CDC. Editorial Note:The findings in this report indicate that 64.5% of U.S. adults reported meeting the minimum level of aerobic physical activity in the 2008 Guidelines using BRFSS 2007 data. When HP2010 physical activity objectives were assessed using the same respondents, 48.8% reported meeting minimum levels of physical activity, a difference of 15.7 percentage points. Prevalence patterns by demographic variables were consistent with those reported previously for physical activity (3,4). Similar to findings in this report, a 2000 study noted a greater prevalence of physically active persons by using >150 minutes per week as the criteria, compared with six other criteria for moderate acttivity (5). The 2008 Guidelines reflect the most recent major scientific review of the health benefits of physical activity. Officials at state and local health departments and other agencies and organizations that promote physical activity can utilize these evidence-based guidelines in developing physical activity initiatives. Findings from this report can serve as a baseline comparison with future estimates of physical activity using survey data. Analysis of the findings in this report identified two main reasons why a higher proportion of respondents were classified as physically active based on the 2008 Guidelines than based on the HP2010 objectives: 1) removal of the frequency and duration requirement (i.e., 30 minutes of moderate activity, 5 days per week, or 20 minutes of vigorous activity, 3 days per week) and 2) addition of the criteria enabling respondents to meet the guidelines with a combination of moderate and vigorous (multiplied by two) activity. The report from the Physical Activity Guidelines Advisory Committee** emphasized total volume of activity for health benefits, independent of frequency. As explained in the 2008 Guidelines, existing scientific evidence cannot determine whether the health benefits of 30 minutes of activity, 5 days per week, are any different from the benefits of 50 minutes, 3 days per week. As a result, the 2008 Guidelines allow a person to accumulate 150 minutes a week in various combinations (1). Nonetheless, the 2008 Guidelines add that aerobic activity should be performed in periods of at least 10 minutes, and preferably, those periods should be spread throughout the week. The findings in this study are subject to at least three limitations. First, BRFSS data are self-reported and subject to recall and social-desirability bias; compared with accelerometer-measured physical activity, higher levels of self-reported physical activity were reported (6). Second, BRFSS is a landline telephone survey and excludes persons in households without telephone access or persons who use only cellular telephones. Finally, the mean CASRO response rate was 50.6%, and low response rates can result in response bias; however, BRFSS estimates generally are comparable with estimates from surveys based on face-to-face interviews. In addition, weighting adjustments that account for sex, age group, and race/ethnicity attempt to minimize nonresponse, noncoverage, and undercoverage (7,8). Approximately one third of U.S. adults did not report meeting minimum levels of aerobic physical activity as defined by the 2008 Guidelines. Minimum levels were analyzed for this report because they provided the most direct comparison with Healthy People 2010 objectives. However, more extensive health benefits can be attained by engaging in physical activity beyond these levels (1). Increasing physical activity among U.S. adults can be accomplished through informational, behavioral, and environmental evidence-based approaches, such as those recommended in the Guide to Community Preventive Services.†† Strong evidence of increased physical activity has been documented for communitywide campaigns, targeted health-behavior change programs, school-based physical education, nonfamily social support, and increased access to locations for physical activity combined with information outreach activities. Evidence of increased physical activity also has been documented for use of point-of-decision prompts and for community-scale and street-scale urban design and land-use policies and practices (9,10). References
* The response rate is the percentage of persons who completed interviews among all eligible persons, including those who were not successfully contacted. The cooperation rate is the percentage of persons who completed interviews among all eligible persons who were contacted. † For example, both of the following persons would be considered physically active under the 2008 Guidelines but would not be considered physically active under HP2010 objectives: a person who did moderate activity for 25 minutes, 7 days per week, and a person who did vigorous activity for 40 minutes, 2 days per week. § West: Alaska, Arizona, California, Colorado, Hawaii, Idaho, Montana, Nevada, New Mexico, Oregon, Utah, Washington, and Wyoming; Midwest: Illinois, Indiana, Iowa, Kansas, Michigan, Minnesota, Missouri, Nebraska, North Dakota, Ohio, South Dakota, and Wisconsin; Northeast: Connecticut, Maine, Massachusetts, New Hampshire, New Jersey, New York, Pennsylvania, Rhode Island, and Vermont; and South: Alabama, Arkansas, Delaware, District of Columbia, Florida, Georgia, Kentucky, Louisiana, Maryland, Mississippi, North Carolina, Oklahoma, South Carolina, Virginia, West Virginia, Tennessee, and Texas. ¶ Normal, overweight, and obese classifications are on the basis of body mass index, which is weight (kg) / height (m)2. Normal: 18.5--24.9, overweight: 25.0--29.9, and obese: >30.0. ** Available at http://www.health.gov/paguidelines/report. †† Available at http://www.thecommunityguide.org/pa.
All MMWR HTML versions of articles are electronic conversions from typeset documents. This conversion might result in character translation or format errors in the HTML version. Users are referred to the electronic PDF version (http://www.cdc.gov/mmwr) and/or the original MMWR paper copy for printable versions of official text, figures, and tables. An original paper copy of this issue can be obtained from the Superintendent of Documents, U.S. Government Printing Office (GPO), Washington, DC 20402-9371; telephone: (202) 512-1800. Contact GPO for current prices. **Questions or messages regarding errors in formatting should be addressed to mmwrq@cdc.gov.Date last reviewed: 12/3/2008 |
|||||||||
|