 |
|
|
|
|
|
|
| ||||||||||
|
|
|
|
|
|
|
||||
| ||||||||||
|
|
|
|
|
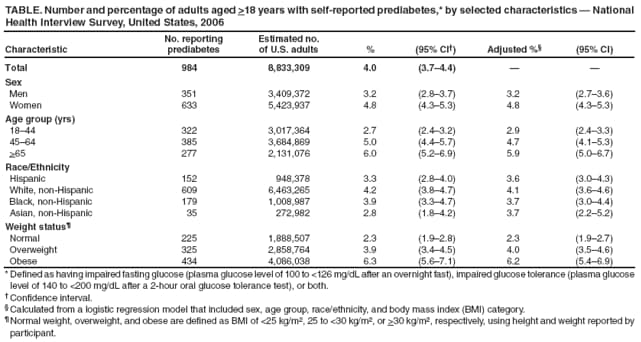
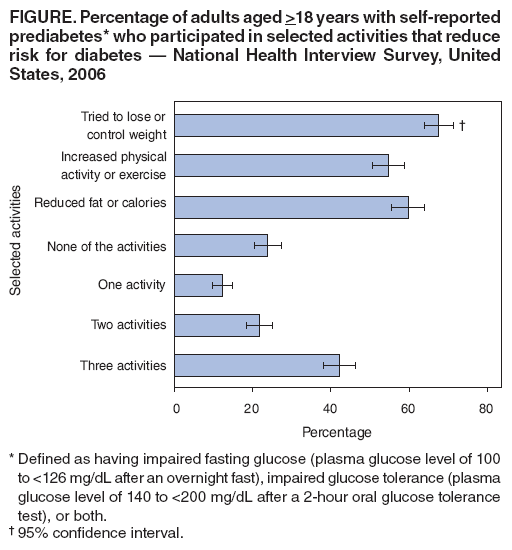
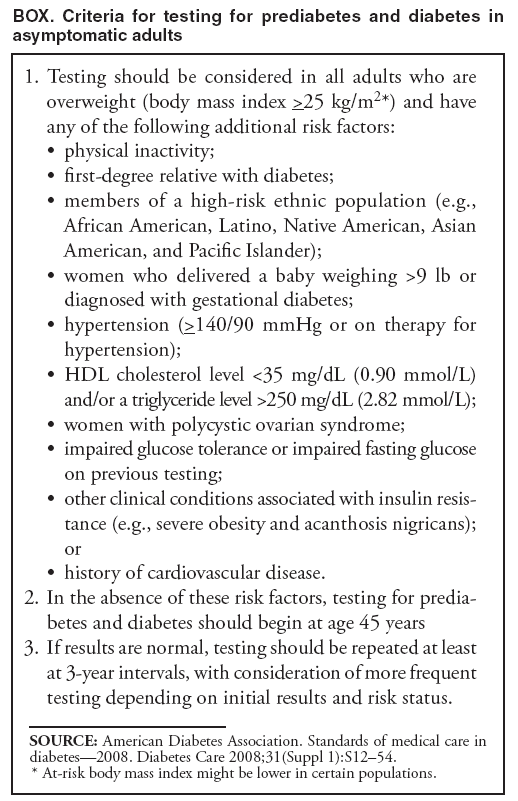
Persons using assistive technology might not be able to fully access information in this file. For assistance, please send e-mail to: mmwrq@cdc.gov. Type 508 Accommodation and the title of the report in the subject line of e-mail. Self-Reported Prediabetes and Risk-Reduction Activities --- United States, 2006At least one fourth of U.S. adults are known to have prediabetes, a condition defined as having impaired fasting glucose (plasma glucose level of 100 to <126 mg/dL after an overnight fast), impaired glucose tolerance (plasma glucose level of 140 to <200 mg/dL after a 2-hour oral glucose tolerance test), or both (1--3). Persons with prediabetes are at increased risk for developing type 2 diabetes, heart disease, and stroke (3--5). However, lifestyle changes can prevent or delay development of diabetes and its complications among persons with prediabetes (3,5). To assess the prevalence of self-reported prediabetes among U.S. adults and the prevalence of activities that can reduce the risk for diabetes, CDC analyzed responses to questions regarding prediabetes asked for the first time in the 2006 National Health Interview Survey. This report summarizes the results of that analysis, which determined that, although at least one fourth of U.S. adults are known to have prediabetes through surveys that included laboratory testing, in 2006, only an estimated 4% of U.S. adults had been told they had prediabetes. Among those who had been told they had prediabetes, 68% had tried to lose or control weight, 55% had increased physical activity or exercise, 60% had reduced dietary fat or calories, and 42% had engaged in all three activities. Persons at greater risk for diabetes should be tested according to published recommendations, and persons with prediabetes should lose or control their weight and increase their physical activity to reduce their risk for developing diabetes. NHIS is an annual, nationally representative, household probability survey of the noninstitutionalized, U.S. civilian population, conducted by face-to-face interview (6). In 2006, the survey included 24,275 adults aged >18 years. NHIS sample weights were calibrated to 2000 U.S. census-based totals for sex, age, and race/ethnicity. The total household response rate was 87%, and 81% of persons identified as sample adults completed the interview, yielding a final response rate of 71% for the adult sample (6). All participants who did not answer "yes" to the question "Other than during pregnancy, have you ever been told by a doctor or health professional that you have diabetes or sugar diabetes?" were asked five additional questions: "Have you ever been told by a doctor or health-care professional that you have 1) prediabetes? 2) impaired fasting glucose? 3) impaired glucose tolerance? 4) borderline diabetes? or 5) high blood sugar?" Prediabetes was defined as answering "yes" to at least one of these five questions. Under this definition, 984 participants reported having been told they had prediabetes. NHIS participants also were asked three questions about their risk-reduction activities: "People often engage in activities to lower their risk for health problems or certain diseases. During the past 12 months have you 1) been trying to control or lose weight? 2) increased your physical activity or exercise? or 3) reduced the amount of fat or calories in your diet?" Prevalence of self-reported prediabetes was estimated by sex, age group, race/ethnicity, and weight status.* To make comparisons among the levels of each covariate while simultaneously adjusting for differences in the distributions of all the other covariates, adjusted percentages were estimated from a logistic regression model predicting prediabetes as a function of sex, age group, race/ethnicity, and weight status (7). Among those adults with self-reported prediabetes, estimates were made of the percentages told they had each of five conditions indicative of prediabetes (i.e., prediabetes itself, impaired fasting glucose, impaired glucose tolerance, borderline diabetes, or high blood sugar). Estimates then were made of the percentages with prediabetes who engaged in each of the three risk-reduction activities and the percentages who engaged in zero, one, two, or all three activities. In 2006, an estimated 4.0% of U.S. adults had self-reported prediabetes (Table). Among them, 64.4% (95% confidence interval [CI] = 59.9%--68.7%) had been told they had borderline diabetes. Percentages for the other four conditions indicative of prediabetes were as follows: high blood sugar, 38.3% (CI = 34.3%--42.5%); prediabetes itself, 33.7% (CI = 30.3%--37.3%); impaired glucose tolerance, 15.5% (CI = 12.3%--19.2%); and impaired fasting glucose, 15.2% (CI = 12.4%--18.6%). In addition, 43.3% (CI = 39.5%--47.3%) had been told that they had two or more of the five conditions. The estimated prevalence of self-reported prediabetes increased with age, ranging from 2.7% among those aged 18--44 years to 6.0% among those aged >65 years (Table). Prevalence also increased with weight status: 2.3% among those with normal weight, 3.9% among those categorized as overweight, and 6.3% among those categorized as obese. Prediabetes was more prevalent among women (4.8%) than men (3.2%). No significant differences were observed in prevalence by race/ethnicity. Among adults with self-reported prediabetes, 67.6% (CI = 63.7%--71.4%) had been trying to lose or control weight during the preceding 12 months, 59.8% (CI = 55.6%--64.0%) had reduced dietary fat or calories, and 54.7% (CI = 50.7%--58.7%) had increased physical activity or exercise. Although 42.1% (CI = 38.0%--46.3%) reported engaging in all three activities during the preceding 12 months, 23.9% (CI = 20.3%--27.4%) had not engaged in any of these risk-reduction activities (Figure). Reported by: DR Rolka, MS, NR Burrows, MPH, Y Li, MPH, LS Geiss, MA, Div of Diabetes Translation, National Center for Chronic Disease Prevention and Health Promotion, CDC. Editorial Note:This report provides the first nationally representative estimates of the prevalence of self-reported prediabetes in the U.S. adult population and the first estimates of the prevalence of risk-reduction activities among adults who had been told they had prediabetes. The results indicate that, in 2006, only 4% of U.S. adults were aware they had prediabetes or a condition indicative of prediabetes. In addition, 24% of U.S. adults with prediabetes did not participate in any of three recommended risk-reduction activities The finding of 4% self-reported prevalence of prediabetes is low compared with the 26% of U.S. adults aged >20 years estimated to have impaired fasting glucose based on laboratory test results in the 2003--2006 National Health and Nutrition Examination Survey (NHANES) (1). Other NHANES data, from 1988--1994, indicate an even higher prevalence of prediabetes among persons aged 40--74 years. During that period, NHANES conducted oral glucose tolerance tests of persons in that age group and estimated that 40% of adults aged 40--74 years had impaired fasting glucose, impaired glucose tolerance, or both (2). The low prevalence of self-reported prediabetes described in this report likely indicates a low level of awareness among persons who have prediabetes. Prediabetes is a relatively new term that came into wider use beginning in 2002, after publication of results from the Diabetes Prevention Program intervention trial (5). Physicians and other health-care providers have used various other terms to describe prediabetes. The use of different terms might have produced confusion among persons over what their health-care providers diagnosed. The results of this analysis also might indicate that a large percentage of persons with prediabetes have not been tested or diagnosed. The tests used to screen for prediabetes are the same as those used to screen for diabetes, and the population at risk for prediabetes is the same population as that at risk for type 2 diabetes. Hence, screening recommendations for prediabetes are essentially the same as those for diabetes (3). The American Diabetes Association has recommended that testing for prediabetes and diabetes be considered for adults who meet certain criteria (Box (8). The Diabetes Prevention Program intervention trial showed that diet and exercise can lower the incidence of type 2 diabetes by 58% over 3 years among those at high risk for diabetes (5). Trial participants lost weight by reducing dietary fat and calories and by exercising at least 30 minutes a day, 5 days a week. The American Diabetes Association recommends that clinicians counsel patients with prediabetes on weight loss of 5--10% of body weight and on increasing physical activity to at least 150 minutes of moderate activity (e.g., walking) per week. Metformin administration should be considered under certain circumstances (8). However, the results in this report indicate that, although 42% of adults with prediabetes tried to lose or control weight, reduce fat or calories, and increase physical activity, one fourth did not engage in any of these risk-reduction activities. The findings in this report are subject to at least two limitations. First, NHIS interviews are household based and do not include persons who are institutionalized, including those living in nursing homes. Second, the 2006 NHIS questions regarding self-reported prediabetes were asked for the first time. Hence, no previous studies are available for comparison and validation. Interventions to prevent or delay onset of type 2 diabetes in persons with prediabetes are feasible and cost effective, and lifestyle interventions are more cost effective than medications (9). The gap in prevalence between those with prediabetes and those aware of their condition presents an opportunity to reduce the burden of diabetes by increasing awareness of prediabetes and encouraging adoption of healthier lifestyles and risk-reduction activities. References
* Categorized as normal weight (body mass index [BMI] of <25 kg/m2), overweight (25 to <30 kg/m2), or obese (>30 kg/m2), using height and weight reported by participant. Table
All MMWR HTML versions of articles are electronic conversions from typeset documents. This conversion might result in character translation or format errors in the HTML version. Users are referred to the electronic PDF version (http://www.cdc.gov/mmwr) and/or the original MMWR paper copy for printable versions of official text, figures, and tables. An original paper copy of this issue can be obtained from the Superintendent of Documents, U.S. Government Printing Office (GPO), Washington, DC 20402-9371; telephone: (202) 512-1800. Contact GPO for current prices. **Questions or messages regarding errors in formatting should be addressed to mmwrq@cdc.gov.Date last reviewed: 11/6/2008 |
|||||||||
|