 |
|
|
|
|
|
|
| ||||||||||
|
|
|
|
|
|
|
||||
| ||||||||||
|
|
|
|
|
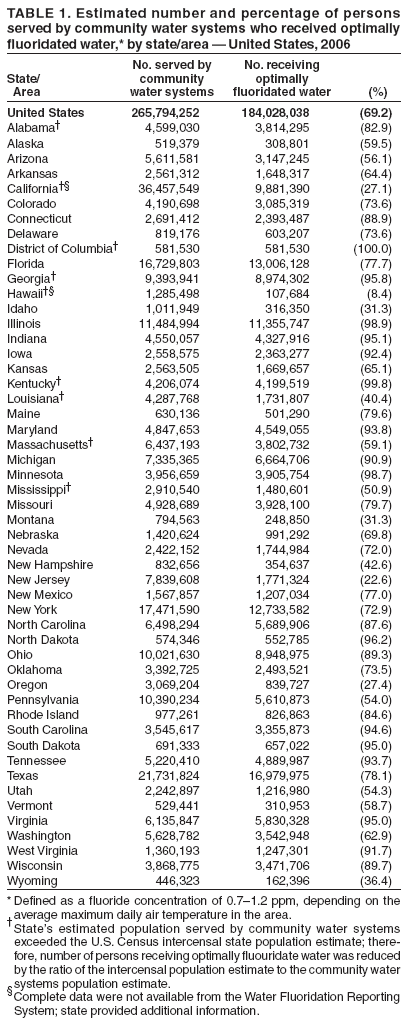
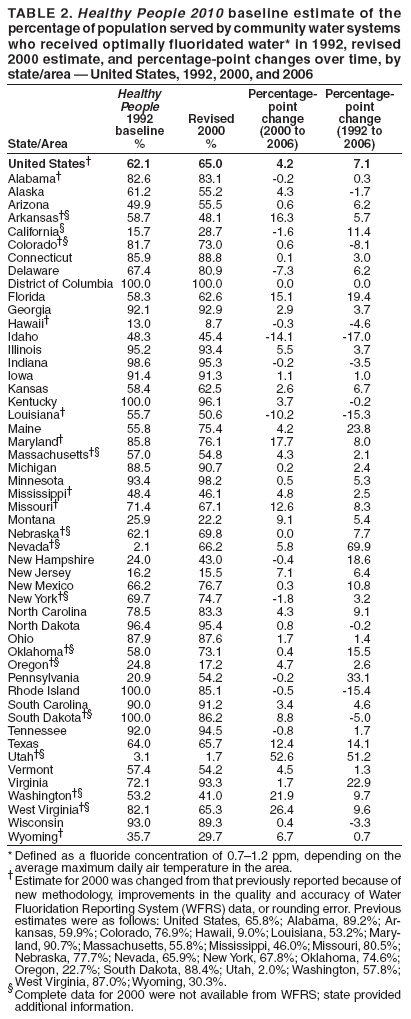
Persons using assistive technology might not be able to fully access information in this file. For assistance, please send e-mail to: mmwrq@cdc.gov. Type 508 Accommodation and the title of the report in the subject line of e-mail. Populations Receiving Optimally Fluoridated Public Drinking Water --- United States, 1992--2006Water fluoridation has been identified by CDC as one of 10 great public health achievements of the 20th century. The decline in the prevalence and severity of dental caries (tooth decay) in the United States during the past 60 years has been attributed largely to the increased use of fluoride (1). Community water fluoridation is an equitable and cost-effective method for delivering fluoride to the community (2--4). A Healthy People 2010 objective is to increase to 75% the proportion of the U.S. population served by community water systems who receive optimally fluoridated water* (5). To update and revise previous reports on fluoridation in the United States (4) and describe progress toward the Healthy People 2010 objective, CDC analyzed fluoridation data for the period 1992--2006 from the 50 states and District of Columbia (DC). The results indicated that the percentage of the U.S. population served by community water systems who received optimally fluoridated water increased from 62.1% in 1992, to 65.0% in 2000, and 69.2% in 2006, and those percentages varied substantially by state. Public health officials and policymakers in states with lower percentages of residents receiving optimal water fluoridation should consider increasing their efforts to promote fluoridation of community water systems to prevent dental caries. Since 1945, the U.S. Public Health Service and CDC (beginning in 1975) have tracked the number of persons in the United States receiving fluoridated water.† The U.S. Environmental Protection Agency (EPA) does not regulate water fluoridation, and EPA's Safe Drinking Water Information System (SDWIS) only tracks fluoride concentrations in water systems with naturally occurring fluoride levels above the established regulatory maximum contaminant level (4.0 ppm§). Water fluoridation is managed at the state level, and CDC relies on states to provide data on individual community water systems (e.g., population served, fluoride concentration, and fluoride source). During 1998--2000, CDC, in partnership with the Association of State and Territorial Dental Directors, developed the Water Fluoridation Reporting System (WFRS) to support management and tracking of state fluoridation programs. WFRS is a voluntary system designed, in part, to make additional use of community water system data that states were already required to report to EPA as part of SDWIS. In March 2007, CDC asked state dental directors and drinking water administrators to validate their state data reported via WFRS for 2006. Estimates of the population served by community water systems were based on the number of households served (i.e., service connections) and the number of persons in each household. Some states supplemented population data in WFRS with population data from SDWIS, which can differ slightly from WFRS. The percentage of the population served by community water systems who received optimally fluoridated water was calculated by dividing the population served by community water systems with optimal fluoride levels by the total population served by community water systems. For eight states and DC, the reported 2006 total community water system population estimates exceeded mid-year intercensal state population estimates (6), which can occur when applying a standard persons-per-household factor to the number of households served. For these eight states and DC, state community water system population estimates were set equal to the intercensal state population estimates, and estimates of the population receiving optimally fluoridated water were reduced by a factor equal to the state's intercensal population estimate divided by the initially reported total state community water system population. National community water system population estimates were calculated by adding the state community water system population estimates after this reduction. CDC previously published a report on fluoridation estimates for 2000 (4), using WFRS data reviewed by state oral health programs. At that time, state community water system populations that exceeded the state's 2000 census populations (seven states and DC) were changed to match the 2000 census populations. Earlier, in calculating 1992 fluoridation estimates, state community water system populations that exceeded state census population estimates also were changed to match 1992 intercensal state population estimates (10 states and DC). Because these two reports used the reduced state community water system populations for their calculations without making any adjustments to the populations receiving fluoridated water, the percentages potentially were overstated. This report revises the 2000 fluoridation percentage estimates, applying the same methods used to produce the 2006 estimates, and reflecting improvements in the quality and accuracy of some WFRS state data. The 1992 fluoridation estimates could not be revised similarly because water system population data from 1992 were no longer available. In 2006, 69.2% of the U.S. population served by community water systems received optimally fluoridated water (Table 1), an increase from 62.1% in 1992, and from 65.0% in 2000 (Table 2). State-specific percentages in 2006 ranged from 8.4% in Hawaii to 100% in DC (median: 77.0%). In 2006, the Healthy People 2010 target of 75% had been met by 25 states and DC (Table 1). Overall, approximately 184 million persons served by community water systems received fluoridated water; of that number, approximately 8 million persons received water with sufficient naturally occurring fluoride concentrations. During 1992--2006, 39 states reported increases in the percentage of their populations served by community water systems who received optimally fluoridated water; percentage-point increases ranged from 0.3 in Alabama to 69.9 in Nevada (median: 6.2). Ten states had decreases; percentage-point decreases ranged from 0.2 in Kentucky and North Dakota to 17.0 in Idaho (median: 4.3) (Table 2). Throughout 1992--2006, 100% of the DC population served by community water systems received optimally fluoridated water. Reported by: W Bailey, DDS, L Barker, MSPH, K Duchon, MS, W Maas, DDS, Div of Oral Health, National Center for Chronic Disease Prevention and Health Promotion, CDC. Editorial Note:Dental caries is a complex, chronic disease with multiple protective factors (e.g., dental sealants or healthy dietary practices), including fluoride (7); teeth remain at risk for decay throughout the lifespan, with older adults experiencing rates of caries similar to rates among children (8). Community water fluoridation has been effective in preventing tooth decay (1). Commercially sold bottled waters might or might not contain fluoride, and most bottled waters do not contain fluoride in optimal concentrations (9). WFRS data indicate that, from 1992 to 2006, the percentage of the U.S. population served by community water systems who received optimally fluoridated water increased from 62.1% to 69.2%. During that period, the percentage increased in most states; by 2006, half the states had reached the Healthy People 2010 target of 75%. However, the 2006 data also indicate substantial differences among states in progress toward that target. For example, in California, the percentage of the state population served by community water systems who received optimally fluoridated water increased by 11.4 percentage points from 1992 to 2006. However, in 2006, the percentage of the California population served by community water systems who received optimally fluoridated was only 27.1%, third lowest among states. A 1995 state law required community water systems in California to implement fluoridation if state funds were provided to the community; however, implementation has been limited by engineering and funding constraints. In Idaho, the percentage receiving optimally fluoridated water declined by 17.0 percentage points from 1992 to 2006 because of reclassification from optimal to below optimal of a large community water system in Boise. In Louisiana, the percentage declined by 15.3 points during the same period, largely because of relocation of a substantial number of residents from areas with fluoridation to areas without fluoridation after Hurricane Katrina. In Maine, several local referenda were passed during 1996--2004, authorizing community water systems to fluoridate; as a result, 29 communities gained access to fluoridated water. The Maine percentage increased by 23.8 percentage points during 1992--2006. The findings in this report are subject to at least three limitations. First, revision of estimated percentages for 2000 using original community water system populations without similar revision of 1992 percentages resulted in a slight underestimation of percentage-point changes among certain states from 1992 to 2006. Second, changes in percentages over time for some states resulted from improvements in the quality and accuracy of WFRS data collection and not from actual increases or decreases in the state population with optimal fluoridation. Finally, not all data came from WFRS; some states provided data from other sources, which might have reduced comparability of estimates among states. Since its development during 1998--2000, WFRS has become a valuable tool for monitoring fluoridation programs, improving fluoridation data quality, and routinely reporting fluoridation status at national, state, and local levels. For 2006, 48 states and DC reported their data via WFRS. In 2002, CDC developed and launched two Internet-based systems to provide public access to water fluoridation information stored in WFRS. Oral Health Maps generates maps showing fluoridation percentages at state and county levels and provides summary data tables.¶ My Water's Fluoride provides public access to fluoridation information for individual community water systems.** Currently, 36 states provide public access to water fluoridation information online via Oral Health Maps and My Water's Fluoride. Attainment of the Healthy People 2010 objective will require 1) recognition by policymakers and the public that dental caries remains an important public health problem and that fluoridation is an equitable and cost-effective method of addressing the problem, even in smaller populations where the per-capita cost of fluoridation is higher; 2) continuing science-based education of the public about the established safety of fluoridation; and 3) the political will to adopt new fluoridation systems in communities that are not served currently (10). To overcome the challenges facing fluoridation, public health professionals at the national, state, and local level will need to enhance their promotion of fluoridation and commit the necessary resources for equipment, personnel, and training. Acknowledgments This report is based, in part, on contributions from S Presson, D Apanian, Div of Oral Health, National Center for Chronic Disease Prevention and Health Promotion, CDC; B Laughlin, Alabama Dept of Environmental Management; B Whistler, Alaska Dept of Health; R Tuscano, Arizona Dept of Health Svcs; L Mouden, Arkansas Dept of Health; G Hoffmann, California Dept of Drinking Water and Environmental Management; D Felzien, Colorado Dept of Public Health and Environment; P Painter, Connecticut Dept of Public Health; GB McClure, Delaware Div of Public Health; H Davis, Florida Dept of Health; E Rutti-Cain, Georgia Rural Water Assn; M Greer, Hawaii Dept of Health; L Penny, Idaho Dept of Health and Welfare; R Mutzbauer, Illinois Dept of Public Health; D Cain, Indiana State Dept of Health; R Russell, Iowa Dept of Public Health; D Waldo, Kansas Dept of Health and Environment; R Murphy, Kentucky Dept for Public Health; A Laughlin, Louisiana Office of Public Health; N Reilman, Maryland Dept of the Environment; J Feinstein, Maine Dept of Human Svcs; M Foley, Massachusetts Dept of Public Health; K Philip, Michigan Dept of Environmental Quality; D Rindal, Minnesota Dept of Health; C Seed, Montana Dental Health Program; K McFarland, Nebraska Dept of Health and Human Svcs; L Cofano, Nevada State Health Div; S Kilbreath, New Jersey Dept of Health; N Martin, New Hampshire Dept of Health and Human Svcs; R Romero, New Mexico Dept of Health; J Reuther, New York State Dept of Health; G Stewart, North Dakota Dept of Health; C Wolf, Ohio Dept of Health; M Morgan, Oklahoma State Dept of Health; D Leland, Oregon Dept of Human Svcs; K Chenosky, Pennsylvania Dept of Health; J Swallow, Rhode Island Dept of Health; D Boston, South Carolina Dept of Health and Environmental Control; J Ellingson, South Dakota Dept of Health; W Wells, Tennessee Dept of Environment and Conservation; T Napier, Texas Dept of Health; S Steed, Utah Dept of Health; S Arthur, Vermont Dept of Health Dental Svcs; L Syrop, Virginia Dept of Health; R Pedlar, Washington Dept of Health; K Cobb, West Virginia Bur for Public Health; W LeMay, Wisconsin Div of Public Health. References
* Defined as a fluoride concentration of 0.7--1.2 ppm, depending on the average maximum daily air temperature in the area; optimal concentrations are set lower in warmer climates, where the populations drink more water, and higher in cooler climates. † Available at http://www.cdc.gov/nohss/fsgrowth_text.htm. § EPA also has set a secondary maximum contaminant level of 2.0 ppm as a precaution against possible tooth discoloration or pitting from excess fluoride exposure during the formative period for young children. Additional information is available at http://www.epa.gov/safewater/consumer/2ndstandards.html. ¶ Available at http://apps.nccd.cdc.gov/gisdoh. ** Available at http://apps.nccd.cdc.gov/mwf/index.asp.
Table 1
All MMWR HTML versions of articles are electronic conversions from typeset documents. This conversion might result in character translation or format errors in the HTML version. Users are referred to the electronic PDF version (http://www.cdc.gov/mmwr) and/or the original MMWR paper copy for printable versions of official text, figures, and tables. An original paper copy of this issue can be obtained from the Superintendent of Documents, U.S. Government Printing Office (GPO), Washington, DC 20402-9371; telephone: (202) 512-1800. Contact GPO for current prices. **Questions or messages regarding errors in formatting should be addressed to mmwrq@cdc.gov.Date last reviewed: 7/9/2008 |
|||||||||
|