 |
|
|
|
|
|
|
| ||||||||||
|
|
|
|
|
|
|
||||
| ||||||||||
|
|
|
|
|
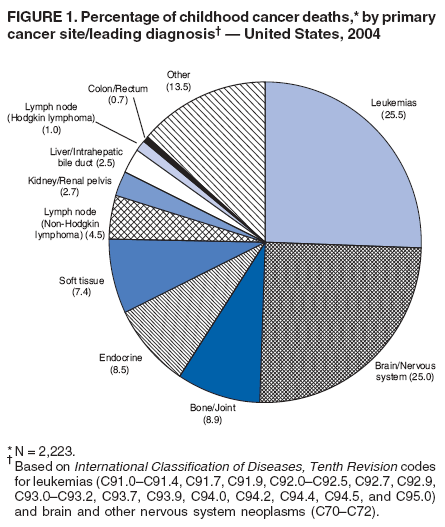
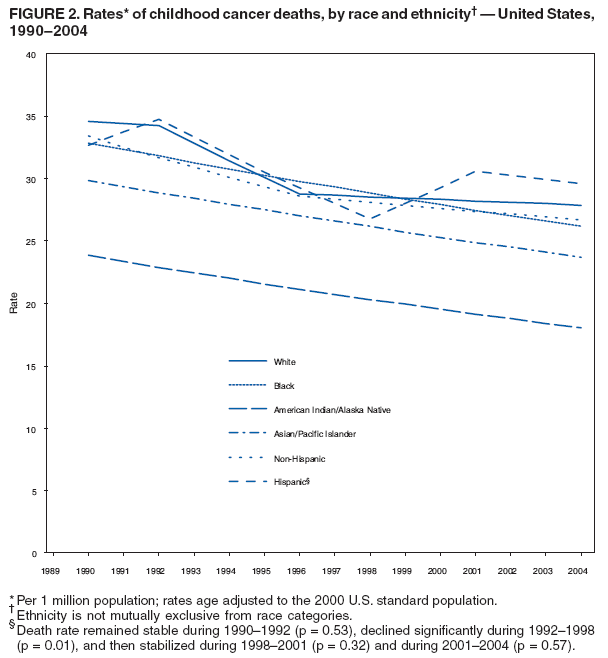
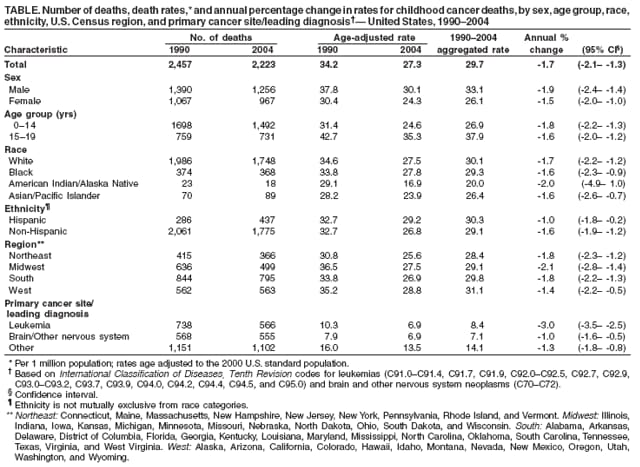
Persons using assistive technology might not be able to fully access information in this file. For assistance, please send e-mail to: mmwrq@cdc.gov. Type 508 Accommodation and the title of the report in the subject line of e-mail. Trends in Childhood Cancer Mortality --- United States, 1990--2004Cancer is the fourth most common cause of death (after unintentional injury, homicide, and suicide) among persons aged 1--19 years in the United States (1,2). Because recent childhood cancer mortality has not been well characterized in terms of temporal, demographic, and geographic trends (2,3), CDC analyzed cancer death rates among children (defined as aged 0--14 years) and adolescents (defined as aged 15--19 years) for the period 1990--2004 by sex, age group, race, ethnicity, U.S. Census region, and primary cancer site/leading diagnosis, using the most recent data available from the National Vital Statistics System (NVSS). This report describes the results of that analysis, which indicated that, overall, age-adjusted childhood cancer death rates decreased significantly during 1990--2004 among both sexes, both age groups, all races (except American Indians/Alaska Natives [AI/ANs]), Hispanics, non-Hispanics, and all U.S. Census regions. However, decreases in death rates varied among U.S. Census regions and between Hispanics and non-Hispanics. Eliminating racial/ethnic health disparities is one of the overarching goals of Healthy People 2010 (4). Further research is needed to understand geographic and ethnic disparities in childhood cancer death rates. Moreover, cancer prevention and intervention measures should be designed to reach populations that are underserved and at high risk. NVSS collects death certificate data from vital statistics offices in the 50 states and the District of Columbia.* All reported deaths among children and adolescents during 1990--2004 were included in this analysis. Population estimates used as denominators in death rate calculations were from the U.S. Bureau of the Census and were modified by the Surveillance, Epidemiology, and End Results (SEER) program (1).† Age-adjusted death rates and trends were calculated for all primary cancer sites combined and for the two leading cancer diagnoses: leukemias and brain and other nervous system neoplasms.§ All rates were per 1 million population and age adjusted to the 2000 U.S. standard population. For all primary cancer sites/leading diagnoses combined, death rates and trends were stratified further by sex, age, race, ethnicity, and U.S. Census region. Rates and overall annual percentage changes (APCs) from 1990 to 2004 were calculated using SEER-Stat.¶ Joinpoint regression was performed to determine statistically significant changes in trends during 1990--2004 (5). The overall statistical significance level was a = 0.05, with a maximum of three joinpoints and four line segments allowed (5). A total of 34,500 childhood cancer deaths were reported in the United States during 1990--2004. A total of 2,223 cancer deaths occurred in 2004; among these, leukemias were the most common diagnoses (25.5%), followed by brain and other nervous system neoplasms (25.0%) (Figure 1). From 1990 to 2004, death rates declined significantly for leukemias by 3.0% per year, for brain and other nervous system neoplasms by 1.0% per year, and for all other cancers combined by 1.3% per year (Table). For all cancers combined during 1990--2004, boys (33.1 per million) had significantly higher death rates than girls (26.1); adolescents (37.9) had significantly higher death rates than children (26.9); whites (30.1) and blacks (29.3) had significantly higher death rates than Asians/Pacific Islanders (A/PIs) (26.4) and AI/ANs (20.0), respectively; and Hispanics (30.3) had significantly higher death rates than non-Hispanics (29.1) (Table). Death rates decreased similarly by sex, age group, and race; decreases ranged from 1.5% to 2.0% per year during 1990--2004. However, APCs, reflecting a decline in death rates, differed by 60% between Hispanics and non-Hispanics: 1.0% per year for Hispanics compared with 1.6% per year for non-Hispanics. Statistical analysis with joinpoint regression revealed that the death rate for whites remained stable during 1990--1992 (p = 0.77), declined significantly during 1992--1996 by 4.3% per year (p = 0.001), and then stabilized again during 1996--2004 (p = 0.07) (Figure 2). Death rates for blacks and A/PIs declined significantly, both by 1.6% per year (p<0.001 for blacks and p = 0.003 for A/PIs). Death rates for AI/ANs were stable during 1990--2004 (p = 0.18); this trend might be attributed to the small numbers available for analysis in this population. Regression analysis also revealed that the death rate for Hispanics remained stable during 1990--1992 (p = 0.53), declined significantly during 1992--1998 by 4.3% per year (p = 0.01), and then stabilized during 1998--2001 (p = 0.32) and during 2001--2004 (p = 0.57); the death rate for non-Hispanics declined significantly during 1990--1996 by 2.6% per year (p<0.001) and 1996--2004 by 0.9% per year (p = 0.009) (Figure 2). Death rates did not decrease equally in all regions** during 1990--2004: 2.1% per year in the Midwest, 1.8% per year in the South and Northeast, and 1.4% per year in the West (Table). For all cancers combined, children and adolescents living in the West (31.1 per million) had significantly higher death rates than those living in the Midwest (29.1), the Northeast (28.4), and the South (29.8), respectively (Table). Reported by: LA Pollack, MD, SL Stewart, PhD, TD Thompson, Div of Cancer Prevention and Control, National Center for Chronic Disease Prevention and Health Promotion; J Li, MD, EIS Officer, CDC. Editorial Note:The findings in this report indicate that, during 1990--2004, overall childhood cancer death rates declined significantly among boys and girls, children and adolescents, Hispanics and non-Hispanics, most racial groups, and all U.S. Census regions. Incidence rates for all childhood cancers increased by 0.6% per year during 1975--2002 (6). The overall decreasing trend in childhood cancer mortality in the United States likely reflects advances in cancer treatment in this population (3). Acute lymphocytic leukemia accounts for approximately 73% of childhood leukemia cases (1). Likely because of advances in treatment, such as chemotherapy and bone marrow transplantation, substantial improvement has occurred in survival rates for children and adolescents with acute lymphocytic leukemia (7). In this analysis, death rates declined substantially for childhood leukemias during 1990--2004, which is consistent with findings from previous trend analyses for the period 1975--1995 (3). For brain and other nervous system neoplasms, death rates declined significantly during 1990--2004. Five-year relative survival rates for brain and other nervous system neoplasms also have improved (1,7). The results of this analysis indicate geographic disparities in childhood cancer death rates. During 1990--2004, childhood cancer death rates in the West were the highest among all U.S. Census regions and were the slowest to decline. The causes of these disparities cannot be determined based on the data available and need to be explored by further studies, including cancer survival studies. Moreover, variations by ethnicity were observed. Hispanics and non-Hispanics had similar childhood cancer death rates in 1990, but these rates declined more rapidly for non-Hispanics than for Hispanics during 1990--2004. Studies have documented that Hispanics lack sufficient access to health-care services because of inadequate heath-insurance coverage, lack of health insurance, poor geographic access to health-care providers, lack of transportation to and from providers, and cultural and linguistic barriers (8), which might contribute to this disparity. However, differences in tumor aggressiveness, cancer stage at diagnosis, and response to treatment also should be considered. The findings in this report are subject to at least five limitations. First, the reporting of race/ethnicity to the U.S. Bureau of the Census and on death certificates usually is reliable for blacks and whites; however, death rates for American Indians, A/PIs, and Hispanics are underestimated by 21%, 11%, and 2%, respectively (9). Second, the ability to stratify death rates for each primary cancer site/leading diagnosis by demographic and geographic variables and to assess the geographic variation at the state or county level was limited because of low death counts. Third, causes of death might be misclassified on death certificates. Fourth, using the 2000 U.S. standard population for all study years might not reflect actual annual population. Finally, cancer deaths among boys and girls who had cancer diagnosed as children but who died as adolescents are reflected in adolescent mortality rates. Thus, the mortality rates of adolescents might reflect the improved survival of children with cancer. The overall trend of declining childhood cancer mortality during 1990--2004 likely reflects better treatment of childhood cancer. Surveillance of childhood cancer mortality should be well maintained to monitor the persistence of these declines. Possible causes for disparities in childhood cancer death rates (e.g., lack of health insurance, difficulty in accessing health care, late diagnosis, poor treatment quality, and unhealthy behaviors and lifestyles) need to be studied further. By addressing these factors, geographic and ethnic disparities in childhood cancer death might be reduced, and children with cancer might live longer. CDC maintains the National Program of Cancer Registries, which monitors cancer rates and trends. CDC also is working in partnership with organizations (e.g., the Lance Armstrong Foundation) to educate childhood cancer survivors, their families, and their health-care providers to recognize long-term effects associated with cancer treatment. These measures aim to enhance quality of life and increase survival. References
* Additional information regarding NVSS is available at http://www.cdc.gov/nchs/nvss.htm. † Additional information regarding the SEER program is available at http://seer.cancer.gov. § Based on International Classification of Diseases, Tenth Revision codes for leukemias (C91.0--C91.4, C91.7, C91.9, C92.0--C92.5, C92.7, C92.9, C93.0--C93.2, C93.7, C93.9, C94.0, C94.2, C94.4, C94.5, and C95.0) and brain and other nervous system neoplasms (C70--C72). ¶ Additional information regarding SEER-Stat is available at http://seer.cancer.gov/seerstat. ** Northeast: Connecticut, Maine, Massachusetts, New Hampshire, New Jersey, New York, Pennsylvania, Rhode Island, and Vermont. Midwest: Illinois, Indiana, Iowa, Kansas, Michigan, Minnesota, Missouri, Nebraska, North Dakota, Ohio, South Dakota, and Wisconsin. South: Alabama, Arkansas, Delaware, District of Columbia, Florida, Georgia, Kentucky, Louisiana, Maryland, Mississippi, North Carolina, Oklahoma, South Carolina, Tennessee, Texas, Virginia, and West Virginia. West: Alaska, Arizona, California, Colorado, Hawaii, Idaho, Montana, Nevada, New Mexico, Oregon, Utah, Washington, and Wyoming.
Figure 1
Disclaimer All MMWR HTML versions of articles are electronic conversions from ASCII text into HTML. This conversion may have resulted in character translation or format errors in the HTML version. Users should not rely on this HTML document, but are referred to the electronic PDF version and/or the original MMWR paper copy for the official text, figures, and tables. An original paper copy of this issue can be obtained from the Superintendent of Documents, U.S. Government Printing Office (GPO), Washington, DC 20402-9371; telephone: (202) 512-1800. Contact GPO for current prices. **Questions or messages regarding errors in formatting should be addressed to mmwrq@cdc.gov.Date last reviewed: 12/5/2007 |
|||||||||
|