 |
|
|
|
|
|
|
| ||||||||||
|
|
|
|
|
|
|
||||
| ||||||||||
|
|
|
|
|
Persons using assistive technology might not be able to fully access information in this file. For assistance, please send e-mail to: mmwrq@cdc.gov. Type 508 Accommodation and the title of the report in the subject line of e-mail. Summary of Notifiable Diseases, United States, 1998The following CDC staff members contributed to this report: Samuel L. Groseclose, D.V.M., M.P.H. in collaboration with J. Javier Aponte David A. Nitschke
PrefaceThe MMWR Summary of Notifiable Diseases, United States, 1998 contains summary tables of the official statistics for the reported occurrence of nationally notifiable diseases in the United States for 1998. These statistics are collected and compiled from reports to the National Notifiable Diseases Surveillance System (NNDSS), which is operated by CDC in collaboration with the Council of State and Territorial Epidemiologists (CSTE). Because the dates of onset or diagnosis for notifiable diseases are not always reported, these surveillance data are presented by the week they were reported to CDC by public health officials in state and territorial health departments. These data are finalized and published each year in the MMWR Summary of Notifiable Diseases, United States for use by state and local health departments; schools of medicine and public health; communications media; local, state, and federal agencies; and other agencies or persons interested in following the trends of reportable diseases in the United States. This publication also documents which diseases are considered national priorities for notification and the annual number of cases of such diseases. The Highlights section presents information on selected nationally notifiable and non-notifiable diseases to provide a context in which to interpret surveillance and disease-trend data and to provide further information on the epidemiology and prevention of selected diseases. Part 1 contains tables that present morbidity for each of the diseases considered nationally notifiable during 1998.* The tables provide the number of cases of notifiable diseases reported to CDC for 1998, as well as the distribution of cases by month and geographic location and by patient's age, sex, race, and Hispanic ethnicity. The data are final totals as of August 13, 1999, unless otherwise noted. Nationally notifiable diseases that are reportable in fewer than 40 states also do not appear in these tables. In all tables, leprosy is listed as Hansen disease, and tickborne typhus fever is listed as Rocky Mountain spotted fever (RMSF). Part 2 contains graphs and maps. These graphs and maps depict summary data for many of the notifiable diseases described in tabular form in Part 1. Part 3 contains tables that list the number of cases of notifiable diseases reported to CDC since 1967. This section also includes a table enumerating deaths associated with specified notifiable diseases reported to the National Center for Health Statistics (NCHS), CDC, during 1988-1997. The Bibliography section presents general and disease-specific references pertaining to the notifiable infectious diseases. These references provide additional information on surveillance and epidemiologic issues, diagnostic issues, or disease control activities. ------------------- * Because no cases of anthrax, western equine encephalitis, or yellow fever were reported in the United States during 1998, these diseases do not appear in the tables in Part 1.
BackgroundAs of January 1, 1998, a total of 52 infectious diseases were designated as notifiable at the national level. A notifiable disease is one for which regular, frequent, and timely information regarding individual cases is considered necessary for the prevention and control of the disease. This section briefly summarizes the history of the reporting of nationally notifiable diseases in the United States. In 1878, Congress authorized the U.S. Marine Hospital Service (i.e., the forerunner of the Public Health Service [PHS]) to collect morbidity reports regarding cholera, smallpox, plague, and yellow fever from U.S. consuls overseas. The intention was to use this information to institute quarantine measures to prevent the introduction and spread of these diseases into the United States. In 1879, a specific Congressional appropriation was made for the collection and publication of reports of these notifiable diseases. Congress expanded the authority for weekly reporting and publication of these reports in 1893 to include data from states and municipal authorities. To increase the uniformity of the data, Congress enacted a law in 1902 directing the Surgeon General to provide forms for the collection and compilation of data and for the publication of reports at the national level. In 1912, state and territorial health authorities -- in conjunction with PHS -- recommended immediate telegraphic reporting of five infectious diseases and the monthly reporting, by letter, of 10 additional diseases. The first annual summary of The Notifiable Diseases in 1912 included reports of 10 diseases from 19 states, the District of Columbia, and Hawaii. By 1928, all states, the District of Columbia, Hawaii, and Puerto Rico were participating in national reporting of 29 specified diseases. At their annual meeting in 1950, state and territorial health officers authorized the Council of State and Territorial Epidemiologists (CSTE) to determine which diseases should be reported to PHS. In 1961, CDC assumed responsibility for the collection and publication of data concerning nationally notifiable diseases. The list of nationally notifiable diseases is revised periodically. For example, a disease might be added to the list as a new pathogen emerges, or a disease might be deleted as its incidence declines. Public health officials at state health departments and CDC continue to collaborate in determining which diseases should be nationally notifiable. CSTE, with input from CDC, makes recommendations annually for additions and deletions. However, state reporting of nationally notifiable diseases to CDC is voluntary. Reporting currently is mandated (i.e., by legislation or regulation) only at the state and local level. Thus, the list of diseases considered notifiable varies slightly by state. All states generally report the internationally quarantinable diseases (i.e., cholera, plague, and yellow fever) in compliance with the World Health Organization's International Health Regulations. The list of 52 infectious diseases designated as notifiable at the national level during 1998 is as follows: The 52 Infectious Diseases Designated as Notifiable at the National Level During 1998 Acquired immunodeficiency syndrome (AIDS) ------------------- * Not currently published in MMWR weekly tables. Note: Although varicella (chickenpox) is not a nationally notifiable disease, the Council of State and Territorial Epidemiologists recommends reporting cases of this disease to CDC.
Data SourcesProvisional data concerning the reported occurrence of notifiable diseases are published weekly in MMWR. After each reporting year, staff in state health departments finalize reports of cases for that year with local or county health departments and reconcile the data with reports previously sent to CDC throughout the year. These data are compiled in final form in the MMWR Summary of Notifiable Diseases, United States. Notifiable disease reports are the authoritative and archival counts of cases. They must be approved by the appropriate epidemiologist from each submitting state or territory before being published in the MMWR Summary of Notifiable Diseases, United States. Although useful for detailed epidemiologic analyses, data published in MMWR Surveillance Summaries or other surveillance reports produced by CDC programs might not agree exactly with data reported in the annual summary because of differences in the timing of reports, the source of the data, and the case definitions. Data in the MMWR Summary of Notifiable Diseases, United States were derived primarily from reports transmitted to the Division of Public Health Surveillance and Informatics, Epidemiology Program Office, CDC, from health departments in the 50 states, five territories, New York City, and the District of Columbia through the National Electronic Telecommunications System for Surveillance (NETSS). More information regarding NETSS and notifiable diseases, including case definitions for these conditions, is available on the Internet at http://www.cdc.gov/epo/phs.htm. Policies for reporting notifiable disease cases can vary by disease or reporting jurisdiction, depending on case status classification (i.e., confirmed, probable, or suspect).Final data for selected diseases (presented in Parts 1, 2, and 3) are from the surveillance records of the CDC programs listed below. Requests for further information regarding these data should be directed to the appropriate program.
Office of Vital and Health Statistics Systems (deaths from selected notifiable diseases). National Center for Infectious Diseases (NCID) Division of Bacterial and Mycotic Diseases (toxic-shock syndrome; Streptococcal disease, invasive, group A; Streptococcal toxic-shock syndrome; and laboratory data regarding botulism, Escherichia coli O157:H7, salmonellosis, and shigellosis). Division of Vector-Borne Infectious Diseases (laboratory data regarding arboviral encephalitis). Division of Viral and Rickettsial Diseases (animal rabies; Hantavirus pulmonary syndrome). National Center for HIV, STD, and TB Prevention (NCHSTP) Division of HIV/AIDS Prevention -- Surveillance and Epidemiology (acquired immunodeficiency syndrome [AIDS]). Division of Sexually Transmitted Diseases Prevention (chancroid, chlamydia, gonorrhea, and syphilis). Division of Tuberculosis Elimination (tuberculosis). National Immunization Program (NIP) Epidemiology and Surveillance Division (poliomyelitis). Disease totals for the United States, unless otherwise stated, do not include data for American Samoa, Guam, Puerto Rico, the Virgin Islands, or the Commonwealth of the Northern Mariana Islands (CNMI). Disease totals from American Samoa, CNMI, and the Virgin Islands were unavailable for 1998. Population estimates for the states are from the July 1, 1998, estimates from the Bureau of the Census* (Internet release number ST-98-1. December 31, 1998). Population numbers for territories are 1997 estimates from the Bureau of the Census (Press release numbers CB98-54 and CB98-80). Population numbers used to calculate rates for age and sex are from July 1, 1998, estimates from the Bureau of Census (Internet release. June 15, 1999). More information regarding census estimates is available at http://www.census.gov. Rates in the MMWR Summary of Notifiable Diseases, United States are presented as incidence rates per 100,000 population, based on data for the U.S. total-resident population. However, population data from states in which diseases were not notifiable or disease data were not available were excluded from rate calculations. Interpreting Data The data reported in the MMWR Summary of Notifiable Diseases, United States are useful for analyzing disease trends and determining relative disease burdens. However, these data must be interpreted in light of reporting practices. Some diseases that cause severe clinical illness (e.g., plague and rabies) are most likely reported accurately, if they were diagnosed by a clinician. However, persons who have diseases that are clinically mild and infrequently associated with serious consequences (e.g., salmonellosis) might not seek medical care from a health-care provider. Even if these less severe diseases are diagnosed, they are less likely to be reported. The degree of completeness of data reporting also is influenced by the diagnostic facilities available; the control measures in effect; the public awareness of a specific disease; and the interests, resources, and the priorities of state and local officials responsible for disease control and public health surveillance. Finally, factors such as changes in the case definitions for public health surveillance, the introduction of new diagnostic tests, or the discovery of new disease entities can cause changes in disease reporting that are independent of the true incidence of disease. Public health surveillance data are published for selected racial and ethnic population groups because these variables can be risk markers for certain notifiable diseases. Risk markers can identify potential risk factors for investigation in future studies. Race/ethnicity data also can be used to target populations for prevention efforts. However, caution must be used when drawing conclusions from reported race/ethnicity data. Certain races and ethnicities have differential patterns of access to health care, interest in seeking health care, and detection of disease, potentially resulting in data that are not representative of disease incidence in these populations. In addition, not all race/ethnicity data are collected uniformly for all diseases. For example, in NCHSTP, the Division of HIV/AIDS Prevention -- Surveillance and Epidemiology and the Division of Sexually Transmitted Diseases Prevention collect race/ethnicity data using a single variable. A person's race/ethnicity is reported as American Indian/Alaskan Native, Asian/Pacific Islander, black non-Hispanic, white non-Hispanic, or Hispanic. Additionally, although the recommended standard for classifying a person's race or ethnicity is based on self-reporting, this procedure might not always be followed. ------------------- * Population Distribution Branch, Population Division of the Bureau of Census, which is under the Economics and Statistics Administration, U.S. Department of Commerce.
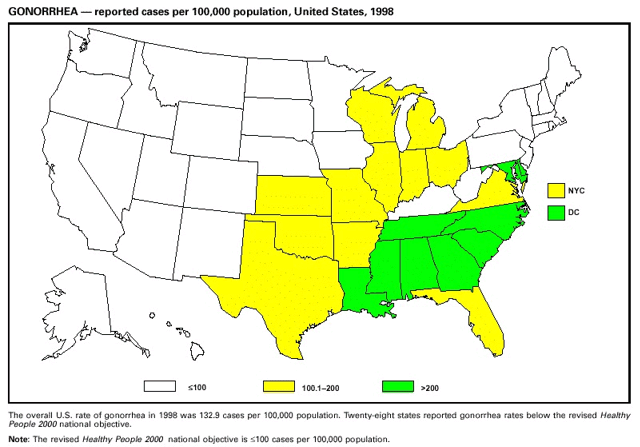
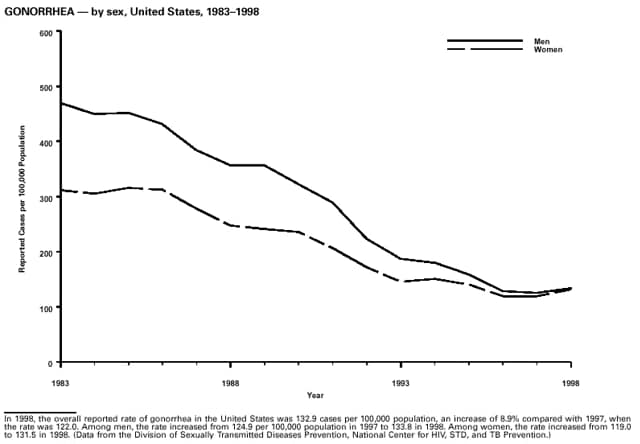
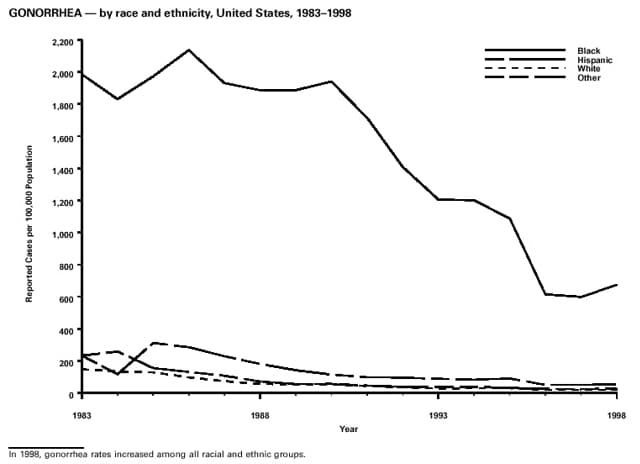
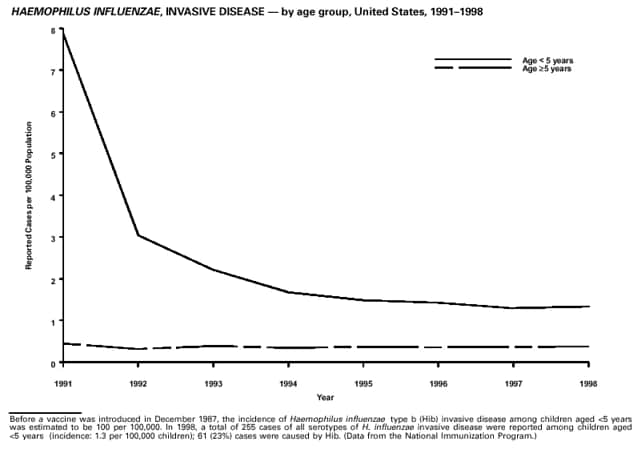
Highlights for 1998The Highlights section presents information on the public health importance of selected nationally notifiable and non-notifiable diseases, including a) domestic and international disease outbreaks, b) active surveillance findings, c) changes in data reporting practices, d) the impact of prevention programs, e) the emergence of antimicrobial resistance, and f) changes in immunization policies. This information is intended to provide a context in which to interpret surveillance and disease-trend data and to provide further information on the epidemiology and prevention of selected diseases. Highlights for Selected Nationally Notifiable Diseases Chancroid In 1998, a total of 189 cases of chancroid were reported to CDC, for a rate of 0.07 cases/100,000 population. The number of cases reported in 1998 reflects a 23% decline from 1997 and a continuing decline since 1987. However, chancroid is difficult to culture and could be substantially underdiagnosed. Several studies that have used DNA amplification tests (which are not commercially available) have identified this infection in cities where it was previously undetected. Chlamydia trachomatis, Genital Infection In 1998, a total of 604,420 cases of genital chlamydial infection were reported to CDC, for a rate of 236.57 cases/100,000 population. This is the highest rate of chlamydial infection reported to CDC since cases were first voluntarily reported to the National Center for HIV, STD, and TB Prevention's Division of STD Prevention in the mid-1980s. It is also the highest rate since chlamydia became a nationally notifiable disease in 1995. This increase reflects the continued expansion of chlamydia screening programs and the increased use of more sensitive diagnostic tests for this condition. During the same period, data on chlamydia prevalence obtained by monitoring seropositivity rates of persons screened in different clinic settings have consistently documented declining levels of infection in many parts of the United States (Sexually transmitted disease surveillance 1998. US Department of Health and Human Services, CDC, September 1999). Cryptosporidiosis National reporting for cryptosporidiosis began in 1995. During 1995-1998, a total of 11,612 cases were reported from 47 states, with an annual median of 2,900 cases per year (range: 2,566-3,793). Because the diagnosis of cryptosporidiosis is often not considered, and because laboratories do not routinely test stool specimens for cryptosporidiosis infection, this disease continues to be underdiagnosed and under-reported. Diphtheria One probable case of diphtheria was reported from Oregon in 1998. The case-patient had acute membranous pharyngitis. An oropharyngeal specimen was weakly positive for diphtheria toxin by polymerase chain reaction, but bacterial culture of the specimen was negative. Outside the United States, more than 2,700 cases of diphtheria were reported in an epidemic in the Newly Independent States of the former Soviet Union (Dittmann S, Wharton M, Vitek C, et al. Successful control of epidemic diphtheria in the Newly Independent States of the Former Soviet Union: lessons learned in fighting public health emergencies. J Infect Dis 2000 [in press]). This epidemic has resulted in approximately 155,000 cases and 5,000 deaths since 1990. No importations into the United States were reported in 1998. Gonorrhea In 1998, a total of 355,642 cases of gonorrhea were reported to CDC, for a rate of 132.88/100,000 population. This was an 8.9% increase from the 1997 rate and the first increase since 1985. The 1998 increase was reported in all demographic groups defined by age, sex, and race/ethnicity, and it occurred in all major geographic regions except the Northeast. Possible reasons for this trend include expansion of screening programs (motivated by the availability of simultaneous testing for genital chlamydial infections), increased use of new diagnostic tests with improved sensitivity, improvements in surveillance systems, and true increases in morbidity. Haemophilus influenzae, Invasive Disease In 1998, a total of 255 cases of Haemophilus influenzae (Hi) invasive disease among children aged less than 5 years were reported (data were provided by the National Immunization Program and were based on date of onset, not MMWR week). Before a vaccine was introduced in 1987, approximately 20,000 cases of H. influenzae type b (Hib) invasive disease occurred among children annually (JAMA 1993;269:221-6). The sharp decline in the number of Hib cases is attributed to the widespread use of the Hib vaccine among preschool-aged children. Of the 255 cases reported in 1998, a total of 197 (74%) Hi isolates were serotyped, and 61 (31%) of these were type b. Among the 61 cases of Hib invasive disease reported in children aged less than 5 years, 25 (41%) were among children aged less than 6 months, which is too young to have completed a three-dose primary Hib vaccination. However, 22 (61%) of the 36 children who were old enough (i.e., aged greater than or equal to 6 months) to have completed a three-dose primary series were incompletely vaccinated or their vaccination status was unknown. These cases might have been prevented with age-appropriate vaccination. Hantavirus Pulmonary Syndrome In 1998, a total of 30 cases of hantavirus pulmonary syndrome (HPS) reported from 12 states were confirmed by CDC. Nine (30%) cases were fatal. HPS is caused by several hantaviruses in the western hemisphere and has also been reported in Canada, Argentina, Paraguay, Brazil, Uruguay, Chile, and Bolivia. Most HPS in the United States is caused by Sin Nombre virus. Other hantaviruses associated with human disease in the United States include Bayou, Black Creek Canal, New York, and Monongahela. Most hantaviruses have specific rodent reservoirs of the family Muridae. The virus is shed in rodent urine, feces, and saliva, then transmitted via inhalation. Hemolytic Uremic Syndrome, Postdiarrheal Postdiarrheal hemolytic uremic syndrome (HUS) is a life-threatening illness characterized by hemolytic anemia, thrombocytopenia, and renal injury. In the United States, most cases are caused by infection with Escherichia coli O157:H7 or other Shiga toxin-producing E. coli. In 1998, the third year of national reporting, 17 states reported 90 cases of postdiarrheal HUS to CDC. By comparison, 20 states reported 93 cases in 1997, and 18 states reported 104 cases in 1996. The median age of patients was 5 years (range: less than 1-87 years), and 53% of patients were female. Illness was seasonal, with 59% of cases occurring during June through September. Hepatitis A In 1999, the Advisory Committee on Immunization Practices (ACIP) issued revised recommendations for the use of hepatitis A vaccine (HepA). Routine childhood HepA vaccination is recommended in states or counties/communities where the average annual hepatitis A virus (HAV) rate during 1987-1997 was approximately 20 cases 100,000 population (i.e., approximately twice the national average). In addition, routine childhood HepA vaccination can be considered in states or counties/communities where the average rate during 1987-1997 was at least 10 cases/100,000 population. Of the 23,229 cases of HAV reported in 1998, approximately 60% originated from the 17 states affected by the ACIP recommendations. Eleven of these states had average rates of approximately 20 cases/100,000 persons during 1987-1997, and six states had average rates of approximately 10/100,000 during this period. However, these 17 states account for only 34% of the U.S. population. Hepatitis B The number of reported acute hepatitis B cases has decreased by more than 50% during the past decade, from 21,102 cases in 1990 to 10,258 cases in 1998. This downward trend is expected to continue as a national strategy for eliminating hepatitis B virus (HBV) transmission is implemented. Components of this strategy include a) screening pregnant women for hepatitis B surface antigen (HBsAg) and providing postexposure immunoprophylaxis to infants of infected women; b) routinely vaccinating infants; c) providing catch-up vaccinations for children aged less than 19 years (particularly those aged 11-12 years); and d) targeting vaccinations to children, adolescents, and adults at increased risk for infection. Draft Healthy People 2010 objectives emphasize the elimination of HBV transmission and include reducing the number of perinatal HBV infections to less than 400 and reducing the number of acute hepatitis B cases in persons aged 2-18 years to less than 10. Proposed age-specific target rates per 100,000 population for persons aged greater than 18 years are as follows: 3.2 cases/100,000 for persons aged 19-24 years, 11.1/100,000 for persons aged 25-39 years, and 1.0/100,000 for persons aged greater than or equal to 40 years. Hepatitis C Hepatitis C virus (HCV) infection is the most common chronic bloodborne infection in the United States (MMWR 1998;47[RR-19]). Based on data from CDC's sentinel counties viral hepatitis surveillance system, approximately 242,000 new HCV infections occurred each year during the 1980s. Since 1989, the annual number of new infections identified in the sentenial counties has declined by 80%. For reasons that are unclear, this dramatic decline correlates with a decrease in cases among injecting-drug users (MMWR 1998;47[RR-19]). But in 1996, data from the Third National Health and Nutrition Examination Survey (1988-1994) indicated that approximately 4 million Americans (1.8%) have been infected with HCV. Most are chronically infected, although the majority might be unaware of their infection because they are not clinically ill. Chronically infected persons can transmit the virus to others and are at risk for chronic liver disease, including cirrhosis and liver cancer. CDC guidelines for prevention and control of HCV infection and HCV-related chronic disease were published in October 1998 (MMWR 1998;47[RR-19]). The U.S. Food and Drug Administration also issued guidance in 1998 requiring the notification of persons who received blood or blood products before July 1992 from donors subsequently found to be infected with HCV. In May 1999, a national campaign was initiated to educate the public about hepatitis C and the need for persons at increased risk to be tested. These recommendations and activities are expected to increase the number of HCV-infected persons identified and reported to state and local health departments. HIV Infection, Pediatric In 1998, reports based on acquired immunodeficiency syndrome (AIDS) surveillance data indicated continued, substantial declines in perinatally acquired AIDS, reflecting declining perinatal human immunodeficiency virus (HIV) transmission. HIV surveillance data indicated that the increasing use of zidovudine was temporally associated with this decline (MMWR 1997;46:1086-92 and CDC. HIV/AIDS surveillance report. Atlanta, GA: US Department of Health and Human Services, 1998:36. [Vol. 10, no. 2]). These data demonstrate success in nationwide efforts to implement Public Health Service (PHS) guidelines for routine, voluntary prenatal HIV testing (MMWR 1995;44[No. RR-7] and MMWR 1998;47:688-91 and MMWR 1999;48:401-4) and the use of zidovudine to reduce perinatal HIV transmission (MMWR 1994;43[No. RR-11] and MMWR 1998;47[No. RR-2]). States that conduct surveillance of perinatally exposed and infected children aged less than 13 years can evaluate the impact of the guidelines and document resources needed to care for perinatally exposed infants. In 1998, a total of 32 states conducted surveillance of HIV infection among children, reporting 309 HIV-infected children whose infection had not progressed to AIDS and 143 children who had AIDS. These states also received 2,433 new reports of perinatally exposed children who required follow up with health-care providers to determine their HIV infection status. Lyme Disease In 1998, a total of 16,801 cases of Lyme disease were reported, the highest number ever reported. This increase could be caused by an increase in human contact with infected ticks and enhanced reporting of cases. Lyme disease occurs primarily in the northeastern and northcentral United States. The following nine states had incidence rates higher than the annual national average of 6.39 cases/100,000 population and accounted for 93.0% of reported cases: Connecticut (105.0/100,000), Rhode Island (79.6), New York (25.5), New Jersey (24.0), Pennsylvania (22.9), Maryland (13.1), Massachusetts (11.5), Wisconsin (12.8), and Delaware (10.7). In December 1998, a new Lyme disease vaccine was approved by the U.S. Food and Drug Administration. The Advisory Committee on Immunization Practices issued recommendations for use of this vaccine in June 1999 (MMWR 1999;48 [No. RR-7]). These recommendations emphasize that the decision to vaccinate should be based on both geographic risk and individual exposure to tick-infested habitats. Because the Lyme disease vaccine is not 100% effective and does not protect against transmission of other tickborne diseases, vaccinated persons should continue to practice personal protective measures against ticks and seek early diagnosis and treatment of suspected tickborne infections. Pertussis On July 29, 1998, the fourth diphtheria and tetanus toxoids and acellular pertussis vaccine (DTaP) was licensed for use in children aged 6 weeks-6 years. This vaccine is called Certiva,TM and it is manufactured by North American Vaccine, Inc. Other DTaP vaccines licensed since 1996 include Tripedia® (Connaught Laboratories, Inc.), ACEL-IMUNE® (Lederle Laboratories Division of American Cyanamid Company), and Infanrix® (SmithKline Beecham Pharmaceuticals). The Advisory Committee on Immunization Practices recommends DTaP vaccines for all five doses in the childhood vaccination schedule. Since 1980, the number of reported cases of pertussis has increased in the United States. The reasons for this rise are unknown, but could include increased awareness of pertussis among health-care providers, increased use of more sensitive diagnostic tests, and better reporting of cases to health departments. In 1998, a total of 24% of 7,405 reported cases occurred among children aged less than 7 months, who were too young to have received the recommended three doses of pertussis vaccine. Thirteen percent of cases were among preschool-aged children (i.e., those aged 1-4 years). Since 1995, the coverage rate with at least three doses of pertussis vaccine has been 95% among U.S. children aged 19-35 months. Twenty-six percent of cases were reported among children aged 10-19 years. Because vaccine-induced immunity wanes approximately 5-10 years after pertussis vaccination, adolescents can become susceptible to disease. Since 1990, the incidence among preschool-aged children has not changed, but the incidence among adolescents has increased in some states (Clin Inf Dis 1999;28:1230-7). Plague In 1998, nine cases of plague among humans were reported in the United States (six cases in New Mexico, one in Arizona, one in California, and one in Colorado). None were fatal. Of the 360 cases that occurred during 1970-1998, approximately 80% were reported from the southwestern states of New Mexico, Arizona, and Colorado. Nine percent occurred in California, and limited numbers of cases were reported from nine other western states. Yersinia pestis was recently designated as a potential agent of biological terrorism (see page xvi). In recognition of this potential threat, CDC is collaborating with other public health and federal agencies to develop guidelines for responding to bioterrorism events involving Y. pestis. Also in 1998, CDC was informed that Greer Laboratories, Inc., was ceasing production of the only plague vaccine commercially available in the United States. This vaccine has a limited shelf life, and no remaining stockpiles exist. Poliomyelitis, Paralytic As of January 1999, the Advisory Committee on Immunization Practices recommends only inactivated polio vaccine (IPV) for the first two doses of the polio vaccination series. Distribution of IPV as a proportion of overall polio vaccine use has increased from 6% in 1996 to 29% in 1997 to 34% in 1998. All six cases of vaccine-associated polio reported in the United States since January 1997 (including the single case reported in 1998) were associated with receipt of trivalent oral polio vaccine (OPV) for the first or second dose in an all-OPV schedule. An all-IPV schedule is recommended for routine childhood vaccination beginning January 1, 2000. St. Louis Encephalitis A summertime epidemic of St. Louis encephalitis in southern Louisiana accounted for 18 of the 24 cases reported nationally. No cases were fatal. Culex pipiens quinquefasciatus was presumed to be the primary mosquito vector. The last major epidemic of St. Louis encephalitis in the United States (223 cases and 11 deaths) occurred in Florida in 1990. This disease occurs in portions of both the eastern and western United States. Streptococcal Disease, Invasive, Group A Nationally, approximately 10,200 cases of invasive group A streptococcal disease and 1,300 deaths occurred in 1998, according to reports from the Active Bacterial Core Surveillance (ABCS) project under CDC's Emerging Infectious Diseases Program, which operates in seven states (California, Connecticut, Georgia, Maryland, Minnesota, New York, and Oregon). The incidence of this disease during 1998 was 3.8 cases/100,000 population. Rates were highest among children aged less than 1 year (7.5 cases/100,000) and adults aged greater than or equal to 65 years (10.0/100,000). Streptococcal toxic shock syndrome and necrotizing fasciitis each accounted for approximately 5.1% of invasive cases. The overall case-fatality rate among patients with invasive group A streptococcal disease was 12.2%. Streptococcus pneumoniae, Drug-Resistant During 1998, the Active Bacterial Core Surveillance (ABCS) project of CDC's Emerging Infectious Diseases Program collected information on invasive pneumococcal disease, including drug-resistant Streptococcus pneumoniae, in eight states -- California, Connecticut, Georgia, Maryland, Minnesota, New York, Oregon, and Tennessee. Of 3,335 S. pneumoniae isolates collected during 1998, a total of 10.2% exhibited intermediate penicillin resistance (minimum inhibitory concentration [MIC] 0.1-1 ug/mL), and 13.6% were resistant (MIC greater than or equal to 2 ug/mL). For cefotaxime, 7.7% of all isolates had intermediate resistance (MIC 1 ug/mL), and 6.1% were resistant (MIC greater than or equal to 2 ug/mL). The proportion of isolates resistant to erythromycin was 14.7% (MIC greater than or equal to 2 ug/mL). The overall proportions of isolates that were not susceptible to these three drugs were not substantially different compared with 1997 data. However, the proportions that were resistant varied widely among surveillance sites in 1998, and an increase in the prevalence of resistant strains, compared with earlier years, was reported from some states (data available at http://www.cdc.gov/ncidod/dbmd/abcs/survreports.htm). Syphilis, Congenital In 1998, a total of 801 cases of congenital syphilis were reported to CDC, for a rate of 20.6/100,000 live births. Like primary and secondary syphilis, the rate of congenital syphilis has declined sharply in recent years, from a peak of 107.3 cases/100,000 live births in 1991. Congenital syphilis persists in the United States because of the substantial number of women who do not receive syphilis serologic testing during pregnancy or who receive this testing too late in their pregnancy. This lack of screening is often related to a lack of prenatal care or late prenatal care (Am J Public Health 1999;89:557-60). Syphilis, Primary and Secondary In 1998, a total of 6,993 primary and secondary syphilis cases were reported to CDC. During 1990-1998, the primary and secondary syphilis rate declined 86%, from 20.3 cases/100,000 population to 2.6/100,000 -- the lowest level since reporting began in 1941. Although syphilis has declined in all regions of the United States and in all racial/ethnic groups, rates remain disproportionately high in the South and among non-Hispanic blacks, and focal outbreaks continue to occur. Tetanus The first case of neonatal tetanus reported in the United States since 1995 was reported from Montana in 1998. The case occurred in an infant born to a mother who was not immunized because of her philosophic beliefs and who used a nonsterile bentonite clay recommended by a lay midwife for the care of the baby's umbilical cord. The infant recovered after a 3-week hospitalization, including 12 days of mechanical ventilation. Of the 41 cases of tetanus that occurred in 1998, a total of 16 (39%) were among persons aged greater than or equal to 60 years, and 16 (39%) were among persons aged 20-59 years.
Highlights for Selected Non-Notifiable DiseasesCyclosporiasis In recent years, multiple foodborne outbreaks of cyclosporiasis linked to various types of fresh produce (i.e., mesclun lettuce, basil, and Guatemalan raspberries) have occurred in the United States. In Spring 1998, Canada allowed importation of fresh Guatemalan raspberries, which resulted in a cyclosporiasis outbreak. The United States did not allow importation and thus, did not have an outbreak associated with raspberries (MMWR 1998;47:806-9). Dengue In 1998, a total of 90 confirmed or probable cases of dengue were imported into the United States and diagnosed in CDC's Dengue Branch. One case in a man aged 65 years was fatal. The number of cases reported in 1998 is higher than the 56 confirmed or probable cases reported in 1997. No indigenous cases were reported in the United States. Also in 1998, the preliminary number of dengue and dengue hemorrhagic fever (DHF) cases reported by Pan American Health Organization member countries (741,794, of which 535,388 were reported by Brazil) was more than twice the total for 1997 (364,945). In addition, cases of dengue-3 were reported from islands in the Caribbean for the first time after a 20-year absence. Hurricanes Georges (September 1998) and Mitch (October-November 1998) did not cause acute changes in dengue incidence in the affected areas, except for brief interruptions in disease surveillance systems. HIV Infection in Adults In June 1997, reporting of human immunodeficiency virus (HIV) infection among adults (i.e., persons aged greater than or equal to 13 years) was added to the list of nationally notifiable diseases at the annual Council of State and Territorial Epidemiologists (CSTE) meeting. The revised surveillance case definition and associated recommendations become effective January 1, 2000 (MMWR 1999;48[RR-13]). As of December 31, 1998, a total of 29 states and the Virgin Islands had implemented confidential reporting of HIV among adolescents and adults as an extension of current surveillance for acquired immunodeficiency syndrome (AIDS). During 1998, reports based on AIDS data continued to highlight substantial declines in AIDS incidence and deaths. As a result of improvements in treatment and care of persons infected with HIV, surveillance of AIDS alone no longer accurately reflects the magnitude of the epidemic or trends in HIV transmission. Data concerning persons in whom HIV infection is diagnosed before AIDS is diagnosed are needed to determine populations that could benefit from prevention and treatment services. In its June 1997 statement, CSTE recommended that all states and territories implement confidential HIV infection reporting based on methods that provide accurate and representative data for all persons diagnosed confidentially. Streptococcal Disease, Invasive, Group B Efforts to prevent neonatal group B streptococcal (GBS) infections, a leading cause of bacterial disease and death among newborns in the United States, were supported by a 1996 release of consensus guidelines for the prevention of perinatal GBS disease. Adoption of a prevention policy at one hospital correlated with declines in neonatal GBS incidence (Am J Obstet Gynecol 1998:179:1568-71). In addition, surveillance areas with a high proportion of hospitals with GBS-prevention policies have a lower incidence of neonatal GBS disease (MMWR 1998;47:665-70). A recent multistate evaluation demonstrated that the proportion of hospitals with prevention policies increased from 39% in 1994 to 58% in 1997. Active surveillance during 1993-1995 in four U.S. areas (i.e., Maryland and select counties in California, Georgia, and Tennessee) demonstrated an overall 24% decline in newborn GBS disease, from 1.7 cases/1,000 live-born infants in 1993 to 1.3/1,000 in 1995. Surveillance data from these same sites in 1998 revealed a further decline of 54%, to 0.6 cases/1,000 live-born infants (MMWR 1997;46:473-7). Tularemia The reported incidence of tularemia in the United States continues to be low. Sporadic cases are primarily associated with handling infected animals or exposure to infected arthropods. Because of concerns that Francisella tularensis could be a potential bioterrrorist agent, tularemia will be reinstated as a nationally notifiable disease, effective January 2000 (see page xvi). Vancomycin-Resistant Enterococci Data regarding the magnitude and impact of vancomycin-resistant enterococci (VRE) in the United States are collected by CDC's National Nosocomial Infections Surveillance (NNIS) system, which includes more than 280 U.S. hospitals. During 1989-1998, the percentage of VRE isolated from patients with nosocomial infections in hospital intensive care units increased from 0.4% to 22.6%. The percentage of VRE isolated from patients with nosocomial infections in nonintensive care units increased from 0.3% to 21.2%. Although the differences between VRE rates by health-care setting have diminished, the overall rates of resistance for many nosocomial pathogens continue to rise and are highest among patients in intensive care units. Additional data are available at http://www.cdc.gov/ncidod/hip/SURVEILL/NNIS.HTM. Note: To print large tables and graphs users may have to change their printer settings to landscape and use a small font size. TABLE: Percentage of nosocomial enterococci reported as resistant to vancomycin, by health-care setting and year*
* N>2000 isolates for each year. Source: National Nosocomial Infections Surveillance (NNIS) system, Hospital Infections Program, National Center for Infectious Diseases, CDC Varicella Although varicella (chickenpox) deaths did not become nationally notifiable until January 1, 1999, some states began reporting varicella deaths to CDC during the second half of 1998. These data highlighted that both children and adults are continuing to die from a disease that is now vaccine-preventable. During 1998, national coverage for varicella vaccine among children aged 19-35 months was 43%. Efforts to increase vaccination of susceptible children, adolescents, and adults should include educating health-care providers that deaths and severe morbidity from varicella are preventable. Surveillance for Potential Bioterrorism Agents CDC established the Bioterrorism Preparedness and Response Program in January 1999 to improve the public health capability to detect and respond to biological and chemical terrorism. Members of this program are working with the FBI and other federal agencies to develop an organized and tiered response to suspect and confirmed biological events. The program focuses on state-level preparedness for early clinical and laboratory detection, which is essential to ensure a prompt response to a bioterrorist attack (e.g., providing prophylactic medicines or vaccines). Initial activities target critical agents that a) are associated with high case-fatality, b) can be disseminated to a large population, c) can cause social disruption because of public perception, and d) require special preparedness needs. These critical agents and their associated diseases include variola major (smallpox), Bacillus anthracis (anthrax), Yersinia pestis (plague), Francisella tularensis (tularemia), Clostridium botulinum (botulism), and the viral hemorrhagic fevers (e.g., arenaviruses and filoviruses). Several other agents have been identified but require less broad-based preparedness efforts, including ones that cause foodborne and waterborne diseases. A critical element for preparedness is defining the natural epidemiology of diseases that can be caused by critical agents, including anthrax and plague, which are nationally notifiable diseases. The last case of naturally occurring anthrax in the United States was reported in 1992. In 1998, a total of 9 cases of plague among humans were reported in the United States. Part 1: Summaries of Notifiable Diseases in the United States, 1998EXPLANATION OF SYMBOLS USED IN TABLES, GRAPHS, AND MAPS
Note: To print large tables and graphs users may have to change their printer settings to landscape and use a small font size. NOTIFIABLE DISEASES -- Summary of reported cases, by month, United States, 1998
* Total number of acquired immunodeficiency syndrome (AIDS) cases reported to the
Division of HIV/AIDS Prevention — Surveillance
and Epidemiology, National Center for HIV, STD, and TB Prevention (NCHSTP), as
of December 31, 1998.
Note: To print large tables and graphs users may have to change their printer settings to landscape and use a small font size. NOTIFIABLE DISEASES -- Reported cases, by geographic division and area--United States, 1998
* Total number of acquired immunodeficiency syndrome (AIDS) cases reported to the Division of HIV/AIDS Prevention -- Surveillance and Epidemiology, National Center for HIV, STD, and TB Prevention (NCHSTP), through December 31, 1998. NOTIFIABLE DISEASES -- Reported cases, by geographic division and area, United States, 1998 -- Continued
* Chlamydia refers to genital infections caused by C. trachomatis. Totals reported to the Division of Sexually Transmitted Diseases Prevention, NCHSTP, as of July 19, 1999. NOTIFIABLE DISEASES -- Reported cases, by geographic division and area, United States, 1998 -- Continued
* National Electronic Telecommunications System for Surveillance. NOTIFIABLE DISEASES -- Reported cases, by geographic division and area, United States, 1998 -- Continued
NOTIFIABLE DISEASES -- Reported cases, by geographic division and area, United States, 1998 -- Continued
* Imported cases include only those resulting from importation from other countries. NOTIFIABLE DISEASES -- Reported cases, by geographic division and area, United States, 1998 -- Continued
* Rocky Mountain spotted fever. NOTIFIABLE DISEASES -- Reported cases, by geographic division and area, United States, 1998 -- Continued
* Totals reported to the Division of Sexually Transmitted Diseases Prevention, NCHSTP, as of July 19, 1999. NOTIFIABLE DISEASES -- Reported cases, by geographic division and area, United States, 1998 -- Continued
* Totals reported to the Division of Sexually Transmitted Diseases Prevention, NCHSTP, as of July 19, 1999. Note: To print large tables and graphs users may have to change their printer settings to landscape and use a small font size. NOTIFIABLE DISEASES -- Summary of reported cases, by age group, United States, 1998
* Total number of acquired immunodeficiency syndrome (AIDS) cases reported to the Division of HIV/AIDS Prevention -- Surveillance and Epidemiology, National Center for HIV, STD, and TB Prevention (NCHSTP), as of December 31, 1998. Note: Incidence rates per 100,000 population. Rates <0.01 after rounding are listed as 0.00. Note: To print large tables and graphs users may have to change their printer settings to landscape and use a small font size. NOTIFIABLE DISEASES -- Summary of reported cases, by sex, United States, 1998
* Total number of acquired immunodeficiency syndrome (AIDS) cases reported to the Division of HIV/AIDS Prevention -- Surveillance and Epidemiology, National Center for HIV, STD, and TB Prevention (NCHSTP), as of December 31, 1998. Note: Incidence rates per 100,000 population. Rates <0.01 after rounding are listed as 0.00. Note: To print large tables and graphs users may have to change their printer settings to landscape and use a small font size. NOTIFIABLE DISEASES -- Summary of reported cases, by race, United States, 1998
* Total number of acquired immunodeficiency syndrome (AIDS) cases reported to the Division of HIV/AIDS Prevention -- Surveillance and Epidemiology, National Center for HIV, STD, and TB Prevention (NCHSTP), as of December 31, 1998. Note: To print large tables and graphs users may have to change their printer settings to landscape and use a small font size. NOTIFIABLE DISEASES -- Summary of reported cases, by ethnicity, United States, 1998
* Total number of acquired immunodeficiency syndrome (AIDS) cases reported to the Division of HIV/AIDS Prevention -- Surveillance and Epidemiology, National Center for HIV, STD, and TB Prevention (NCHSTP), as of December 31, 1998. Part 2: Graphs and Maps for Selected Notifiable Diseases in the United StatesEXPLANATION OF SYMBOLS USED IN TABLES, GRAPHS, AND MAPS
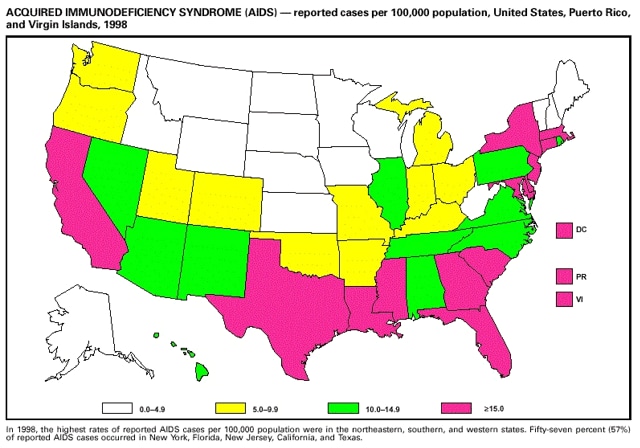
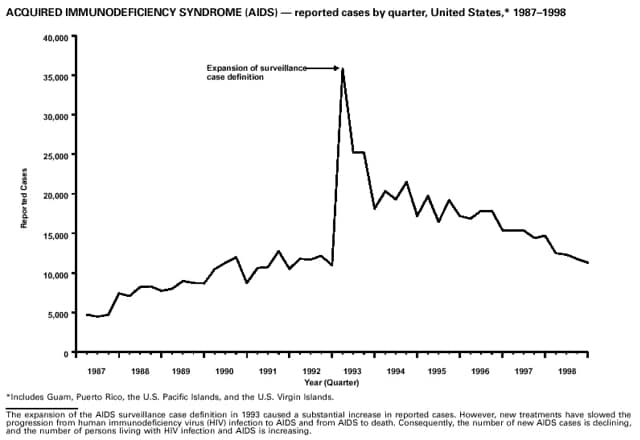
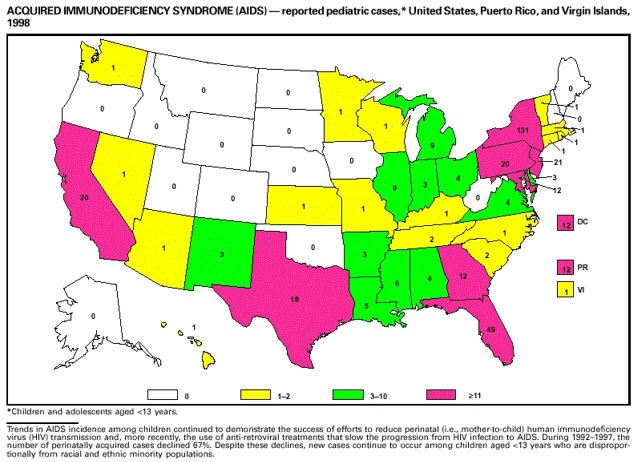
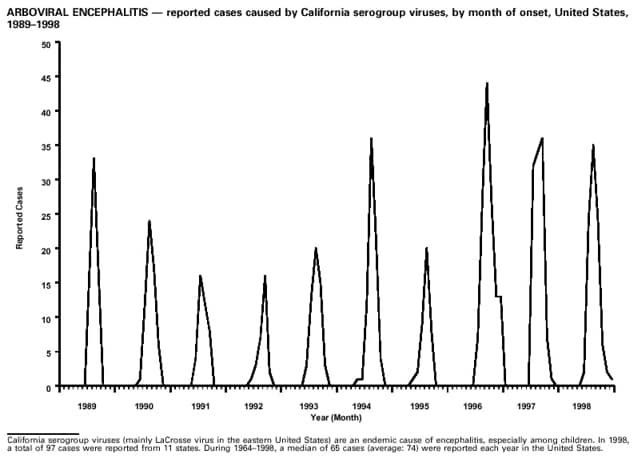
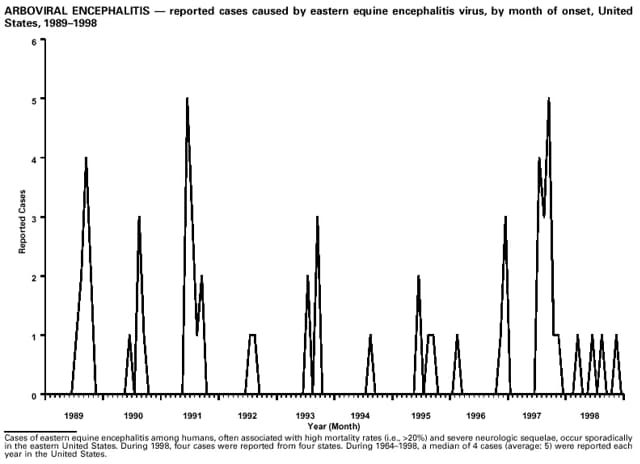
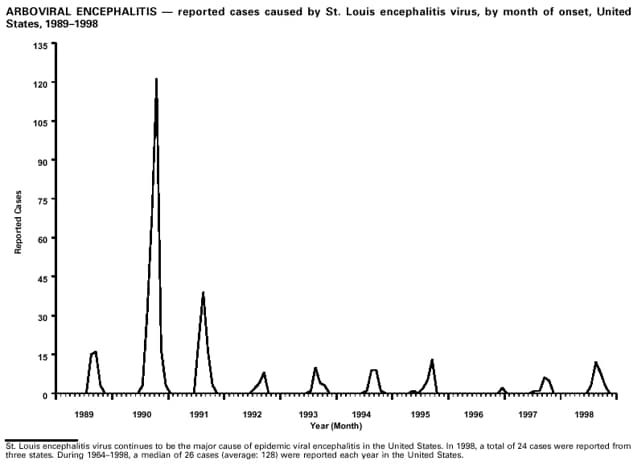
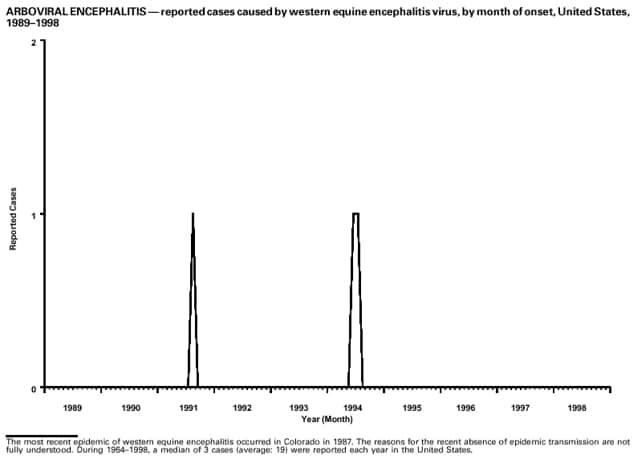
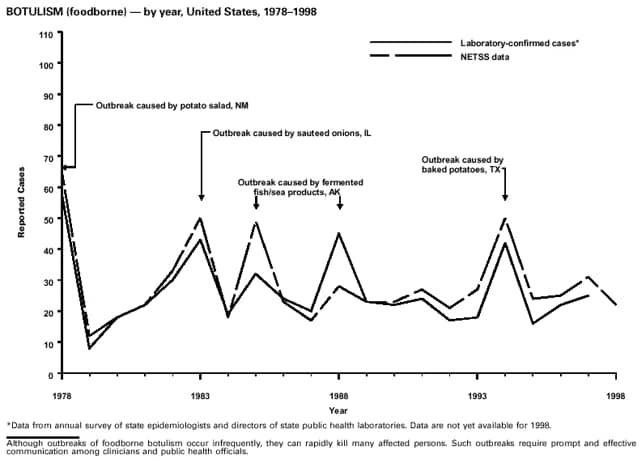
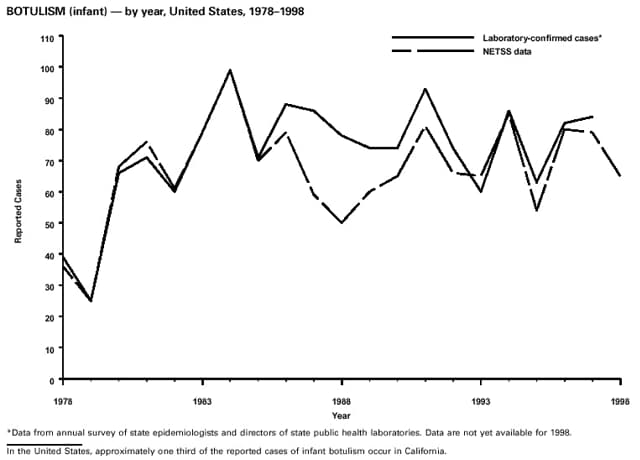
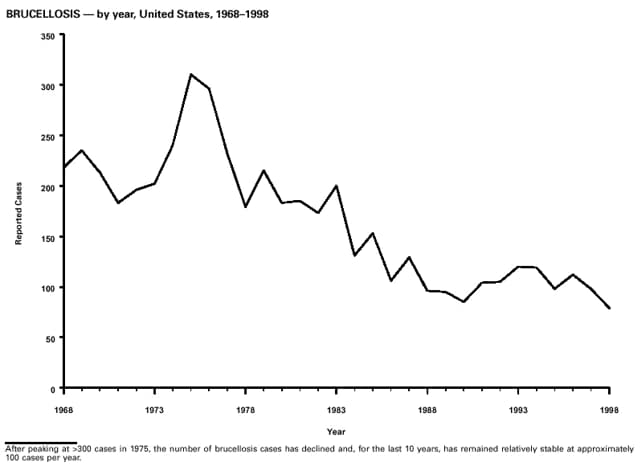
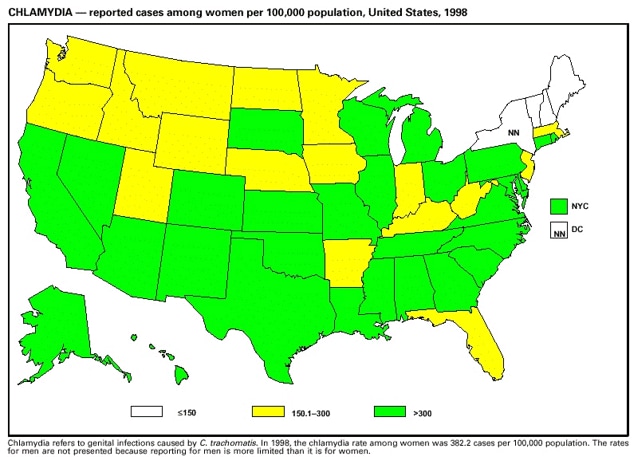
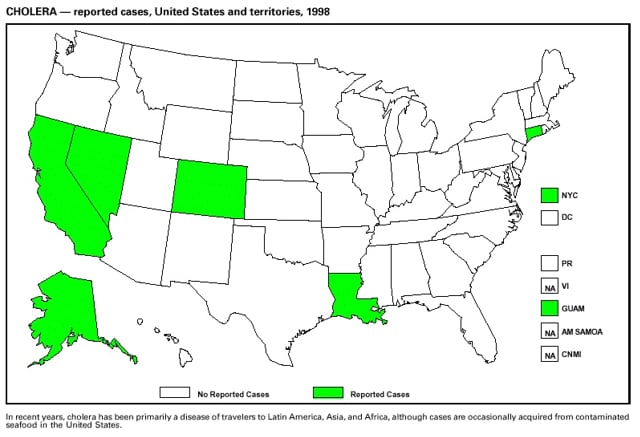
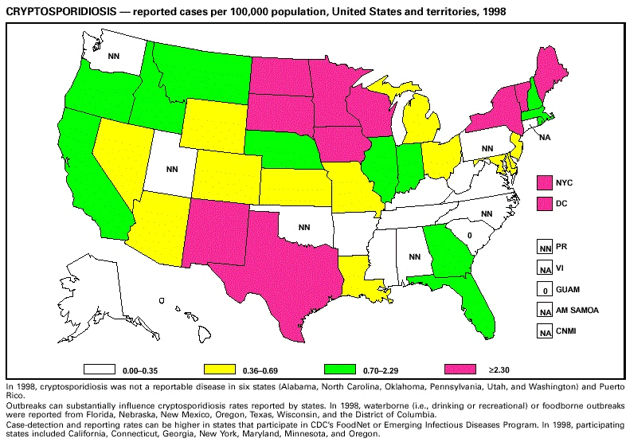
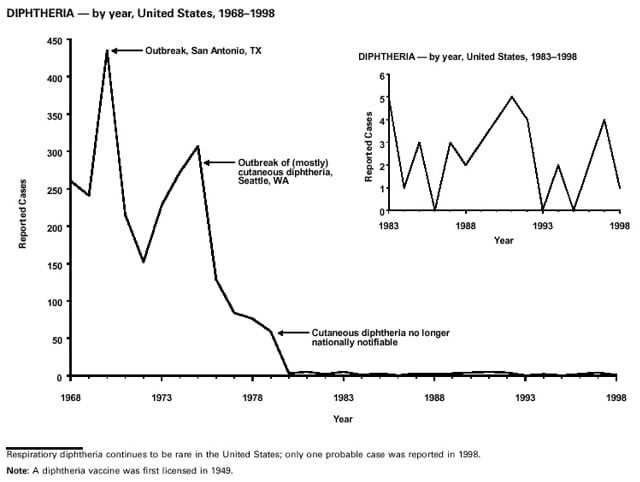
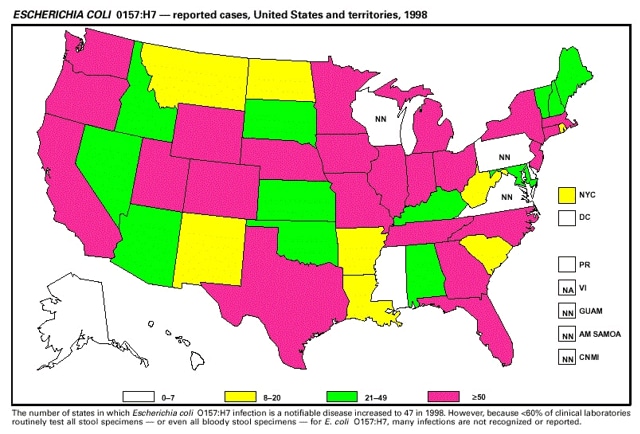
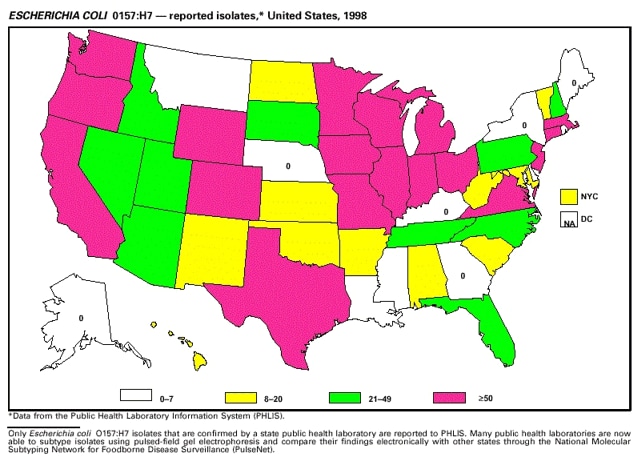
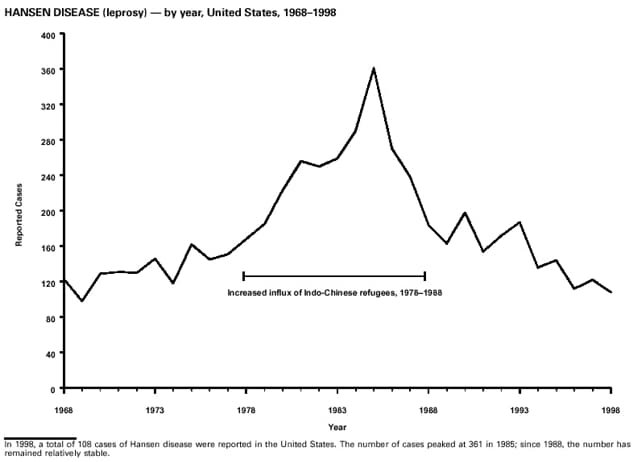
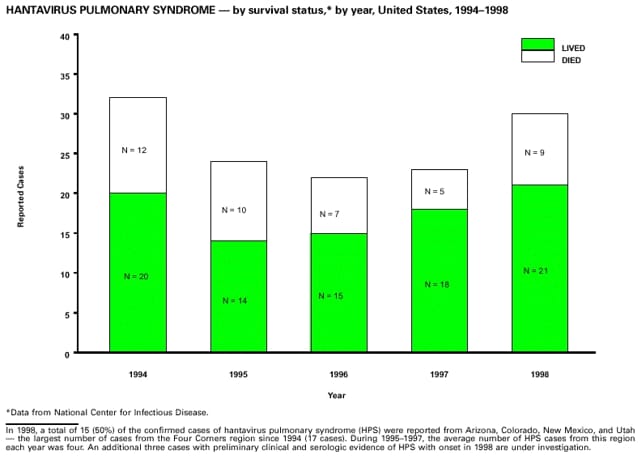
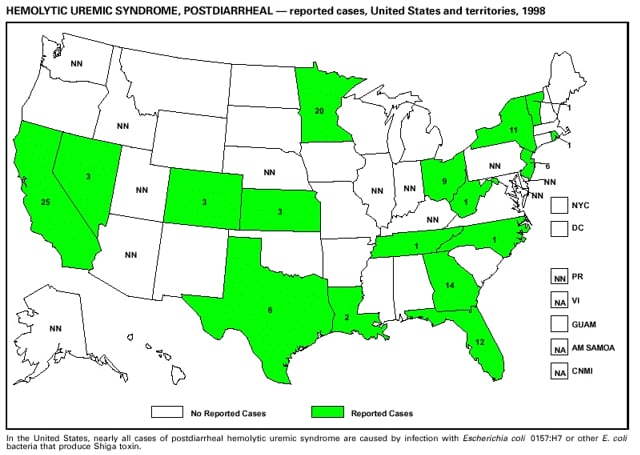
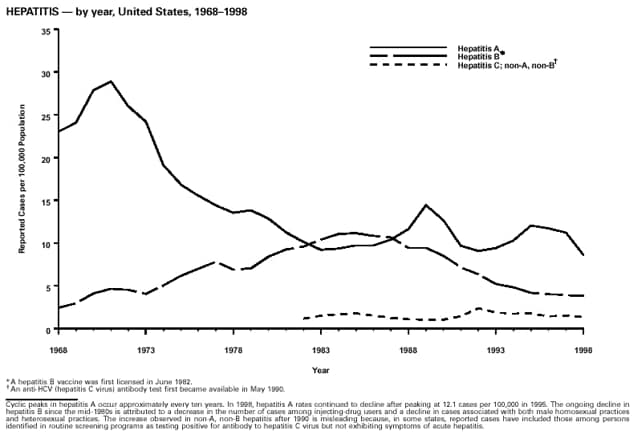
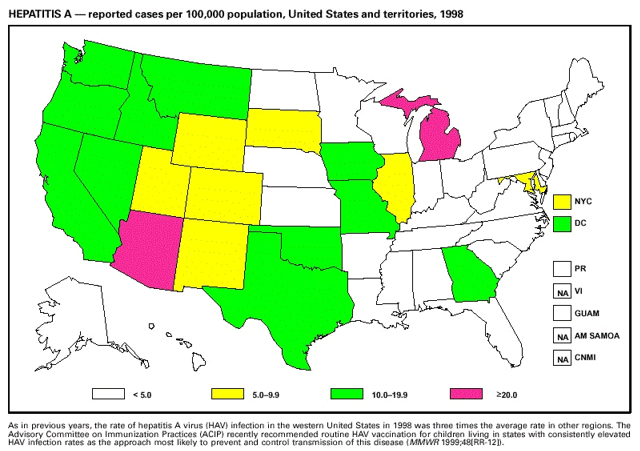
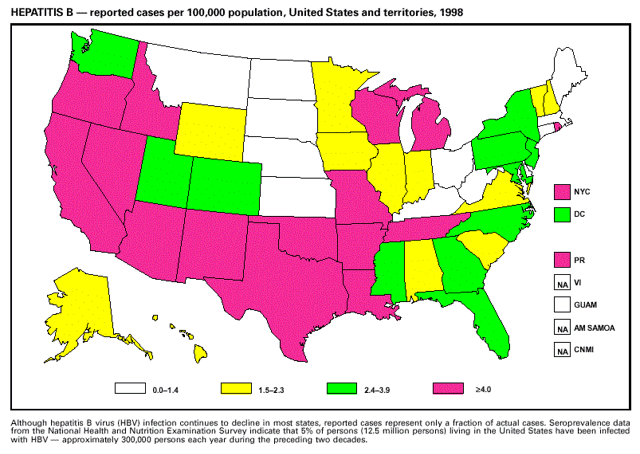
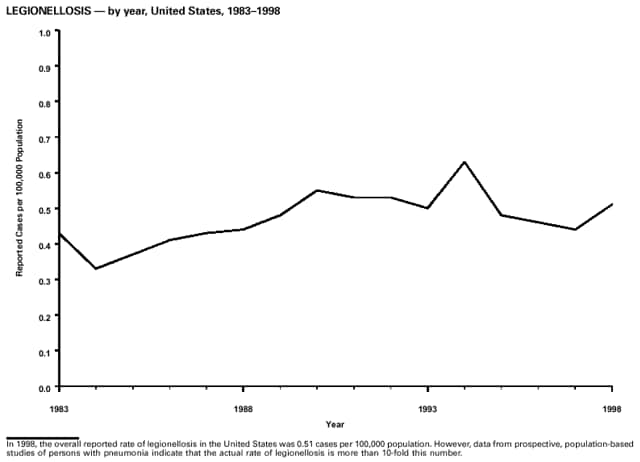
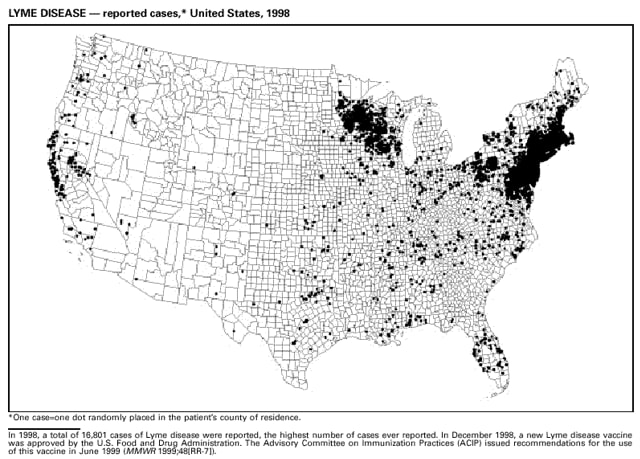
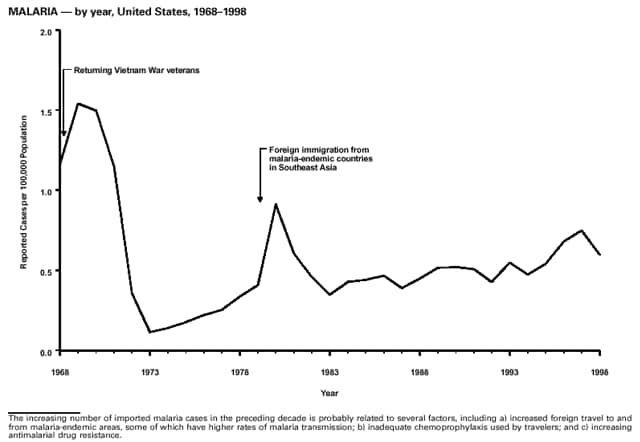
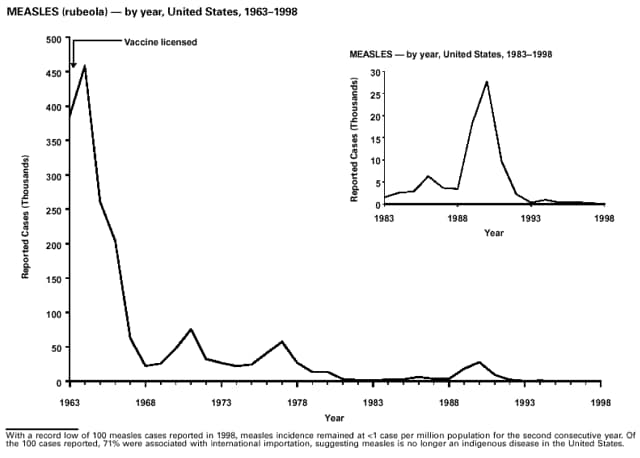
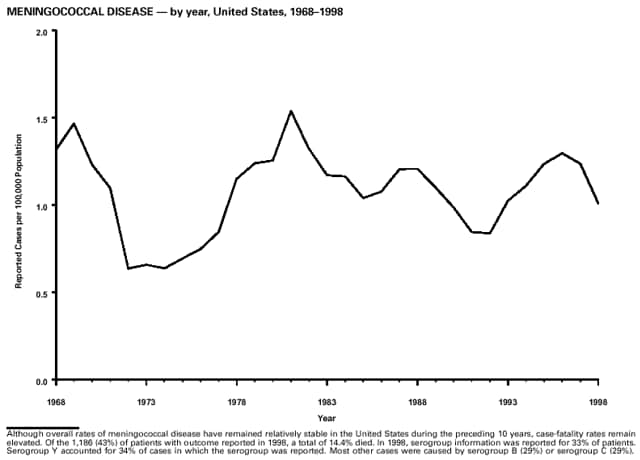
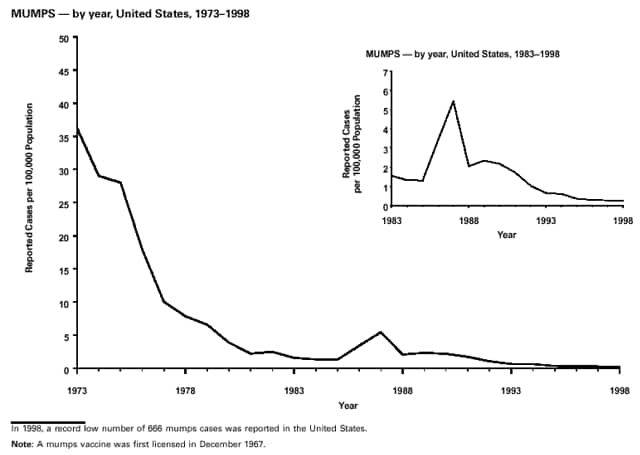
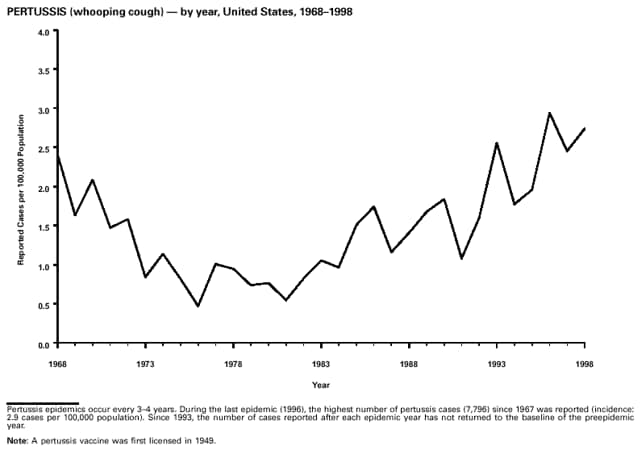
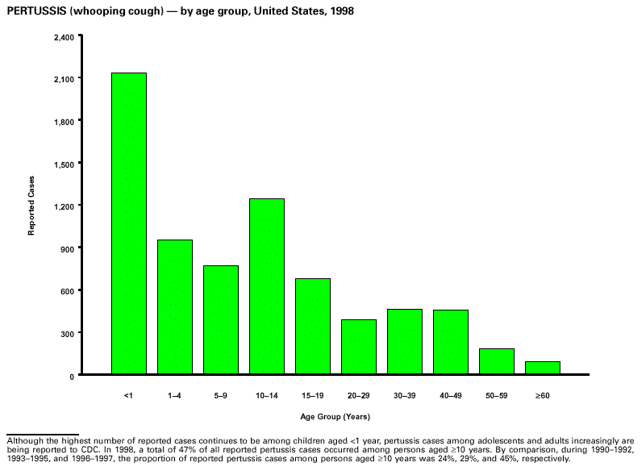
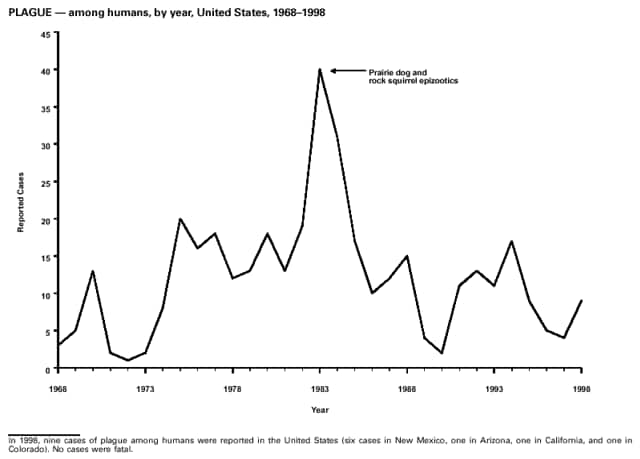
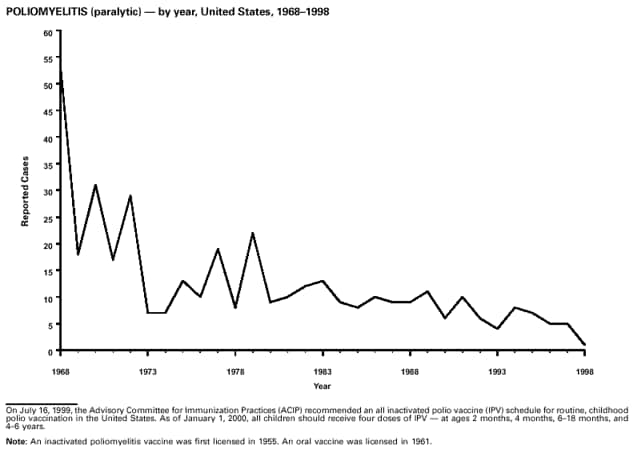
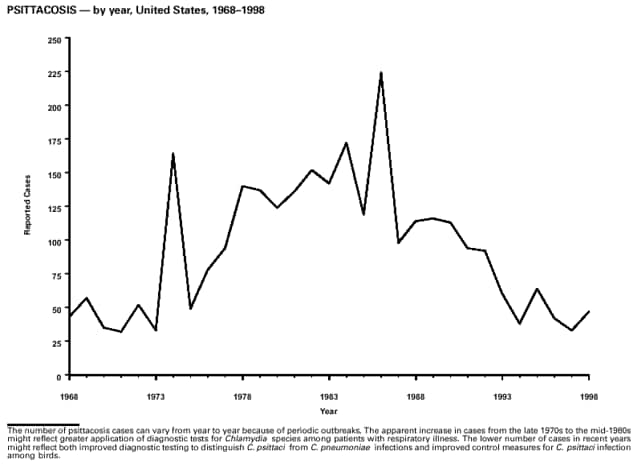
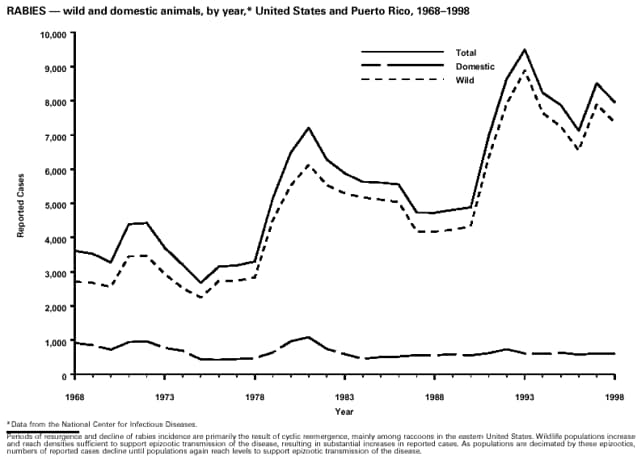
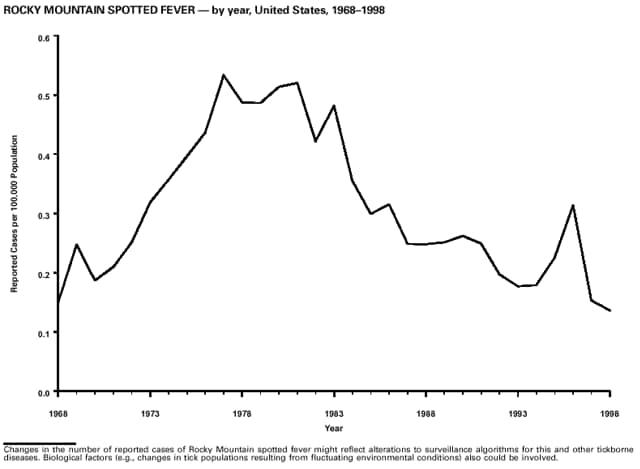
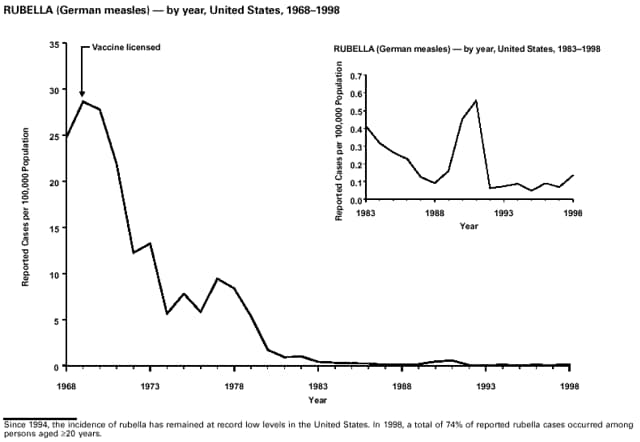
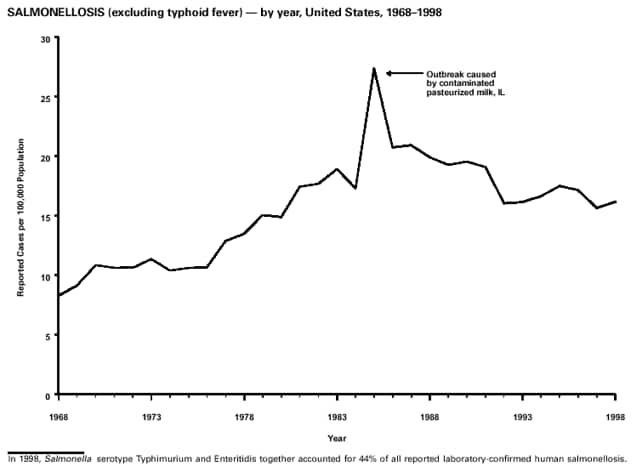
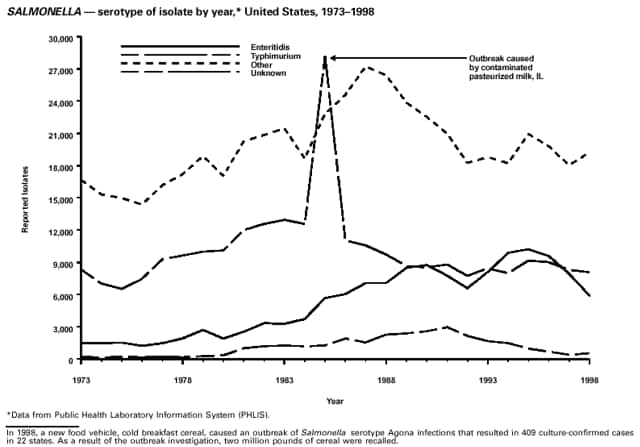
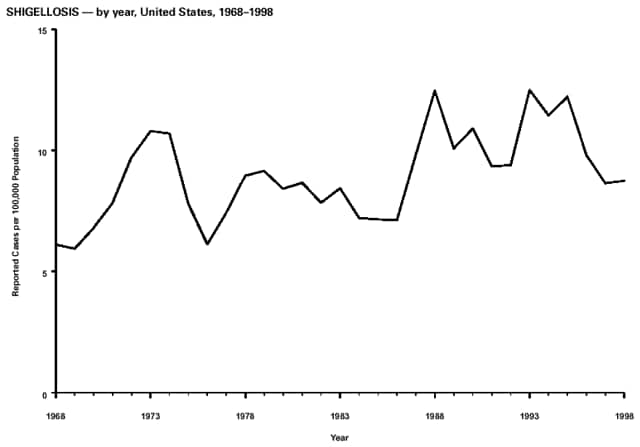
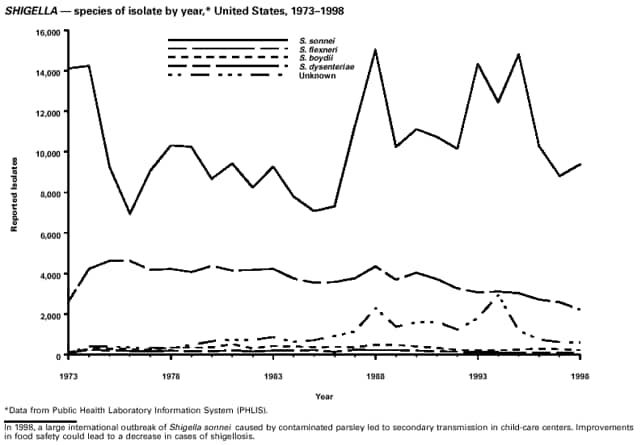
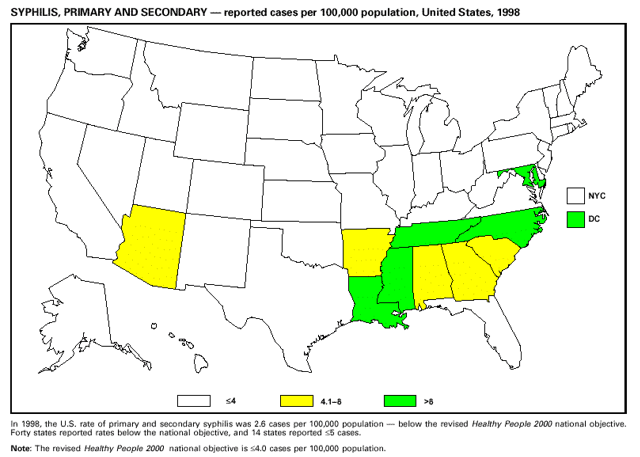
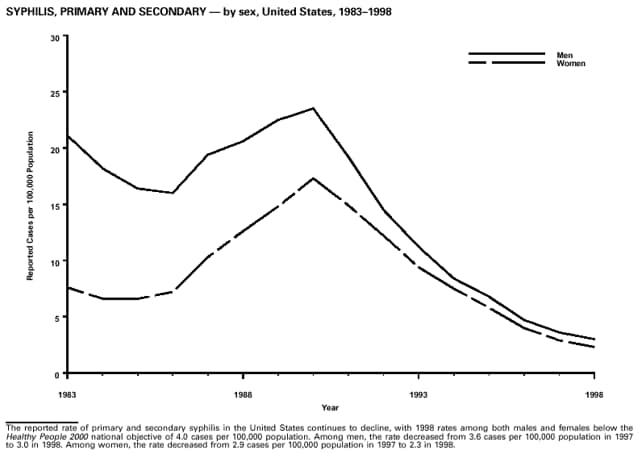
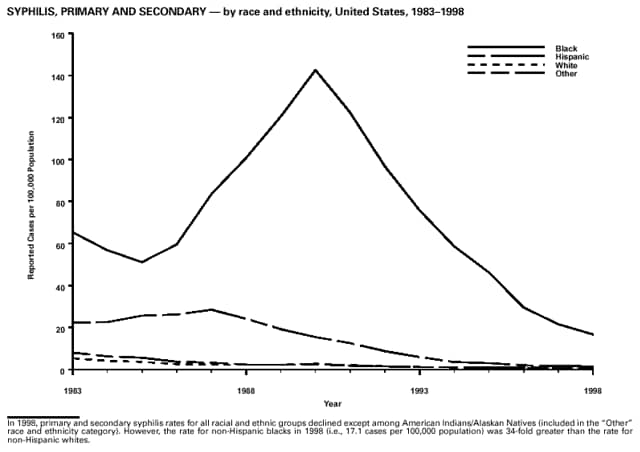
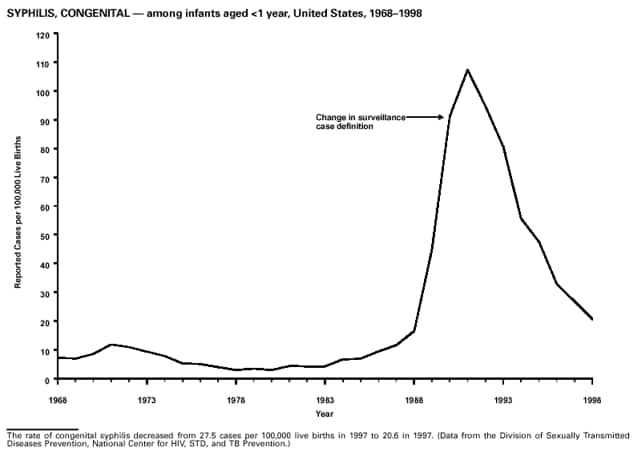
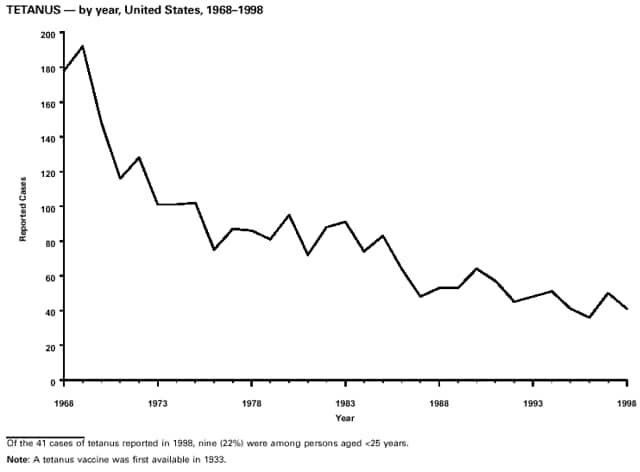
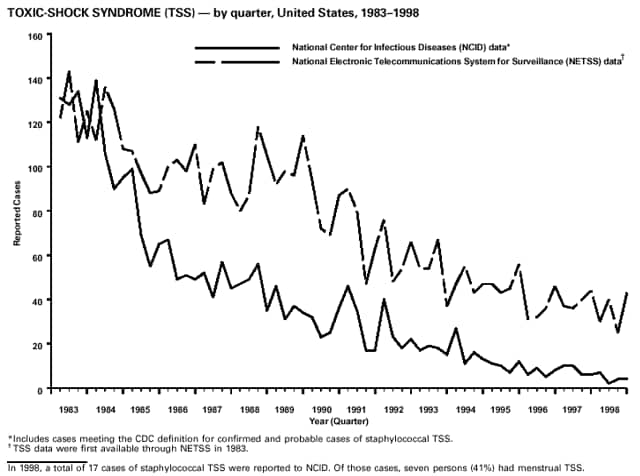
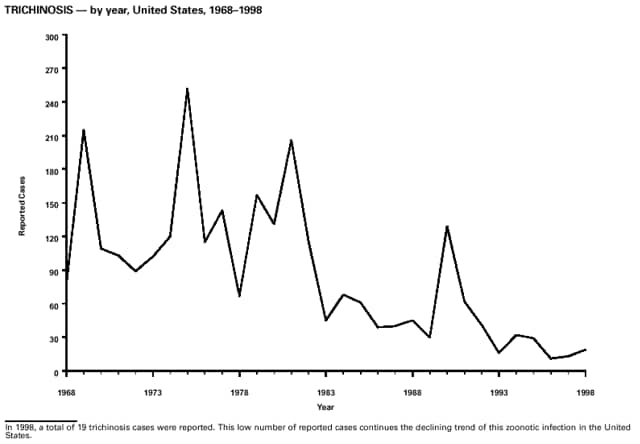
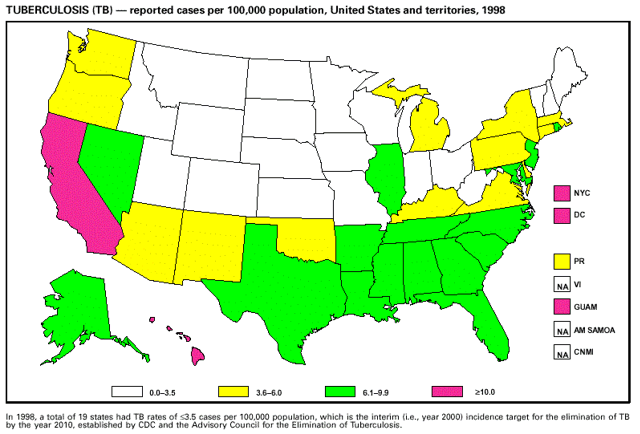
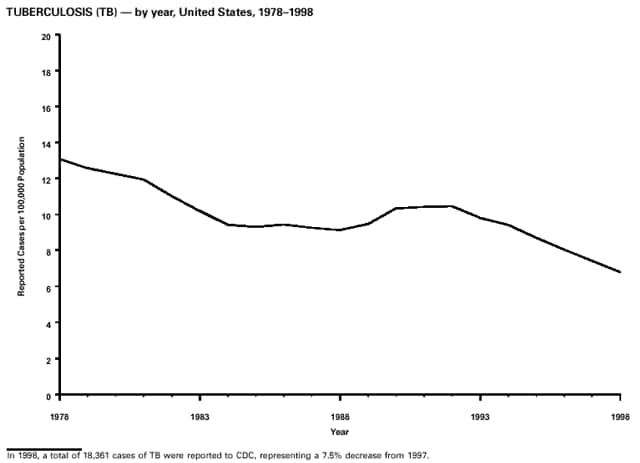
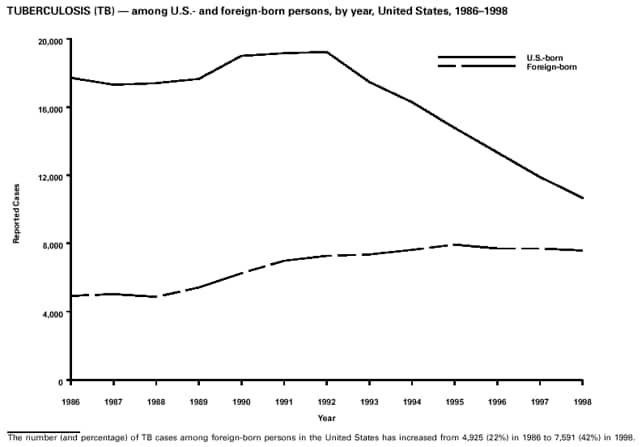
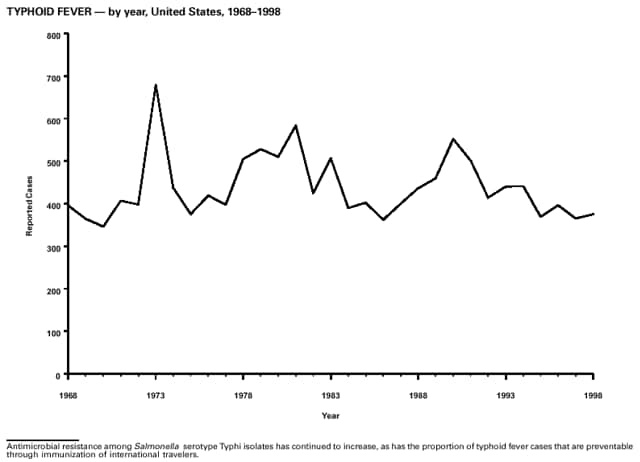
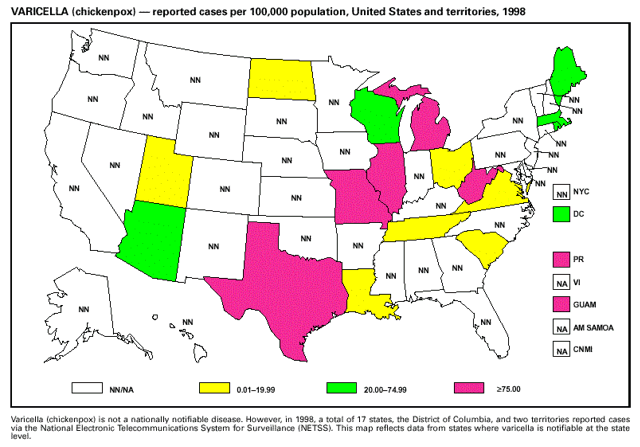
Part 3: Historical Summary TablesEXPLANATION OF SYMBOLS USED IN TABLES, GRAPHS, AND MAPS
Note: To print large tables and graphs users may have to change their printer settings to landscape and use a small font size. TABLE 1. NOTIFIABLE DISEASES -- Summary of reported cases per 100, 000 population, United States, 1988- 1998
* Acquired immunodeficiency syndrome (AIDS). Note: Incidence rates per 100,000 population. Rates <0.01 after rounding are listed as 0.00. Data in the MMWR Summary of Notifiable Diseases, United States might not match data in other CDC surveillance reports because of differences in the timing of reports, the source of the data, and the use of different case definitions. Note: To print large tables and graphs users may have to change their printer settings to landscape and use a small font size. TABLE 2. NOTIFIABLE DISEASES -- Summary of reported cases, United States, 1991-1998
* Total number of acquired immunodeficiency syndrome (AIDS) cases reported to the Division of HIV/AIDS Prevention -- Surveillance and Epidemiology, National Center for HIV, STD, and TB Prevention (NCHSTP), through December 31, 1998. Note: Data in the MMWR Summary of Notifiable Diseases, United States might not match data in other CDC surveillance reports because of differences in the timing of reports, the source of the data, and the use of different case definitions. Note: To print large tables and graphs users may have to change their printer settings to landscape and use a small font size. TABLE 3. NOTIFIABLE DISEASES -- Summary of reported cases, United States, 1983-1990
* Acquired immunodeficiency syndrome (AIDS). Note: Data in the MMWR Summary of Notifiable Disease, United States might not match data in other CDC Surveillance reports because of differences in timing of reports, the source of the data, and the use of different case definitions. Note: To print large tables and graphs users may have to change their printer settings to landscape and use a small font size. TABLE 4. NOTIFIABLE DISEASES -- Summary of reported cases, United States, 1975-1982
* Cutaneous diphtheria is no longer nationally notifiable after 1979. Note: Data in the MMWR Summary of Notifiable Diseases, United States might not match data in other CDC surveillance reports because of differences in the timing of reports, the source of the data, and the use of different case definitions. Note: To print large tables and graphs users may have to change their printer settings to landscape and use a small font size. TABLE 5. NOTIFIABLE DISEASES -- Summary of reported cases, United States, 1967-1974
* Not previously nationally notifiable. Note: Data in the MMWR Summary of Notifiable Diseases, United States might not match data in other CDC surveillance reports because of differences in the timing of reports, the source of the data, and the use of different case definitions. Note: To print large tables and graphs users may have to change their printer settings to landscape and use a small font size. TABLE 6. NOTIFIABLE DISEASES -- Deaths from selected diseases, United States, 1988-1997
* International Classification of Diseases, Ninth Revision, 1975. Numbers in this column are ICD-9 categories. Note: Data in the MMWR Summary of Notifiable Diseases, United States might not match data in other CDC surveillance reports because of differences in the timing of reports, the source of the data, and the use of different case definitions. Source: National Center for Health Statistics System, 1988-1997. Deaths are classified according to the ICD-9. BibliographyGeneral Roush S, Birkhead G, Koo D, Cobb A, Fleming D. Mandatory reporting of diseases and conditions by health care professionals and laboratories. JAMA 1999;282:164-70. CDC. Reporting race and ethnicity data -- National Electronic Telecommunications System for Surveillance, 1994-1997. MMWR 1999;48:305-12. Niskar AS, Koo D. Differences in notifiable infectious disease morbidity among adult women -- United States, 1992-1994. J Womens Health 1998;7:451-8. CDC. Case definitions for infectious conditions under public health surveillance. MMWR 1997;46(No. RR-10). Also available on the Internet at http://www.cdc.gov/epo/dphsi/casedef/cover97.htm. Accessed July 23, 1999. CDC. Sexually transmitted disease surveillance 1997. Atlanta, GA: US Department of Health and Human Services, Public Health Service, CDC, 1998. CDC. Manual for the surveillance of vaccine-preventable diseases. Atlanta, GA: US Department of Health and Human Services, CDC, 1997. Also available on the Internet at the following site: http://www.cdc.gov/nip/publications/manual/vpd.htm. Accessed July 23, 1999. CDC. Demographic differences in notifiable infectious disease morbidity -- United States, 1992-1994. MMWR 1997;46:637-41. CDC. Notifiable disease surveillance and notifiable disease statistics -- United States, June 1946 and June 1996. MMWR 1996;45:530-7. Koo D, Wetterhall S. History and current status of the National Notifiable Diseases Surveillance System. Journal of Public Health Management and Practice 1996;2:4-10. CDC. Ten leading nationally notifiable infectious diseases -- United States, 1995. MMWR 1996;45:883-4. Benenson AS. Control of communicable diseases in man. 16th ed. Washington, DC: American Public Health Association, 1995. Martin SM, Bean NH. Data management issues for emerging diseases and new tools for managing surveillance and laboratory data. Emerg Infect Dis J 1995;1:124-8. CDC. Manual of procedures for the reporting of nationally notifiable diseases to CDC. Atlanta, GA: US Department of Health and Human Services, Public Health Service, CDC, 1995. Teutsch SM, Churchill RE, eds. Principles and practice of public health surveillance. New York, NY: Oxford University Press, 1994. Thacker SB, Stroup DF. Future directions for comprehensive public health surveillance and health information systems in the United States. Am J Epidemiol 1994;140:383-97. CDC. Use of race and ethnicity in public health surveillance. MMWR 1993;42(No. RR-10). CDC. Mandatory reporting of infectious diseases by clinicians, and mandatory reporting of occupational diseases by clinicians. MMWR 1990;39(No. RR-9). Thacker SB, Choi K, Brachman PS. The surveillance of infectious diseases. JAMA 1983;249:1181-5. AIDS CDC. Characteristics of persons living with AIDS at the end of 1997. HIV/AIDS Surveillance Supplemental Report 1999;5(No. 1). CDC. Success in implementing PHS guidelines to reduce perinatal transmission of HIV -- Louisiana, Michigan, New Jersey, and South Carolina, 1993, 1995, and 1996 [published errata appear in MMWR 1998;47:718]. MMWR 1998;47:688-91. CDC. Diagnosis and reporting of HIV and AIDS in states with integrated HIV and AIDS surveillance -- United States, January 1994-June 1997. MMWR 1998;47:309-14. CDC. HIV/AIDS Surveillance Report 1998;10(No. 2). Botulism Angulo FJ, Getz J, Taylor JP, et al. A large outbreak of botulism: the hazardous baked potato. J Infect Dis 1998;178:172-7. CDC. Botulism in the United States, 1899-1996. Handbook for epidemiologists, clinicians, and laboratory workers. Atlanta, GA: US Department of Health and Human Services, CDC, 1998. Also available at http://www.cdc.gov/ncidod/dbmd/diseaseinfo/botulism.pdf. Accessed July 23, 1999. Shapiro RL, Hatheway C, Becher J, Swerdlow D. Botulism surveillance and emergence response: a public health strategy for a global challenge. JAMA 1997;278:433-5. Chancroid Mertz KJ, Weiss JB, Webb RM, et al. An investigation of genital ulcers in Jackson, Mississippi, with use of a multiplex polymerase chain reaction assay: high prevalence of chancroid and human immunodeficiency virus infection. J Infect Dis 1998;178:1060-6. Mertz KJ, Trees D, Levine WC, et al. Etiology of genital ulcers and prevalence of human immunodeficiency virus coinfection in 10 US cities. The Genital Ulcer Disease Surveillance Group. J Infect Dis 1998;178:1795-8. DiCarlo RP, Armentor BS, Martin DH. Chancroid epidemiology in New Orleans men. J Infect Dis 1995;172:446-52. CDC. Chancroid in the United States, 1981-1990: evidence for underreporting of cases. In: CDC surveillance summaries, May 29, 1992. MMWR 1992;41(No. SS-3):57-61. Chlamydia trachomatis, Genital Infection CDC. Sexually transmitted disease surveillance 1997 supplement. Chlamydia prevalence monitoring project annual report -- 1997. Atlanta, GA: US Department of Health and Human Services, Public Health Service, CDC, 1998. Gaydos CA, Howell MR, Pare B, et al. Chlamydia trachomatis infections in female military recruits. N Engl J Med 1998;339:739-44. Mertz KJ, McQuillan GM, Levine WC, et al. A pilot study of the prevalence of chlamydial infection in a national household survey. Sex Transm Dis 1998;25:225-8. CDC. Chlamydia trachomatis genital infections -- United States, 1995. MMWR 1997;46:193-8. Cholera Ackers ML, Quick RE, Drasbeck CJ, Hutwagner L, Tauxe RV. Are there national risk factors for epidemic cholera? The correlation between socioeconomic and demographic indices and cholera incidence in Latin America. Int J Epidemiol 1998;27:330-4. Mahon BE, Mintz ED, Greene KD, Wells JG, Tauxe RV. Reported cholera in the United States, 1992-1994: a reflection of global changes in cholera epidemiology. JAMA 1996;276:307-12. Wachsmuth IK, Blake PA, Olsvik O, eds. Vibrio cholerae and cholera: molecular to global perspectives. Washington, DC: American Society for Microbiology, 1994. Blake PA. Epidemiology of cholera in the Americas. Gastroenterol Clin North Am 1993;22:639-60. World Health Organization. Guidelines for cholera control. Geneva: World Health Organization, 1993. Cryptosporidiosis Kramer MH, Herwaldt BL, Craun GF, Calderon RL, Juranek DD. Surveillance for waterborne-disease outbreaks -- United States, 1993-1994. In: CDC surveillance summaries, April 12, 1996. MMWR 1996;45(No. SS-1). Juranek DD. Cryptosporidiosis: sources of infection and guidelines for prevention. Clin Infect Dis 1995;21(suppl 1):S57-S61. Also available on the Internet at the following site: http://www.cdc.gov/ncidod/diseases/crypto/sources.htm. Accessed July 23, 1999. CDC. Assessing the public health threat associated with waterborne cryptosporidiosis: report of a workshop. MMWR 1995;44(No. RR-6). Also available on the Internet at the following site: http://www.ftp.cdc.gov/pub/Publications/mmwr/rr/rr4406.pdf . Accessed July 23, 1999. Cyclosporiasis Herwaldt BL, Beach MJ. The return of Cyclospora in 1997: another outbreak of cyclosporiasis in North America associated with imported raspberries. Cyclospora Working Group. Ann Intern Med 1999;130:210-20. CDC. Outbreak of cyclosporiasis -- Ontario, Canada, May 1998. MMWR 1998;47:806-9. Herwaldt BL, Ackers ML, Cyclospora Working Group. An outbreak in 1996 of cyclosporiasis associated with imported raspberries. N Engl J Med 1997;336:1548-56. Dengue Rigau-Perez JG, Millard PS, Walker DR, Deseda CC, Casta-Velez A. A deviation bar chart for detecting dengue outbreaks in Puerto Rico. Am J Public Health 1999;89:374-8. CDC. Dengue outbreak associated with multiple serotypes -- Puerto Rico, 1998. MMWR 1998;47:952-6. Rawlings JA, Hendricks KA, Burgess CR, et al. Dengue surveillance in Texas, 1995. Am J Trop Med Hyg 1998;59:95-9. Organización Panamericana de la Salud. Situación de las enfermedades infecciosas de mayor riesgo epidemiológico en el período post-Mitch, países de Centroamerica, 1998 [Segundo informe]. Washington, DC: Organización Panamericana de la Salud, Programa de Enfermedades Transmisibles, División de Prevención y Control de Enfermedades, 1998;OPS/HCP/HCT/134/98:5-8. Diphtheria Bisgard K, Hardy I, Popovic T, et al. Respiratory diphtheria in the United States, 1980-1995. Am J Public Health 1998;88:787-91 Vitek CR, Wharton M. Diphtheria in the former Soviet Union: reemergence of a pandemic disease [Review]. Emerg Infect Dis 1998;4:539-50. Encephalitis, Arboviral Jones TF, Craig AS, Nasci RS, et al. Newly recognized focus of La Crosse encephalitis in Tennessee. Clin Infect Dis 1999;28:93-7. CDC. Arboviral infections of the central nervous system -- United States, 1996-1997. MMWR 1998;47:517-22. Szumlas DE, Apperson CS, Hartig PC, Francy DB, Karabatsos N. Seroepidemiology of La Crosse virus infection in humans in western North Carolina. Am J Trop Med Hyg 1996;54:332-7. Marfin AA, Bleed DM, Lofgren JP, et al. Epidemiologic aspects of a St. Louis encephalitis epidemic in Jefferson County, Arkansas, 1991. Am J Trop Med Hyg 1993;49:30-7. Escherichia coli O157:H7; Hemolytic Uremic Syndrome, Postdiarrheal CDC. PulseNet. The National Molecular Subtyping Network for Foodborne Disease Surveillance. Available on the Internet at http://www.cdc.gov/ncidod/dbmd/pulsenet/pulsenet.htm. Accessed July 23, 1999. Bender JB, Hedberg CW, Besser JM, Boxrud DJ, MacDonald KL, Osterholm MT. Surveillance for Escherichia coli O157:H7 infections in Minnesota by molecular subtyping. N Engl J Med 1997;337:388-94. Mahon BE, Griffin PM, Mead PS, Tauxe RV. Hemolytic uremic syndrome surveillance to monitor trends in infection with Escherichia coli O157:H7 and other Shiga toxin-producing E. coli. Emerg Infect Dis 1997;3:409-12. Slutsker L, Ries AA, Greene KD, Wells JG, Hutwagner L, Griffin PM. Escherichia coli O157:H7 diarrhea in the United States: clinical and epidemiologic features. Ann Intern Med 1997;126:505-13. Gonorrhea CDC. Increases in unsafe sex and rectal gonorrhea among men who have sex with men -- San Francisco, California, 1994-1997. MMWR 1999;48:45-8. CDC. Sexually transmitted diseases surveillance 1997 supplement. Gonococcal Isolate Surveillance Project (GISP) annual report - 1997. Atlanta, GA: US Department of Health and Human Services, Public Health Service, CDC, 1998. Fox KK, Whittington W, Levine WC, Moran JS, Zaidi AA, Nakashima AK. Gonorrhea in the United States, 1981-1996. Demographic and geographic trends. Sex Transm Dis 1998;25:386-93. Fox KK, Knapp JS, Holmes KK, et al. Antimicrobial resistance in Neisseria gonorrhoeae in the United States, 1988-1994: the emergence of decreased susceptibility to the fluoroquinolones. J Infect Dis 1997;175:1396-403. Haemophilus influenzae, Invasive Disease Bisgard KM, Kao A, Leake J, Strebel PM, Perkins BA, Wharton M. Haemophilus influenzae invasive disease in the United States, 1994-1995: near disappearance of a child vaccine preventable disease. Emerg Infect Dis 1998;4:229-37. CDC. Progress towards elimination of Haemophilus influenzae type b disease among infants and children -- United States, 1987-1997. MMWR 1998;47:993-8. Schuchat A, Robinson K, Wenger JD, et al. Bacterial meningitis in the United States in 1995. New Engl J Med 1997;33:970-6. CDC. Recommendations for the use of Haemophilus b conjugate vaccines and a combined diphtheria, tetanus, pertussis, and Haemophilus b vaccine: recommendations of the Advisory Committee on Immunization Practices (ACIP). MMWR 1993;42(No. RR-13). Hantavirus Pulmonary Syndrome Mills JN, Ksiazek TG, Peters CJ, Childs JE. Long-term studies of hantavirus reservoir populations in the southwestern United States: a synthesis. Emerg Infect Dis 1999;5:135-42. Monroe MC, Morzunov SP, Johnson AM, et al. Genetic diversity and distribution of Peromyscus-borne hantaviruses in North America. Emerg Infect Dis 1999;5:75-86. Engelthaler DM, Mosley DG, Cheek JE, et al. Climatic and environmental patterns associated with hantavirus pulmonary syndrome, Four Corners region, United States. Emerg Infect Dis 1999;5:87-94. CDC. Hantavirus infection -- southwestern United States: interim recommendations for risk reduction. MMWR 1993;42(No. RR-11). Hepatitis A CDC. Prevention of hepatitis A through active or passive immunization: recommendations of the Advisory Committee on Immunization Practices (ACIP). MMWR 1996;45(No. RR-15). Lemon SM, Shapiro CN. The value of immunization against hepatitis A. Infectious Agents and Disease 1994;1:38-49. Shapiro CN, Coleman PJ, McQuillan GM, et al. Epidemiology of hepatitis A: seroepidemiology and risk groups in the U.S.A. Vaccine 1992;10(suppl 1):S59-S62. Hepatitis B Coleman PJ, McQuillan GM, Moyer LA, Lambert SB, Margolis HS. Incidence of hepatitis B virus infection in the United States, 1976-1994: estimates from the National Health and Nutrition Examination Surveys. J Infect Dis 1998;178:954-9. Margolis HS, Alter MJ, Hadler SC. Hepatitis B: evolving epidemiology and implications for control. Semin Liver Dis 1991;11:84-92. CDC. Hepatitis B virus: a comprehensive strategy for eliminating transmission in the United States through universal childhood vaccination: recommendations of the Immunization Practices Advisory Committee (ACIP). MMWR 1991;40(No. RR-13). Hepatitis C; Non-A, Non-B CDC. Recommendations for prevention and control of hepatitis C virus (HCV) infection and HCV-related chronic disease. MMWR 1998;47(No. RR-19). Alter MJ, Mast EE, Moyer LA, Margolis HS. Hepatitis C. Infect Dis Clin North Am 1998;12:13-26. Legionellosis Kool JL, Carpenter JC, Fields BS. Effect of monochloramine disinfection of municipal drinking water on risk of nosocomial Legionnaires' disease. Lancet 1999;353:272-7. Jernigan DB, Hofmann J, Cetron MS, et al. Outbreak of Legionnaires' disease among cruise ship passengers exposed to a contaminated whirlpool spa. Lancet 1996;347:494-9. Keller DW, Hajjeh R, DeMaria A, Jr, et al. Community outbreak of Legionnaires' disease: an investigation confirming the potential for cooling towers to transmit legionella species. Clin Infect Dis 1996;22:257-61. Marston BJ, Lipman HB, Breiman RF. Surveillance for Legionnaires' disease: risk factors for morbidity and mortality. Arch Intern Med 1994;154:2417-22. Lyme Disease CDC. Recommendations for the use of Lyme disease vaccine. Recommendations of the Advisory Committee on Immunization Practices (ACIP). MMWR 1999;48(No. RR-7). Dennis DT. Epidemiology, ecology, and prevention of Lyme disease. In: Rahn DW, Evans J, eds. Lyme disease. Philadelphia, PA: American College of Physicians, 1998:7-34. CDC. Lyme disease -- United States, 1996. MMWR 1997:46:531-5. CDC. Notice to readers: recommendations for test performance and interpretation from the Second National Conference on Serologic Diagnosis of Lyme disease. MMWR 1995;44:590-1. Malaria Lobel HO, Kozarsky PE. Update on prevention of malaria for travelers. JAMA 1997;278:1767-71. Zucker JR. Changing patterns of autochthonous malaria transmission in the United States: a review of recent outbreaks. Emerg Infect Dis 1996;2:37-43. Zucker JR, Campbell CC. Malaria: principles of prevention and treatment. Infect Dis Clin North Am 1993;7:547-67. Measles (Rubeola) CDC. Transmission of measles among a highly vaccinated school population -- Anchorage, Alaska, 1998. MMWR 1999;47:1109-11. CDC. Measles, mumps and rubella -- vaccine use and strategies for elimination of measles, rubella, and congenital rubella syndrome and control of mumps: recommendations of the Advisory Committee on Immunization Practices (ACIP). MMWR 1998;47(No. RR-8). CDC. Measles -- United States, 1997. MMWR 1998;47:273-6. Meningococcal Disease Diermayer M, Hedberg K, Hoesly F, et al. Epidemic serogroup B meningococcal disease in Oregon: the evolving epidemiology of the ET-5 strain. JAMA 1999;281:1493-7. Rosenstein N, Levine O, Taylor JP, et al. Efficacy of meningococcal vaccine and barriers to vaccination. JAMA 1998;279:435-9. CDC. Control and prevention of meningococcal disease and control and prevention of serogroup C meningococcal disease: evaluation and management of suspected outbreaks. Recommendations of the Advisory Committee on Immunization Practices (ACIP). MMWR 1997;46(No. RR-5). CDC. Laboratory-based surveillance for meningococcal disease in selected areas -- United States, 1989-1991. In: CDC surveillance summaries (June 4). MMWR 1993;42(No. SS-2):21-30. Mumps CDC. Mumps surveillance -- United States, 1988-1993. In: CDC surveillance summaries, August 11, 1995. MMWR 1995;44(No. SS-3). Briss PA, Fehrs LJ, Parker RA, et al. Sustained transmission of mumps in a highly vaccinated population: assessment of primary vaccine failure and waning vaccine-induced immunity. J Infect Dis 1994;169:77-82. Hersh BS, Fine PE, Kent WK, et al. Mumps outbreak in a highly vaccinated population. J Pediatr 1991;119:187-93. CDC. Recommendations of the Immunization Practices Advisory Committee on Mumps prevention. MMWR 1989;38:388-92,397-400. Pertussis Guris D, Strebel PM, Bardenheier B, et al. Changing epidemiology of pertussis in the United States: increasing reported incidence among adolescents and adults, 1990-1996. Clin Infect Dis 1999;28:1230-7. CDC. Notice to readers: FDA approval of a fourth acellular pertussis vaccine for use among infants and young children. MMWR 1998;47:934-6. CDC. Pertussis vaccination: use of acellular pertussis vaccines among infants and young children. Recommendations of the Advisory Committee on Immunization Practices (ACIP). MMWR 1997;46(No.RR-7). Plague Poland JD, Dennis DT. Plague. In: Evans AS, Brachman PS, eds. Bacterial infections of humans: epidemiology and control. 3rd ed. New York, NY: Plenum Publishing Corporation, 1998:545-58. Gage KL. Plague. In: Hausler WJ, Jr, Sussman M, eds. Topley and Wilson's microbiology and microbial infections. Vol. 3: Bacterial infections. 9th ed. London, England: Arnold, 1998:885-903. CDC. Prevention of plague. Recommendations of the Advisory Committee on Immunization Practices (ACIP). MMWR 1996;45(No. RR-14). Poliomyelitis, Paralytic CDC. Impact of the sequential IPV/OPV schedule on vaccination coverage levels -- United States, 1997. MMWR 1998;47:1017-9. CDC. Paralytic poliomyelitis -- United States, 1980-1994. MMWR 1997;46:79-83. CDC. Poliomyelitis prevention in the United States: introduction of a sequential vaccination schedule of inactivated poliovirus vaccine followed by oral poliovirus vaccine. Recommendations of the Advisory Committee on Immunization Practices (ACIP). MMWR 1997;46(No. RR-3). Psittacosis Moroney JF, Guevara R, Iverson C, et al. Detection of chlamydiosis in a shipment of pet birds, leading to recognition of an outbreak of clinically mild psittacosis in humans. Clin Infect Dis 1998;26:1425-9. Jorgensen DM. Gestational psittacosis in a Montana sheep rancher. Emerg Infect Dis 1997;3:191-4 CDC. Compendium of psittacosis (chlamydiosis) control, 1997. MMWR 1997;46(No. RR-13). Wong KH, Skelton SK, Daugharty H. Utility of complement fixation and microimmunofluorescence assays for detecting serologic responses in patients with clinically diagnosed psittacosis. J Clin Microbiol 1994;32:2417-21. Rabies, Animal and Human CDC. Human rabies prevention -- United States, 1999. Recommendations of the Advisory Committee on Immunization Practices (ACIP). MMWR 1999;48(No. RR-1). CDC. Compendium of animal rabies control, 1999. National Association of State and Territorial Public Health Veterinarians, Inc. MMWR 1999;48(No. RR-3). Krebs JW, Smith JS, Rupprecht CE, Childs JE. Rabies surveillance in the United States during 1997. JAVMA 1998;213:1713-28. Noah DL, Drenzek CL, Smith JS, et al. Epidemiology of human rabies in the United States, 1980 to 1996 [Review]. Ann Intern Med 1998;128:922-30. Rocky Mountain Spotted Fever Paddock CD, Greer PW, Ferebee T, et al. Hidden mortality attributable to Rocky Mountain spotted fever: immunohistochemical detection of fatal, serologically unconfirmed cases. J Infect Dis 1999;179:1469-76. Thorner AR, Walker DH, Petri WA, Jr. Rocky Mountain spotted fever [Review]. Clin Infect Dis 1998;27:1353-9. Dalton MJ, Clarke MJ, Holman RC, et al. National surveillance for Rocky Mountain spotted fever, 1981-1992: epidemiologic summary and evaluation of risk factors for fatal outcome. Am J Trop Med Hyg 1995;52:405-13. Rubella Schluter WW, Reef SE, Redd SC, Dykewicz CA, Changing epidemiology of congenital rubella syndrome in the United States. J Infect Dis 1998;178:636-41. CDC. Rubella outbreak -- Westchester County, New York, 1997-98. MMWR 1999;48:560-3. CDC. Rubella and congenital rubella syndrome -- United States, 1994-1997. MMWR 1997;46:350-4. CDC. Rubella and congenital rubella syndrome -- United States, January 1, 1991-May 7, 1994. MMWR 1994;43:391,397-401. CDC. Rubella among crew members of commercial cruise ships -- Florida, 1997. MMWR 1998;46:1247-50. Salmonellosis Van Beneden CA, Keene WE, Strang RA, et al. Multinational outbreak of Salmonella enterica serotype Newport infections due to contaminated alfalfa sprouts. JAMA 1999;281:158-62. Mahon BE, Slutsker L, Hutwagner L, et al. Consequences in Georgia of a nationwide outbreak of Salmonella infections: what you don't know might hurt you. Am J Public Health 1999;89:31-5. Glynn MK, Bopp C, Dewitt WK, Dabney P, Mokhtar M, Angulo FJ. Emergence of multidrug-resistant Salmonella enterica serotype Typhimurium DT104 infections in the United States. N Engl J Med 1998;338:1333-8. CDC. Multistate outbreak of Salmonella serotype Agona infections linked to toasted oats cereal -- United States, April-May, 1998. MMWR 1998;47:462-4. Shigellosis Sobel J, Cameron DN, Ismail J, et al. A prolonged outbreak of Shigella sonnei infections in traditionally observant Jewish communities in North America caused by a molecularly distinct bacterial subtype. J Infect Dis 1998;177:1405-8. Mohle-Boetani JC, Stapleton M, Finger R, et al. Communitywide shigellosis: control of an outbreak and risk factors in child day-care centers. Am J Public Health 1995;85:812-6. Ries AA, Wells JG, Olivola D, et al. Epidemic Shigella dysenteriae type 1 in Burundi: panresistance and implications for prevention. J Infect Dis 1994;169:1035-41. Lee LA, Shapiro CN, Hargrett-Bean N, Tauxe RV. Hyperendemic shigellosis in the United States: a review of surveillance data for 1967-1988. J Infect Dis 1991;164:894-900. Streptococcal Disease, Invasive, Group A CDC. Noscomial group A streptococcal infections associated with asymptomatic health-care workers -- Maryland and California, 1997. MMWR 1999;48:163-6. The Working Group on Prevention of Invasive Group A Streptococcal Infections. Prevention of invasive group A streptococcal disease among household contacts of case-patients: is prophylaxis warranted? JAMA 1998;279:1206-10. Davies HD, McGeer A, Schwartz B, et al. A prospective, population-based study of invasive group A streptococcal infections, including toxic shock syndrome and the risk of secondary infections. N Engl J Med 1996;335:547-54. Working Group on Severe Streptococcal Infections. Defining the group A streptococcal toxic shock syndrome: rationale and consensus definition. JAMA 1993;269:390-1. Streptococcal Disease, Invasive, Group B Schuchat A. Group B streptococcus [Review]. Lancet 1999;353:51-6. CDC. Adoption of hospital policies for prevention of perinatal group B streptococcal disease -- United States, 1997. MMWR 1998;47:665-70. Factor SH, Levine OS, Nassar A, et al. Impact of a risk-based prevention policy on neonatal group B streptococcal disease. Am J Obstet Gynecol 1998;179:1568-71. CDC. Decreasing incidence of perinatal group B streptococcal disease -- United States, 1993-1995. MMWR 1997;46:473-7. Streptococcus pneumoniae, Drug-Resistant Dowell SF, Butler JC, Giebink GS, et al. Acute otitis media: management and surveillance in an era of pneumococcal resistance -- a report from the Drug-Resistant Streptococcus pneumoniae Therapeutic Working Group [published erratum appears in Pediatr Infect Dis J 1999;18(4):341]. Pediatr Infect Dis J 1999;18:1-9. Dowell SF. Principles of judicious use of antimicrobial agents for pediatric upper respiratory tract infections. Pediatrics 1998;101(suppl):S163-S184. CDC. Defining the public health impact of drug-resistant Streptococcus pneumoniae: report of a working group. MMWR 1996;45(No. RR-1). Butler JC, Hofmann J, Cetron MS, et al. The continued emergence of drug-resistant Streptococcus pneumoniae in the United States: an update from the Centers for Disease Control and Prevention's Pneumococcal Sentinel Surveillance System. J Infect Dis 1996;174:986-93. Syphilis, Congenital Southwick KL, Guidry HM, Weldon MM, Mertz KJ, Berman SM, Levine WC. An epidemic of congenital syphilis in Jefferson County, Texas, 1994-1995: inadequate prenatal syphilis testing after an outbreak in adults. Am J Public Health 1999;89:557-60. Coles BF, Hipp SS, Silberstein GS, Chen JH. Congenital syphilis surveillance in upstate New York, 1989-1992: implications for prevention and clinical management. J Infect Dis 1995;171:732-5. CDC. Congenital syphilis -- United States, 1998. MMWR 1999;48;757-61. CDC. Guidelines for the prevention and control of congenital syphilis. MMWR 1988;37(No. S-1). Syphilis, Primary and Secondary Williams LA, Klausner JD, Whittington WL, Handsfield HH, Celum C, Holmes KK. Elimination and reintroduction of primary and secondary syphilis. Am J Public Health 1999;89:1093-7. CDC. Primary and secondary syphilis -- United States, 1998. MMWR 1999;48:873-8. St. Louis ME, Wasserheit JN. Elimination of syphilis in the United States. Science 1998;281:353-4. Nakashima AK, Rolfs RT, Flock ML, Kilmarx P, Greenspan JR. Epidemiology of syphilis in the United States, 1941-1993. Sex Transm Dis 1996;23:16-23. Tetanus Bardenheier B, Prevots R, Khetsuriani N, Wharton M. Tetanus surveillance-United States, 1995-1997. In: CDC surveillance summaries, July 3, 1998. MMWR 1998;47(No. SS-2):1-13. CDC. Neonatal tetanus -- Montana, 1998. MMWR 1998;47:928-30. CDC. Tetanus among injecting-drug users -- California, 1997. MMWR 1998;47:149-51. Gergen PJ, McQuillan GM, Kiely M, Ezzati-Rice TM, Sutter RW, Virella G. A population-based serologic survey of immunity to tetanus in the United States. N Engl J Med 1995;332:761-6. Toxic-Shock Syndrome Hajjeh RA, Reingold R, Weil A, Shutt K, Schuchat A, Perkins BA. Toxic shock syndrome in the United States: surveillance update, 1979-1996. Emerg Infect Dis 1999;5. Available on the Internet at http://www.cdc.gov/ncidod/eid/vol5no6/hajjeh.htm. Schuchat A, Broome CV. Toxic shock syndrome and tampons. Epidemiol Rev 1991;13:99-112. CDC. Reduced incidence of menstrual toxic shock syndrome -- United States, 1980-1990. MMWR 1990;39:421-3. Gaventa S, Reingold AL, Hightower AW, et al. Active surveillance for toxic shock syndrome in the United States, 1986. Reviews of Infectious Disease 1989;11(suppl):S28-S34. Trichinellosis (Trichinosis) Moorhead A, Grunenwald PE, Dietz VJ, Schantz PM. Trichinellosis in the United States, 1991-1996: declining but not gone. Am J Trop Med Hyg 1999;60:66-9. CDC. Outbreak of trichinellosis associated with eating cougar jerky -- Idaho, 1995. MMWR 1996;45:205-6. McAuley JB, Michelson MK, Schantz PM. Trichinosis surveillance, United States, 1987-1990. In: CDC surveillance summaries, December 1991. MMWR 1991;40(No. SS-3):35-42. Tuberculosis CDC. Recommendations for counting reported tuberculosis cases. In: Reported tuberculosis in the United States, 1996. Atlanta, GA: US Department of Health and Human Services, Public Health Service, CDC, 1997:61-8. American Thoracic Society, CDC. Treatment of tuberculosis and tuberculosis infection in adults and children. Am J Respir Crit Care Med 1994;149:1359-74. Typhoid Fever Mermin J, Villar R, Carpenter J, et al. A massive epidemic of multidrug-resistant typhoid fever in Tajikistan associated with consumption of municipal water. J Infect Dis 1999;179:1416-22. Mermin JH, Townes JM, Gerber M, Dolan N, Mintz ED, Tauxe RV. Typhoid fever in the United States, 1985-1994: changing risks of international travel and increasing antimicrobial resistance. Arch Intern Med 1998;158:633-8. CDC. Typhoid immunization. Recommendations of the Advisory Committee on Immunization Practices (ACIP). MMWR 1994;43(No. RR-14). Woodruff BA, Pavia AT, Blake PA. A new look at typhoid vaccination: information for the practicing physician. JAMA 1991;265:756-9. Varicella CDC. Evaluation of varicella reporting to the National Notifiable Disease Surveillance System -- United States, 1972-1997. MMWR 1999;48:55-8. CDC. Prevention of varicella. Updated recommendations of the Advisory Committee on Immunization Practices (ACIP). MMWR 1999:48(No. RR-6). CDC. Varicella-related deaths among children -- United States, 1997. MMWR 1998;47:365-8. CDC. Prevention of varicella. Recommendations of the Advisory Committee on Immunization Practices (ACIP). MMWR 1996;45(No. RR-11). Disclaimer All MMWR HTML versions of articles are electronic conversions from ASCII text into HTML. This conversion may have resulted in character translation or format errors in the HTML version. Users should not rely on this HTML document, but are referred to the electronic PDF version and/or the original MMWR paper copy for the official text, figures, and tables. An original paper copy of this issue can be obtained from the Superintendent of Documents, U.S. Government Printing Office (GPO), Washington, DC 20402-9371; telephone: (202) 512-1800. Contact GPO for current prices. **Questions or messages regarding errors in formatting should be addressed to mmwrq@cdc.gov.Page converted: 1/12/2000 |
|||||||||||||||||||||||||||||||||||||||||||||||||||||||||||||||||||||||||||||||||||||||||||||||||||||||||||||||||||||||||||||||||||||||||||||||||||||||||||||||||||||||||||||||||||||||||||||||||||||||||||||||||||||||||||||||||||||||||||||||||||||||||||||||||||||||||||||||||||||||||||||||||||||||||||||||||||||||||||||||||||||||||||||||||||||||||||||||||||||||||||||||||||||||||||||||||||||||||||||||||||||||||||||||||||||||||||||||||||||||||||||||||||||||||||||||||||||||||||||||||||||||||||||||||||||||||||||||||||||||||||||||||||||||||||||||||||||||||||||||||||||||||||||||||||||||||||||||||||||||||||||||||||||||||||||||||||||||||||||||||||||||||||||||||||||||||||||||||||||||||||||||||||||||||||||||||||||||||||||||||||||||||||||||||||||||||||||||||||||||||||||||||||||||||||||||||||||||||||||||||||||||||||||||||||||||||||||||||||||||||||||||||||||||||||||||||||||||||||||||||||||||||||||||||||||||||||||||||||||||||||||||||||||||||||||||||||||||||||||||||||||||||||||||||||||||||||||||||||||||
This page last reviewed 5/2/01
| |||||||||||||||||||||||||||||||||||||||||||||||||||||||||||||||||||||||||||||||||||||||||||||||||||||||||||||||||||||||||||||||||||||||||||||||||||||||||||||||||||||||||||||||||||||||||||||||||||||||||||||||||||||||||||||||||||||||||||||||||||||||||||||||||||||||||||||||||||||||||||||||||||||||||||||||||||||||||||||||||||||||||||||||||||||||||||||||||||||||||||||||||||||||||||||||||||||||||||||||||||||||||||||||||||||||||||||||||||||||||||||||||||||||||||||||||||||||||||||||||||||||||||||||||||||||||||||||||||||||||||||||||||||||||||||||||||||||||||||||||||||||||||||||||||||||||||||||||||||||||||||||||||||||||||||||||||||||||||||||||||||||||||||||||||||||||||||||||||||||||||||||||||||||||||||||||||||||||||||||||||||||||||||||||||||||||||||||||||||||||||||||||||||||||||||||||||||||||||||||||||||||||||||||||||||||||||||||||||||||||||||||||||||||||||||||||||||||||||||||||||||||||||||||||||||||||||||||||||||||||||||||||||||||||||||||||||||||||||||||||||||||||||||||||||||||||||||||||||||||