 |
|
|
|
|
|
|
| ||||||||||
|
|
|
|
|
|
|
||||
| ||||||||||
|
|
|
|
|
Persons using assistive technology might not be able to fully access information in this file. For assistance, please send e-mail to: mmwrq@cdc.gov. Type 508 Accommodation and the title of the report in the subject line of e-mail. Progress Toward Poliomyelitis Eradication -- India, 1998In 1988, the World Health Assembly resolved to eradicate poliomyelitis globally by 2000 (1). In 1995, India began to accelerate implementation of polio eradication strategies by conducting annual National Immunization Days (NIDs) * (2,3). In 1997, an active surveillance system for polio using acute flaccid paralysis (AFP) as a screening case definition was established. This report summarizes progress toward polio eradication, focusing on the implementation of supplemental vaccination activities and the establishment of sensitive surveillance. The findings suggest that NIDs in India have decreased previously widespread poliovirus circulation. Since 1995, NIDs have been conducted biannually during a single day each in December and in January (the low season for poliovirus transmission). NIDs in 1995 targeted children aged less than 3 years (three birth cohorts); however, the 1996-97 and 1997-98 NIDs have targeted children aged less than 5 years (five birth cohorts). These NIDs reached greater than 79 million children in 1995 and 134 million children in 1998 (Table_1). The Indian NIDs were synchronized with NIDs in other countries of south and east Asia, including Pakistan and China (4-7). In India in 1997, routine coverage of children aged 12-23 months with three doses of oral poliovirus vaccine was previously estimated as 89% nationally. However, more precise estimates available from surveys indicated national coverage was 73%, ranging from 5% in Bihar to greater than 95% in Maharashtra, Tamil Nadu, and several smaller states and union territories. National surveillance for AFP began in April 1997 and was enhanced by the posting of 59 surveillance medical officers (SMOs) in October 1997. These officers provide training, technical assistance, and logistic support to each of the 556 districts of India. By July 1998, approximately 7500 health-care institutions had been enrolled in a weekly reporting network, collecting epidemiologic and virologic information for each reported AFP case. Stool specimens collected from persons reported with AFP are forwarded to a network of nine World Health Organization (WHO)-accredited laboratories for poliovirus isolation studies; two of these laboratories also serve as reference laboratories for intratypic differentiation of poliovirus as wild or vaccine-derived strains. From January through July 1998, the surveillance network reported 3950 AFP cases (Table_2). Of these, 3432 (87%) were investigated within 48 hours of reporting, and 2233 (57%) had two stool specimens collected for virus culture within 14 days of illness onset. Of 5890 stool specimens collected, 5710 (97%) arrived in the laboratory in good condition for virologic studies. ** The results of clinical follow-up and virus isolation studies are used to classify AFP cases as polio or nonpolio. As of September 10, 1998, 2032 (72%) of 2813 persons with AFP cases eligible for 60-day follow-up (those with onset of illness during January-June 1998) have been examined for residual paralysis: 867 (43%) had no residual paralysis, 867 (43%) had residual paralysis, 73 (4%) were lost to follow-up, and 225 (11%) died. The reported annualized nonpolio AFP rate for January-June 1998 was 0.83 cases per 100,000 children aged less than 15 years, excluding 21% of AFP cases pending classification (Table_2). The number of reported polio cases decreased from 4729 in 1994 (before NIDs began) to 1005 in 1996, and increased to 2262 in 1997 (Figure_1). The increase in 1997 probably was due to improved surveillance and a large outbreak of polio in Uttar Pradesh with 1150 reported cases. As of September 10, 1998, 849 AFP cases reported in 1998, representing 281 districts, have been confirmed as polio. Poliovirus types 1 and 3 continue to circulate, but preliminary results of genetic sequencing show a substantial decrease in their genetic biodiversity, suggesting that many independent lineages of poliovirus genotypes are being eliminated (Dr. J.M. Deshpande, Enterovirus Research Center, Haffkine Institute, Mumbai, personal communication, 1998). Four isolates of type 2 poliovirus were last isolated in India in 1996. As of September 10, there were 183 isolates of wild poliovirus in 1998, with 162 (89%) identified as type 1, one (1%) as type 2, and 20 (11%) as type 3. In addition, 180 isolates are pending differentiation as wild or vaccine strains. Of 374 isolates differentiated in 1998, 278 (74%) have been wild strains. Reported by: S Sarkar, MD, Ministry of Health and Family Welfare, Government of India. India Office, and Regional Office for South-East Asia, New Delhi, India; Global Program for Vaccines and Immunization, World Health Organization, Geneva, Switzerland. Respiratory and Enteric Viruses Br, Div of Viral and Rickettsial Diseases, National Center for Infectious Diseases; Vaccine Preventable Disease Eradication Div, National Immunization Program, CDC. Editorial NoteEditorial Note: Progress toward polio eradication in India, the second most populous country in the world, is critical for the success of the global polio eradication initiative. India has completed 3 years of successful NIDs -- representing the largest public health campaigns ever conducted in a single country -- followed by reduction in genetic biodiversity of circulating poliovirus types 1 and 3. The persistance of poliovirus type 2 and wide distribution of the remaining type 1 and 3 strains suggest that substantially increased efforts will be required to eradicate polio by 2000. Routine vaccination coverage in some areas must be improved, and the intensity of vaccination efforts during NIDs will need to increase to reach areas with children missed by previous NIDs. As the circulation of polioviruses becomes more focal (especially during the low transmission season), identification and targeting of these areas for supplemental vaccination activities, especially house-to-house vaccination, increasingly will depend on sensitive and timely surveillance. Surveillance data were used for the first time to target areas in three districts of Maharashtra State for supplemental vaccination activities during April-May 1998. To prepare for NIDs in 1998-99, SMOs are assisting state immunization officers in obtaining sufficient resources for planning, vaccine, and operational costs of house-to-house vaccination in districts identified as at risk for continuing wild poliovirus transmission. This intensified NID strategy should accelerate progress toward the final stage of polio eradication. Although the experience in other countries suggests that it takes 3-4 years to develop an adequate AFP surveillance system, the experience in India suggests that this period can be shortened substantially if sufficient resources and trained personnel are made available. Fewer than 850 days remain to reach the target for global polio eradication. Globally, further progress is dependent on expanding the polio eradication strategies to all remaining countries where polio is endemic and providing adequate funding *** in support of these strategies (8). The progress reported from India, the world's largest country where polio remains endemic, indicates that polio eradication can be achieved worldwide by 2000. References
* Mass vaccination campaigns over a short period (usually days to weeks) in which two doses of oral poliovirus vaccine are administered to all children aged less than 5 years, regardless of previous vaccination history, with an interval of 4-6 weeks between doses. ** Good condition means that on arrival, 1) ice or frozen icepacks or a temperature indicator (showing less than 46 F { less than 8 C}) is in the container, 2) the specimen volume is adequate ( greater than 5 g), 3) no evidence of leakage or desiccation is present, and 4) appropriate documentation (laboratory request/reporting form) is completed. *** The polio eradication initiative in India is supported by the government of India; WHO; United Nations Children's Fund (UNICEF); the governments of Japan, Denmark, and Germany; U.S. Agency for International Development; CDC; and Rotary International. Table_1 Note: To print large tables and graphs users may have to change their printer settings to landscape and use a small font size.
TABLE 1. Number of children vaccinated and percentage of oral poliovirus vaccine coverage achieved during National
Immunization Days (NIDs)* -- India, 1995-1998
=====================================================================================================================
NIDs        Round (Date)    Target age group   No. vaccinated   Coverage with 2 doses+   Coverage with 1 dose+
---------------------------------------------------------------------------------------------------------------------
1995-96    1 (December 9)       <3 years          79,300,000             85.5%                   98.4%
           2 (January 20)                         85,400,000
1996-97    1 (December 7)       <5 years         117,400,000             93.3%                   98.3%
           2 (January 18)                        127,400,000
1997-98    1 (December 7)       <5 years         127,000,000             92.1%                   96.6%
           2 (January 18)                        134,000,000
---------------------------------------------------------------------------------------------------------------------
* Mass vaccination campaigns over a short period (usually days to weeks) in which two doses
  of oral poliovirus vaccine are administered to all children aged <5 years, regardless of previous
  vaccination history, with an interval of 4-6 weeks between doses.
+ Proportion of targeted children as estimated by survey.
=====================================================================================================================
Return to top. Table_2 Note: To print large tables and graphs users may have to change their printer settings to landscape and use a small font size.
TABLE 2. Number and rate of reported poliomyelitis and acute flaccid paralysis (AFP) cases, nonpolio AFP rate, and stool specimen results, by year --
India, 1995-1998
========================================================================================================================================================
    Serotype distribution of
    wild poliovirus isolated
         No. polio or AFP     No. confirmed polio       Overall AFP           Nonpolio AFP        No. polio or AFP cases     ---------------------------
Year      cases reported            cases*            reporting rate+        reporting rate+       with stool specimens&       P1       P2      P3
--------------------------------------------------------------------------------------------------------------------------------------------------------
1995           3263                  3263                   0.95                    0                       NA@               117**    44**    60**
1996           1005                  1005                   0.29                    0                       NA                 95**     6**    17**
1997           3050                  2262                   0.89                  0.23                     1370               398++     3++    50++
1998           3950&&                 829&&                 1.92@@                0.83***                  2503               162++     1++    20++
--------------------------------------------------------------------------------------------------------------------------------------------------------
*   All polio cases reported before 1997 were confirmed by attending physicians with no
    standard case definition.
+   Per 100,000 children aged <15 years.
&   One or two specimens within 14 days of onset.
@   Not available.
**  Aggregate data indicating the number of isolates reported to the World Health Organization, not the number of cases with wild poliovirus isolated.
++  Number of cases with wild poliovirus isolated.
&&  January-July, as of September 10, 1998.
@@  Annualized rate.
*** Annualized from cases reported during January-June (allows 60 days for classification); does not include 21% of AFP cases pending classification.
========================================================================================================================================================
Return to top. Figure_1 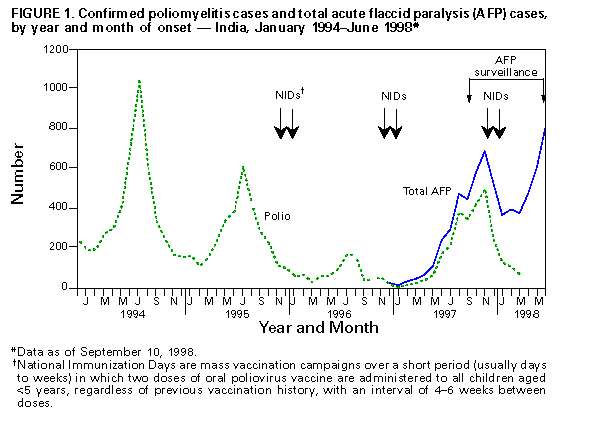 Return to top. Disclaimer All MMWR HTML versions of articles are electronic conversions from ASCII text into HTML. This conversion may have resulted in character translation or format errors in the HTML version. Users should not rely on this HTML document, but are referred to the electronic PDF version and/or the original MMWR paper copy for the official text, figures, and tables. An original paper copy of this issue can be obtained from the Superintendent of Documents, U.S. Government Printing Office (GPO), Washington, DC 20402-9371; telephone: (202) 512-1800. Contact GPO for current prices. **Questions or messages regarding errors in formatting should be addressed to mmwrq@cdc.gov.Page converted: 10/06/98 |
|||||||||
This page last reviewed 5/2/01
|