 |
|
|
|
|
|
|
| ||||||||||
|
|
|
|
|
|
|
||||
| ||||||||||
|
|
|
|
|
Persons using assistive technology might not be able to fully access information in this file. For assistance, please send e-mail to: mmwrq@cdc.gov. Type 508 Accommodation and the title of the report in the subject line of e-mail. Summary of Notifiable Diseases, United States, 1995Foreword This publication contains summary tables of the official statistics for the reported occurrence of nationally notifiable diseases in the United States for 1995. These statistics are collected and compiled from reports to the National Notifiable Diseases Surveillance System (NNDSS), which is operated by CDC in collaboration with the Council of State and Territorial Epidemiologists (CSTE). Because the dates of onset and dates of diagnosis for notifiable diseases may not always be reported, these surveillance data are presented by the week that they were reported to CDC by public health officials in state and territorial health departments. These data are finalized and published in the MMWR Summary of Notifiable Diseases, United States for use by state and local health departments; schools of medicine and public health; communications media; local, state, and federal agencies; and other agencies or persons interested in following the trends of reportable diseases in the United States. The annual publication of the Summary also documents which diseases are considered national priorities for notification and the annual number of cases of such diseases. Part 1 contains information regarding morbidity for each of the diseases considered nationally notifiable during 1995. The tables provide the number of cases of notifiable diseases reported to CDC for 1995, as well as the distribution of cases by month and geographic location and by patient's age, sex, race, and Hispanic ethnicity. The data are final totals as of July 26, 1996, unless otherwise noted. There were no reported cases of anthrax, diphtheria, and yellow fever in the United States during 1995; thus, these three nationally notifiable diseases do not appear in the tables in Part 1. In all tables, leprosy is listed as Hansen disease and tickborne typhus fever is listed as Rocky Mountain spotted fever (RMSF). Part 2 contains graphs and maps. These graphs and maps depict summary data for many of the notifiable diseases that are described in tabular form in Part 1. Part 3 includes tables that list the number of cases of notifiable diseases reported to CDC since 1966. It also includes a table enumerating deaths associated with specified notifiable diseases that were reported to the National Center for Health Statistics, CDC, during 1984-1993. Background As of January 1, 1995, 49 infectious diseases were designated as notifiable at the national level. A notifiable disease is one for which regular, frequent, and timely information regarding individual cases is considered necessary for the prevention and control of the disease. This section briefly summarizes the history of the reporting of nationally notifiable diseases in the United States. In 1878, Congress authorized the U.S. Marine Hospital Service (i.e., the forerunner of the Public Health Service {PHS}) to collect morbidity reports regarding cholera, smallpox, plague, and yellow fever from U.S. consuls overseas; this information was to be used for instituting quarantine measures to prevent the introduction and spread of these diseases into the United States. In 1879, a specific Congressional appropriation was made for the collection and publication of reports of these notifiable diseases. The authority for weekly reporting and publication of these reports was expanded by Congress in 1893 to include data from states and municipal authorities. To increase the uniformity of the data, Congress enacted a law in 1902 directing the Surgeon General to provide forms for the collection and compilation of data and for the publication of reports at the national level. In 1912, state and territorial health authorities -- in conjunction with PHS -- recommended immediate telegraphic reporting of five infectious diseases and the monthly reporting, by letter, of 10 additional diseases. The first annual summary of The Notifiable Diseases in 1912 included reports of 10 diseases from 19 states, the District of Columbia, and Hawaii. By 1928, all states, the District of Columbia, Hawaii, and Puerto Rico were participating in national reporting of 29 specified diseases. At their annual meeting in 1950, the State and Territorial Health Officers authorized a conference of state and territorial epidemiologists whose purpose was to determine which diseases should be reported to PHS. In 1961, CDC assumed responsibility for the collection and publication of data concerning nationally notifiable diseases. The list of nationally notifiable diseases is revised periodically. For example, a disease may be added to the list as a new pathogen emerges, or a disease may be deleted as its incidence declines. Public health officials at state health departments and CDC continue to collaborate in determining which diseases should be nationally notifiable; CSTE, with input from CDC, makes recommendations annually for additions and deletions to the list of nationally notifiable diseases. However, reporting of nationally notifiable diseases to CDC by the states is voluntary. Reporting is currently mandated (i.e., by state legislation or regulation) only at the state level. The list of diseases that are considered notifiable, therefore, varies slightly by state. All states generally report the internationally quarantinable diseases (i.e., cholera, plague, and yellow fever) in compliance with the World Health Organization's International Health Regulations. CSTE and CDC held a national surveillance conference November 30- December 2, 1994, to review the state of national surveillance for infectious diseases. Conditions that were approved for addition to national surveillance during 1995 are genital infections caused by Chlamydia trachomatis, coccidioidomycosis (for regional surveillance), cryptosporidiosis, hantavirus pulmonary syndrome (HPS), (post-diarrheal) hemolytic-uremic syndrome (HUS), pediatric infection with the human immunodeficiency virus (HIV), invasive group A streptococcal infections, streptococcal toxic-shock syndrome, and invasive infections caused by drug-resistant Streptococcus pneumoniae. These conditions currently are not reportable in all states, and the mechanism for reporting them may not involve clinicians or consist of reports of individual cases, which are the traditional reporting mechanisms. Reports of the number of cases of these conditions -- with the exception of genital infections caused by Chlamydia trachomatis (which has been reportable in many states for a number of years) -- will not appear in the current summary tables; they will, however appear in the 1996 annual summary. At the 1994 conference, the following diseases were also proposed as deletions from the list of infectious diseases under national surveillance: amebiasis, aseptic meningitis, primary encephalitis (except for arboviral encephalitis), postinfectious encephalitis, granuloma inguinale, unspecified hepatitis, leptospirosis, lymphogranuloma venereum, rheumatic fever, and tularemia. These changes were confirmed by a vote of the full membership of CSTE in early 1995. The number of reported cases of these diseases will not appear in the summary tables for 1995 or for future years. The list of 52 infectious diseases that were designated as notifiable at the national level at the end of 1995 appears below: * Acquired immunodeficiency syndrome (AIDS) Anthrax Botulism ** Brucellosis Chancroid Chlamydia trachomatis, genital infection Cholera Coccidioidomycosis ** Congenital rubella syndrome Congenital syphilis Cryptosporidiosis Diphtheria Encephalitis, California Encephalitis, eastern equine Encephalitis, St. Louis Encephalitis, western equine Escherichia coli O157:H7 Gonorrhea Haemophilus influenzae, invasive disease Hansen disease (leprosy) Hantavirus pulmonary syndrome Hemolytic-uremic syndrome, post-diarrheal ** Hepatitis A Hepatitis B Hepatitis, C/non-A, non-B HIV infection, pediatric (i.e., in persons ages less than 13 years) Legionellosis Lyme disease Malaria Measles Meningococcal disease Mumps Pertussis Plague Poliomyelitis, paralytic Psittacosis Rabies, animal Rabies, human Rocky Mountain spotted fever Rubella Salmonellosis ** Shigellosis ** Streptococcal disease, invasive, group A ** Streptococcus pneumoniae, drug-resistant ** Streptococcal toxic-shock syndrome ** Syphilis Tetanus Toxic-shock syndrome Trichinosis Tuberculosis Typhoid fever Yellow fever **
Data Sources Provisional data concerning the reported occurrence of notifiable diseases are published weekly in MMWR. After each reporting year, staff in state health departments finalize reports of cases for that year with local or county health departments and reconcile the data with reports previously sent to CDC throughout the year; these data are compiled in final form in this summary. Notifiable disease reports are published in the annual MMWR Summary of Notifiable Diseases only after approval by the appropriate epidemiologist from each submitting state or territory and are the authoritative and archival counts of cases. Data published in MMWR Surveillance Summaries or other surveillance reports produced by CDC programs, which are useful for detailed epidemiologic analyses, may not agree exactly with data reported in the annual Summary of Notifiable Diseases because of differences in the timing of reports, the source of the data, and the use of different case definitions. Data in this summary were derived primarily from reports transmitted to the Division of Surveillance and Epidemiology, Epidemiology Program Office, CDC, by the health departments of 50 states, two cities, and five territories through the National Electronic Telecommunications System for Surveillance (NETSS). Final data for other diseases are from the surveillance-program records of the following CDC programs (requests for further information regarding these data should be directed to the source specified): National Center for Health Statistics Office of Vital and Health Statistics Systems (deaths from selected notifiable diseases) National Center for Infectious Diseases Division of Bacterial and Mycotic Diseases (toxic-shock syndrome and laboratory data regarding botulism, Escherichia coli O157:H7, Salmonella, Shigella, and penicillin-nonsusceptible S. pneumoniae {PNSP}) Division of HIV/AIDS Division of Vector-Borne Infectious Diseases (laboratory data regarding arboviral encephalitis) Division of Viral and Rickettsial Diseases (animal rabies) National Center for HIV, STD, and TB Prevention (NCHSTP) Division of Sexually Transmitted Diseases Prevention (chancroid, chlamydia, gonorrhea, and syphilis) Division of Tuberculosis Elimination (tuberculosis) National Immunization Program Epidemiology and Surveillance Division (poliomyelitis) Disease totals for the United States, unless otherwise stated, do not include data for American Samoa, Guam, Puerto Rico, the Virgin Islands, and the Commonwealth of the Northern Mariana Islands (CNMI). Disease totals from American Samoa were unavailable for 1995. Population estimates for states are based on the July 1, 1995, post-censal estimates made by the U.S. Department of Commerce, Bureau of the Census, Population Division, Population Estimates Branch, Press Release CB94-204. Because these estimates are unavailable by age and sex for 1995, rates for reported disease occurrences by age group and among males and females use population totals from the July 1, 1993, post-censal estimates. Population estimates for territories are from the 1990 census, U.S. Department of Commerce, Bureau of the Census, Press Releases CB91-142, 242, 243, 263, and 276. Rates in the 1995 Summary of Notifiable Diseases were based on data for the U.S. total-resident population. However, population data from states in which diseases were not notifiable or disease data were not available were excluded from rate calculations. Interpreting Data The data reported in this summary are useful for analyzing disease trends and determining relative disease burdens. However, these data must be interpreted in light of reporting practices. Some diseases that cause severe clinical illness (e.g., plague or rabies), if diagnosed by a clinician, are likely to be reported accurately. However, persons who have diseases that are clinically mild and infrequently associated with serious consequences (e.g., salmonellosis) may not even seek medical care from a health-care provider; even if these less severe diseases are diagnosed, they are less likely to be reported. The degree of completeness of reporting also is influenced by the diagnostic facilities that are available; the control measures that are in effect; the public awareness of a specific disease; and the interests, resources, and priorities of state and local officials responsible for disease control and public health surveillance. Finally, factors such as changes in the case definitions for public health surveillance, the introduction of new diagnostic tests, or the discovery of new disease entities may cause changes in disease reporting that are independent of the true incidence of disease. Public health surveillance data are published for selected racial and ethnic population groups because these variables may be risk markers for certain notifiable diseases. Risk markers can identify potential risk factors for investigation in future studies. Data regarding race and ethnicity also can be useful for identifying groups to target for prevention efforts. However, caution must also be used when drawing conclusions from reported data relating to race and ethnicity. Among certain races and ethnicities, there are likely to be differential patterns of access to health care, interest in seeking health care, and detection of disease that would lead to data that are not representative of disease incidence in these populations. In addition, not all data concerning race and ethnicity are collected uniformly for all diseases. For example, the Division of HIV/AIDS Prevention and the Division of STD Prevention in NCHSTP collect information regarding race and ethnicity using a single variable instead of two separate variables. A person's racial and ethnic background is reported as either American Indian/Alaskan Native, Asian/Pacific Islander, Black non-Hispanic, White non-Hispanic, or Hispanic. Additionally, although the recommended standard for classifying a person's race or ethnicity is based on self-reporting, it is not clear that this procedure is always followed. Highlights for Selected Infectious Diseases Arboviral Encephalitis In 1995, a case of encephalitis caused by Cache Valley virus was reported in North Carolina. Although this mosquito-borne bunyavirus was previously known to cause subclinical infections in humans, no clinical cases had been recognized previously. Coccidioidomycosis In 1995, the CSTE recommended that coccidioidomycosis become a regionally reportable disease. Because the Emerging Infectious Program at the National Center for Infectious Diseases (NCID/CDC), in collaboration with the State of California Department of Health Services, has been conducting active surveillance for coccidioidomycosis in Kern County, California, for some time, its data are presented. The total number of coccidioidomycosis cases reported to the Kern County Health Department during 1995 was 770; this represents a drop in the number of cases when compared with the large number reported in the epidemic years during 1991- 1994 (e.g., during 1992, a peak of 3,342 cases occurred in Kern County alone). Creutzfeldt-Jakob Disease Creutzfeldt-Jakob disease (CJD) is a subacute, degenerative disease of the brain that is classified as a transmissible, spongiform encephalopathy. More than 85% of CJD patients die within 1 year of onset. From 1979 through 1994, there were 3,642 CJD-related deaths in the United States (based on national data concerning multiple causes of death and a preliminary total of 280 deaths in 1994). The average annual age-adjusted death rate attributed to CJD is 0.95 deaths per million persons. As of September 15, 1996, evidence does not indicate that cases of the newly described variant of CJD (i.e., the type identified in the United Kingdom) have occurred in the United States. This evidence is based on the analysis of both national data and data from active, retrospective surveillance for CJD conducted since 1991 by special surveillance teams in five areas of the country (1993 population: 16.3 million persons). Cryptosporidiosis National reporting of cryptosporidiosis began in 1995. During 1995, it was reportable in 24 of 50 states; however, many other states have made or are in the process of making cryptosporidiosis a notifiable disease. Because the diagnosis of cryptosporidiosis is often not considered, and because most laboratories do not routinely test for Cryptosporidium infection, cryptosporidiosis will continue to be underdiagnosed and underreported. Dengue and Dengue Hemorrhagic Fever In 1995, most tropical countries in the Americas reported major outbreaks of dengue and dengue hemorrhagic fever (DHF). During this period, the Pan American Health Organization received reports of over 250,000 total cases of dengue and DHF from member countries. This was the largest number reported since 1981, when the worst epidemic in the Americas occurred in Cuba. As a result of this widespread activity, the number of laboratory-positive cases of imported dengue in the United States increased to 86 in 1995 from 37 in 1994. During 1995, the Texas State Health Department reported eight laboratory-positive cases resulting from local transmission by Aedes aegypti mosquitoes. Dengue transmission in the continental United States had not been reported since 1986. Hantavirus Pulmonary Syndrome Hantavirus pulmonary syndrome (HPS) is now recognized as a pan-American viral zoonosis caused by Sin Nombre virus and other New World hantaviruses. The identified rodent reservoirs for these viruses are as follows: Peromyscus maniculatus and P. leucopus (deer mouse and white-footed mouse, respectively) for Sin Nombre virus and its variants; Sigmodon hispidus (cotton rat) for Black Creek Canal virus; and Oryzomys palustris (rice rat) for Bayou virus. Cases of HPS have been found throughout the continental United States, in Canada, and in South America. As of August 22, 1996, national surveillance for HPS has identified 143 confirmed case-patients in 25 states (case-fatality rate: 50.2%); 23 of these cases occurred in 1995. Hemolytic-Uremic Syndrome Infection caused by Shiga toxin-producing E. coli (i.e., STEC), especially serotype O157:H7, is the leading cause of hemolytic-uremic syndrome (HUS) in the United States. Although an estimated 1,200 HUS cases caused by infectious agents occur in the United States each year, the absence of longstanding surveillance data has limited the assessment of HUS as a public health problem. When surveyed in August 1994, only 15 states listed HUS as a notifiable disease. Recent efforts to improve surveillance include the creation of a unique International Classification of Diseases code for HUS; the adoption of a uniform, post-diarrheal case definition for HUS by the CSTE; and the recommendation by CSTE, in 1995, that HUS be made a notifiable disease in all states. Efforts are also underway to establish active surveillance for HUS in selected states. HIV Infection in Children and Infants In 1994, results of the AIDS Clinical Trials Group Protocol 076 indicated that administering zidovudine to a selected group of pregnant, HIV-infected women, and subsequently to their newly born infants, reduced the risk for perinatal HIV transmission to these infants by two thirds. The U.S. Public Health Service (USPHS) subsequently issued guidelines for the use of zidovudine to reduce perinatal transmission of HIV (MMWR 1994;43{No. RR-11}:1-20) and the routine counseling and voluntary HIV testing of all pregnant women (MMWR 1995;44{No. RR-7}:1-15). USPHS also issued revised guidelines on PCP prophylaxis for children (MMWR 1995;44 {No. RR-4}:1-11) that recommends each child born to an HIV-infected mother receive PCP prophylaxis until the child's HIV status is determined. States that conduct surveillance of pediatric HIV exposure/infection should be able to evaluate the implementation and impact of these guidelines most effectively and enhance early identification of HIV status in infants. In 1995, 28 states conducted surveillance of HIV infection in children. These states reported 332 HIV-infected children who had not progressed to acquired immunodeficiency syndrome (AIDS) and 229 children who had AIDS. Penicillin-Nonsusceptible S. pneumoniae The prevalence of cases of penicillin-nonsusceptible S. pneumoniae * (PNSP) among invasive pneumococcal infections in selected metropolitan areas for 1995 is presented. In these areas, population-based active surveillance for all invasive pneumococcal infections is ongoing; in each of the regions, the denominator reflects greater than 100 cases of invasive pneumococcal disease. The prevalence of PNSP from hospital to hospital within each metropolitan area varied widely, suggesting that sentinel hospitals may not accurately reflect the prevalence of PNSP within a given city, let alone for the entire state. In addition, the prevalence of PNSP cases can increase rapidly (e.g., the prevalence of PNSP cases for Atlanta was 25% in 1994 and 33% in 1995). Prevalence of PNSP among invasive Active surveillance area pneumococcal infections -------------------------------------------------------------------- - State of Connecticut ** 10%-19% Baltimore, MD Minneapolis/St. Paul, MN ** San Francisco, CA Portland, OR ** 20%-29% San Antonio, TX Atlanta, GA >= 30% Urban counties, TN *** * S. pneumoniae isolates with penicillin minimum inhibitory concentration greater than or equal to 0.125 mg/mL. ** These figures are based on data from less than 1 year. *** Includes the metropolitan areas of Chattanooga, Knoxville, Memphis, and Nashville, Tennessee. International Notes Ebola Hemorrhagic Fever In 1995, an outbreak of Ebola hemorrhagic fever (EHF) caused by the Zaire subtype of Ebola virus occurred in Kikwit, Zaire. A total of 316 cases of EHF were confirmed, resulting in 244 deaths (case-fatality rate: 77%). Case-patients ranged in age from 3 days to 71 years (median age: 35 years), and slightly more than half of the case-patients (i.e., 53%) were female. The earliest identified case occurred in January, and the epidemic peaked in May 1995. In December 1995, a single case of EHF occurred in Cote d'Ivoire and was caused by the recently recognized Ivory Coast subtype of Ebola virus. The natural reservoir of Ebola virus remains unknown. PART 1: Summaries of Notifiable Diseases in the United States EXPLANATION OF SYMBOLS USED IN TABLES, GRAPHS, AND MAPS Data not available ............................................. NA Report of disease is not required in that jurisdiction (not notifiable) ............................................NN No reported cases ............................................... Table_A NOTIFIABLE DISEASES -- Summary of reported cases, by month, United States, 1995 Table_B1 NOTIFIABLE DISEASES Reported cases, by geographic division and area, United States, 1995 Table_B2 NOTIFIABLE DISEASES Reported cases, by geographic division and area, United States, 1995 (continued) Table_B3 NOTIFIABLE DISEASES Reported cases, by geographic division and area, United States, 1995 (continued) Table_B4 NOTIFIABLE DISEASES Reported cases, by geographic division and area, United States, 1995 (continued) Table_B5 NOTIFIABLE DISEASES Reported cases, by geographic division and area, United States, 1995 (continued) Table_B6 NOTIFIABLE DISEASES Reported cases, by geographic division and area, United States, 1995 (continued) Table_C NOTIFIABLE DISEASES -- Summary of reported cases, by age group, United States, 1995 Table_D NOTIFIABLE DISEASES -- Summary of reported cases, by sex, United States, 1995 Table_E NOTIFIABLE DISEASES -- Summary of reported cases, by race, United States, 1995 Table_F NOTIFIABLE DISEASES -- Summary of reported cases, by ethnicity, United States, 1995 PART 2: Graphs and Maps for Selected Notifiable Diseases in the United States EXPLANATION OF SYMBOLS USED IN TABLES, GRAPHS, AND MAPS Data not available.............................................. NA Report of disease is not required in that jurisdiction (not notifiable) ........................................... NN No reported cases .............................................. Figure_1 ACQUIRED IMMUNODEFICIENCY SYNDROME (AIDS) -- reported cases, by quarter, United States, 1984-1995 Figure_2 ACQUIRED IMMUNODEFICIENCY SYNDROME (AIDS) -- reported cases, per 100,000 population, United States and Puerto Rico, 1995 Figure_3 ACQUIRED IMMUNODEFICIENCY SYNDROME (AIDS) -- reported pediatric cases, United States and Puerto Rico, 1995 Figure_4 ARBOVIRAL INFECTIONS (of the central nervous system) -- reported laboratory-confirmed cases caused by California serogroup viruses, by month of onset, United States, 1986 1995 Figure_5 ARBOVIRAL INFECTIONS (of the central nervous system) -- reported laboratory-confirmed cases caused by eastern equine encephalitis virus, by month of onset, United States, 1986 1995 Figure_6 ARBOVIRAL INFECTIONS (of the central nervous system) -- reported laboratory-confirmed cases caused by St. Louis encephalitis virus, by month of onset, United States, 1986 1995 Figure_7 ARBOVIRAL INFECTIONS (of the central nervous system) -- reported laboratory-confirmed cases caused by western equine encephalitis virus, by month of onset, United States, 1986 1995 Figure_8 BOTULISM (foodborne) -- by year, United States, 1975 1995 Figure_9 BOTULISM (infant) -- by year, United States, 1975 1995 Figure_10 BRUCELLOSIS -- by year, United States, 1965 1995 Figure_11 CHLAMYDIA -- reported cases among women, per 100,000 population, United States, 1995 Figure_12 CHOLERA -- reported cases, United States and territories, 1995 Figure_13 DIPHTHERIA -- by year, United States, 1965 1995 Figure_14 ESCHERICHIA COLI O157:H7 -- reported cases, United States and territories, 1995 Figure_15 ESCHERICHIA COLI O157:H7 -- reported isolates, United States, 1995 Figure_16 GONORRHEA -- reported cases, per 100,000 population, United States, 1995 Figure_17 GONORRHEA -- by sex, United States, 1981 1995 Figure_18 GONORRHEA -- by race and ethnicity, United States, 1981 1995 Figure_19 HAEMOPHILUS INFLUENZAE, INVASIVE -- by age group, United States, 1995 Figure_20 HANSEN DISEASE (LEPROSY) -- by year, United States, 1965 1995 Figure_21 HEPATITIS -- by year, United States, 1965 1995 Figure_22 HEPATITIS A -- reported cases, per 100,000 population, United States and territories, 1995 Figure_23 HEPATITIS B -- reported cases, per 100,000 population, United States and territories, 1995 Figure_24 LEGIONELLOSIS -- by year, United States, 1980 1995 Figure_25 LYME DISEASE -- reported cases, per 100,000 population, United States and territories, 1995 Figure_26 MALARIA -- by year, United States, 1965 1995 Figure_27 MEASLES (rubeola) -- by year, United States, 1960 1995 Figure_28 MENINGOCOCCAL DISEASE -- by year, United States, 1965 1995 Figure_29 MUMPS -- by year, United States, 1968 1995 Figure_30 PERTUSSIS (whooping cough) -- by year, United States, 1965 1995 Figure_31 PERTUSSIS (whooping cough) -- by age group, United States, 1995 Figure_32 PLAGUE -- among humans, by year, United States, 1965 1995 Figure_33 POLIOMYELITIS (paralytic) -- by year, United States, 1965 1995 Figure_34 PSITTACOSIS -- by year, United States, 1965 1995 Figure_35 RABIES -- wild and domestic animals, by year, United States and Puerto Rico, 1965 1995 Figure_36 ROCKY MOUNTAIN SPOTTED FEVER (RMSF) -- by year, United States, 1965 1995 Figure_37 RUBELLA (German measles) -- by year, United States, 1966 1995 Figure_38 SALMONELLOSIS (excluding typhoid fever) -- by year, United States, 1965 1995 Figure_39 SALMONELLA -- serotype of isolate by year, United States, 1970 1995 Figure_40 SHIGELLOSIS -- by year, United States, 1965 1995 Figure_41 SHIGELLA -- species of isolate by year, United States, 1970 1995 Figure_42 SYPHILIS (primary and secondary) -- reported cases, per 100,000 population, United States, 1995 Figure_43 SYPHILIS (primary and secondary) -- by sex, United States, 1981 1995 Figure_44 SYPHILIS (primary and secondary) -- by race, United States, 1981 1995 Figure_45 CONGENITAL SYPHILIS -- in infants <1 year of age, United States, 1965 1995 Figure_46 TETANUS -- by year, United States, 1965 1995 Figure_47 TOXIC-SHOCK SYNDROME (TSS) -- by quarter, United States, 1980 1995 Figure_48 TRICHINOSIS -- by year, United States, 1965 1995 Figure_49 TUBERCULOSIS -- reported cases, per 100,000 population, United States and territories, 1995 Figure_50 TUBERCULOSIS -- by year, United States, 1975 1995 Figure_51 TUBERCULOSIS -- by year, among persons born in the United States and foreign-born persons, United States, 1986 1995 Figure_52 TYPHOID FEVER -- by year, United States, 1965 1995 Figure_53 VARICELLA (chickenpox) -- by month, United States, 1987 1995 PART 3: Historical Summary Tables Table_1 TABLE 1. NOTIFIABLE DISEASES -- summary of reported cases, per 100,000 population, United States, 1986-1995 Table_2 TABLE 2. NOTIFIABLE DISEASES -- summary of reported cases, United States, 1988-1995 Table_3 TABLE 3. NOTIFIABLE DISEASES -- summary of reported cases, United States, 1980-1987 Table_4 TABLE 4. NOTIFIABLE DISEASES -- summary of reported cases, United States, 1972-1979 Table_5 TABLE 5. NOTIFIABLE DISEASES -- summary of reported cases, United States, 1966-1971 Table_6 TABLE 6. NOTIFIABLE DISEASES -- deaths from selected diseases, United States, 1984-1993. (Numbers in ICD column refer to the category numbers listed in the Ninth Revision of the International Classification of Diseases, 1994.) Bibliography General Benenson AS. Control of communicable diseases in man. 16th ed. Washington, DC: American Public Health Association, 1995. CDC. Mandatory reporting of infectious diseases by clinicians, and mandatory reporting of occupational diseases by clinicians. MMWR 1990;39(No. RR-9). CDC. Case definitions for public health surveillance. MMWR 1990;39 (No. RR-13). CDC. Update: graphic method for presentation of notifiable disease data -- United States, 1991. MMWR 1991;40:124-5. CDC. National electronic telecommunications system for surveillance -- United States, 1990-1991. MMWR 1991;40:502. CDC. Use of race and ethnicity in public health surveillance. MMWR 1993;42 (No. RR-10). CDC. Sexually transmitted disease surveillance, 1993. Atlanta: US Department of Health and Human Services, Public Health Service, 1994. CDC. Manual of procedures for the reporting of nationally notifiable diseases to CDC. Atlanta: US Department of Health and Human Services, Public Health Service, CDC, 1995. Koo D, Wetterhall SF. History and current status of the National Notifiable Diseases Surveillance System. J Public Health Management and Practice 1996;2:4-10. Martin SM, Bean NH. Data management issues for emerging diseases and new tools for managing surveillance and laboratory data. EID 1995;1:124-8. Stroup DF, Wharton M, Kafadar K, Dean AG. An evaluation of a method for detecting aberrations in public health surveillance data. Am J Epidemiol 1993;137:373-80. Teutsch SM, Churchill RE, eds. Principles and practice of public health surveillance. New York: Oxford University Press, 1994. Thacker SB, Choi K, Brachman PS. The surveillance of infectious diseases. JAMA 1983; 249:1181-5. Thacker SB, Stroup DF. Future directions for comprehensive public health surveillance and health information systems in the United States. Am J Epidemiol 1994;140:383-97. AIDS CDC. Update: AIDS among women -- United States, 1994. MMWR 1995;44:81-4. CDC. Update: Trends in AIDS among men who have sex with men -- United States, 1989-1994. MMWR 1995;44:401-4. CDC. First 500,000 AIDS cases -- United States, 1995. MMWR 1995; 44:849-53. CDC. HIV/AIDS surveillance report -- year-end edition Vol. 7, No. 2. 1995. Anthrax Brachman PS. Anthrax. In: Hoeprich PD, Jordan MC, Roland AR, eds. Infectious diseases. 5th ed. Philadelphia: JB Lippincott Co., 1994:1003-8. Meselson M, Guillemin J, Hugh-Jones M, et al. The Sverdlovsk anthrax outbreak of 1979. Science 1994;266:1202-8. Arboviral Infections (California serogroup viruses, eastern equine encephalitis, St. Louis encephalitis, and western equine encephalitis) Monath TP, ed. The arboviruses: epidemiology and ecology. Boca Raton, FL: CRC Press, 1983. Tsai TF. Arboviral infections in the United States. Infect Dis Clin North Am 1991;5:73-102. Tsai TF. Arboviruses and related zoonotic viruses. In: Oski FJ, ed. Principles and practice of pediatrics. 2nd ed. Philadelphia: JB Lippincott Co., 1994:1266-88. Botulism St. Louis ME, Peck SHS, Bowering D, et al. Botulism from chopped garlic: delayed recognition of a major outbreak. Ann Intern Med 1988;108:363-8. Weber JT, Hatheway CL, St. Louis ME. Botulism. In: Hoeprich PD, Jordan MC, Ronald AR. Infectious diseases: a treatise of infectious processes. 5th ed. Philadelphia: JB Lippincott Co., 1994:1185-94. Woodruff BA, Griffin PM, McCroskey LM, et al. Clinical and laboratory comparison of botulism from toxin types A, B, and E in the United States 1975-1988. J Infect Dis 1992;166:1281-6. Brucellosis Chomel BB, DeBess EE, Mangiamele DM, et al. Changing trends in the epidemiology of human brucellosis in California from 1973 to 1992: a shift toward foodborne transmission. J Infect Dis 1994;170:1216-23. Kaufmann AF, Fox MD, Boyce JM, et al. Airborne spread of brucellosis. Ann N Y Acad Sci 1980;353:105-14. Staskiewicz J, Lewis CM, Colville J, Zervos M, Band J. Outbreak of Brucella melitensis among microbiology laboratory workers in a community hospital. J Clin Microbiol 1991;29:287-90. Chancroid CDC. Chancroid in the United States, 1981-1990: evidence for underreporting of cases. MMWR 1992;41(No. SS-3):57-61. CDC. Chancroid detected by polymerase chain reaction -- Jackson, Mississippi, 1994-1995. MMWR 1995; 44:567,573-4. DiCarlo RP, Armentor BS, Martin DH. Chancroid epidemiology in New Orleans men. J Infect Dis 1995;172:446-52. Chlamydia trachomatis infection CDC. Recommendations for the prevention and management of Chlamydia trachomatis infections, 1993. MMWR 1993; 42(No. RR-12). Hillis SD, Nakashima A, Marchbanks PA, Addiss DG, Davis JP. Risk factors for recurrent Chlamydia trachomatis infections in women. Am J Obstet Gynecol 1994;170:801-6. Hillis SD, Nakashima A, Amsterdam L, et al. The impact of a comprehensive chlamydia prevention program in Wisconsin. Family Planning Perspectives 1995;27:108-11. Cholera Blake PA. Epidemiology of cholera in the Americas. Gastroenterol Clin North Am 1993;22:639-60. Boyce TG, Mintz ED, Greene KD, et al. Vibrio cholerae O139 Bengal infections among tourists to southeast Asia: an intercontinental foodborne outbreak. J Infect Dis 1995;172:1401-4. Wachsmuth IK, Blake PA, Olsvik O, eds. Vibrio cholerae and cholera: molecular to global perspectives. Washington, DC: American Society for Microbiology, 1994. World Health Organization. Guidelines for cholera control. Geneva: World Health Organization, 1993. Congenital Syphilis CDC. Guidelines for the prevention and control of congenital syphilis. MMWR 1988; 37(No. S-1):1-13. CDC. Surveillance for geographic and secular trends in congenital syphilis -- United States, 1983-1991. MMWR 1993; 42(No. SS-6):59-71. CDC. Evaluation of congenital syphilis surveillance system -- New Jersey, 1993. MMWR 1995; 44:225-7. Thompson BL, Matuszak D, Dwyer DM, Nakashima A, Pearce H, Israel E. Congenital syphilis in Maryland, 1989-1991: the effect of changing the case definition and opportunities for prevention. Sex Transm Dis 1995; 22:364-9. Cryptosporidiosis CDC. Assessing the public health threat associated with waterborne cryptosporidiosis: report of a workshop. MMWR 1995;44(No. RR-6). CDC. Surveillance for waterborne-disease outbreaks -- United States, 1993-1994. MMWR 1996;45(No. SS-1). Juranek DD. Cryptosporidiosis: sources of infection and guidelines for prevention. Clin Infect Dis 1995;21(suppl 1):S57-61. Diphtheria CDC. Diphtheria acquired by U.S. citizens in the Russian Federation and Ukraine -- 1994. MMWR 1995;44:237,243-4. Chen RT, Broome CV, Weinstein RA, Weaver R, Tsai TF. Diphtheria in the United States, 1971-1981. Am J Public Health 1985;75:1393-7. Hardy IRB, Dittmann S, Sutter RW. Resurgence of diphtheria in the New Independent States of the former Soviet Union: current situation and control strategies. Lancet 1996; (in press). Escherichia coli O157:H7, Hemolytic-uremic syndrome Bell BP, Goldoft M, Griffin PM, et al. A multistate outbreak of Escherichia coli O157:H7-associated bloody diarrhea and hemolytic uremic syndrome from hamburgers: the Washington experience. JAMA 1994;272:1449-53. Boyce TG, Pemberton AG, Wells JG, Griffin PM. Screening for Escherichia coli O157:H7 -- a national survey of clinical laboratories. J Clin Microbiol 1995;33:3275-7. Boyce TG, Swerdlow DL, Griffin PM. Escherichia coli O157:H7 and the hemolytic-uremic syndrome. N Engl J Med 1995;333:364-8. Griffin PM, Tauxe RV. The epidemiology of infections caused by Escherichia coli O157:H7, other enterohemorrhagic E.coli, and the associated hemolytic uremic syndrome. Epidemiol Rev 1991;13:60-98. Martin DL, MacDonald KL, White KE, Soler JT, Osterholm MT. The epidemiology and clinical aspects of the hemolytic uremic syndrome in Minnesota. N Engl J Med 1990;323:1161-7. Gonorrhea CDC. Surveillance for gonorrhea and primary and secondary syphilis among adolescents -- United States, 1981-1991. MMWR 1993;42(No. SS-3):1-11. CDC. Sentinel surveillance for antimicrobial resistance in Neisseria gonorrhoeae -- United States, 1988-1991. MMWR 1993;42(No. SS-3):29-39. CDC. Increasing incidence of gonorrhea--Minnesota, 1994. MMWR 1995;44: 282-6. CDC. Fluoroquinolone resistance in Neisseria gonorrhoeae -- Colorado and Washington, 1995. MMWR 1995;44:761-4. Haemophilus influenzae, invasive Adams WG, Deaver KA, Cochi SL, et al. Decline of childhood Haemophilus influenzae type b (Hib) disease in the Hib vaccine era. JAMA 1993;269: 221-6. CDC. Recommendations for use of Haemophilus b conjugate vaccines and a combined diphtheria, tetanus, pertussis, and Haemophilus b vaccine: recommendations of the Advisory Committee on Immunization Practices (ACIP). MMWR 1993;42(No. RR-13). CDC. Progress toward elimination of Haemophilus influenzae type b disease among infants and children -- United States, 1993-1994. MMWR 1995;44: 545-50. Hansen disease (Leprosy) Mastro TD, Redd SC, Breiman RF. Imported leprosy in the United States, 1978 through 1988; an epidemic without secondary transmission. Am J Public Health 1992 Aug;82:1127-30. Noordeen SK. Epidemiology and control of leprosy -- a review of progress over the last 30 years. Trans R Soc Trop Med Hyg 1993;87:515-7. Smith PG. Recent trends in the epidemiology of tuberculosis and leprosy. Trop Geogr Med 1991 Jul;43:S22-9. Hepatitis Alter MJ, Mares A, Hadler SC, Maynard JE. The effect of underreporting on the apparent incidence and epidemiology of acute viral hepatitis. Am J Epidemiol 1987;125:133-9. CDC. Hepatitis surveillance report no. 56. Atlanta: US Department of Health and Human Services, Public Health Service, 1996. Hepatitis A Lemon SM, Shapiro CN. The value of immunization against hepatitis A. Infect Agents and Dis 1994;1:38-49. Shapiro CN, Coleman PJ, McQuillan GM, et al. Epidemiology of hepatitis A: seroepidemiology and risk groups in the U.S.A. Vaccine 1992;10(suppl 1):S59-62. Hepatitis B Margolis HS, Alter MJ, Hadler SC. Hepatitis B: evolving epidemiology and implications for control. Semin Liver Dis 1991;11:84-92. Hepatitis, C/Non-A, non-B Alter MJ, Hadler SC, Judson FN, et al. Risk factors for acute non-A, non-B hepatitis in the United States and association with hepatitis C virus infection. JAMA 1990;264:2231-5. Alter MJ, Margolis HS, Krawczynski K, et al. The natural history of community-acquired hepatitis C in the United States. N Engl J Med 1992; 327:1899-905. Legionellosis Jernigan DB, Hofmann J, Cetron MS, et al. Outbreak of Legionnaires' disease among cruise ship passengers exposed to a contaminated whirlpool spa. Lancet 1996;347:494-9. Keller DW, Hajjeh R, DeMaria A Jr, et al. Community outbreak of Legionnaires' disease: an investigation confirming the potential for cooling towers to transmit Legionella species. Clin Infect Dis 1996;22: 257-61. Marston BJ, Lipman HB, Breiman RF. Surveillance for Legionnaires' disease: risk factors for morbidity and mortality. Arch Intern Med 1994; 154: 2417-22. Miller LA, Beebe JL, Butler JC, et al. Use of polymerase chain reaction in an epidemiologic investigation of Pontiac fever. J Infect Dis 1993;168: 769-72. Lyme disease CDC. Lyme disease -- United States, 1994. MMWR 1995;44:459-62. CDC. Recommendations for test performance and interpretation from the Second National Conference on Serologic Diagnosis of Lyme Disease. MMWR 1995;44:590-1. Dennis DT. Lyme Disease. Dermatol Clin 1995;13:537-51. Kalish R. Lyme disease. Rheum Dis Clin North Am 1993;19:399-426. Steere AC. Lyme disease. N Engl J Med 1989;321:586-96. Malaria CDC. Local transmission of Plasmodium vivax malaria -- Houston, Texas, 1994, MMWR 1994;44:295. Lobel HO, Miani M, Eng T, Bernard KW, Hightower AW, Campbell CC. Long-term malaria prophylaxis with weekly mefloquine. Lancet 1993;341:848-51. Zucker JR, Campbell CC. Malaria: principles of prevention and treatment. Infect Dis Clin North Am 1993;7:547-67. Measles CDC. Measles Prevention: recommendations of the Immunization Practices Advisory Committee. MMWR 1989;38(No. SS-9). CDC. Measles -- United States, 1994. MMWR 1995;44:486-487, 493-494. CDC. Measles -- United States, 1995. MMWR 1996;45:305-307. Meningococcal disease CDC. Laboratory-based surveillance for meningococcal disease in selected areas -- United States, 1989-1991. MMWR 1993;42(No. SS-2):21-30. CDC. Serogroup B meningococcal disease -- Oregon, 1994. MMWR 1995;44:121-4. Jackson LA, Schuchat A, Reeves MW, Wenger JD. Serogroup C meningococcal outbreaks in the United States: an emerging threat. JAMA 1995;273: 383-9. Riedo FX, Plikaytis BD, Broome CV. Epidemiology and prevention of meningococcal disease. Pediatr Infect Dis J 1995;14:643-57. Mumps Briss PA, Fehrs LJ, Parker RA, et al. Sustained transmission of mumps in a highly vaccinated population: assessment of primary vaccine failure and waning vaccine-induced immunity. J Infect Dis 1994;169:77-82. CDC. Mumps prevention. MMWR 1989;38:388-92,397-400. CDC. Mumps Surveillance -- United States, 1988-1993. MMWR 1995;44(No. SS-3):1-14. Hersch BS, Fine PEM, Kent WK, et al. Mumps outbreak in a highly vaccinated population. J Pediatr 1991;119:187-93. Pertussis CDC. Pertussis -- United States, January 1992-June 1995. MMWR 1995;44: 525-9. Izurieta HS, Kenyon TA, Strebel PM, Baughman AL, Shulman ST, Wharton M. Risk factors for pertussis in young infants during an outbreak in Chicago in 1993. Clin Infect Dis 1996;22:503-7. Wortis N, Strebel PM, Wharton M, Bardenheier B, Hardy IRB. Pertussis deaths: report of 23 cases in the United States, 1992 and 1993. Pediatrics 1996;97:607-12. Plague Craven, RB, Barnes AM. Plague and tularemia. Infect Dis Clin North Am. 199l;5:165-75. Poland JD, Quan TJ, Barnes AM. Plague. In: Beran GW, ed. CRC handbook of zoonoses. 2nd ed. Section A: bacterial, rickettsial, chlamydial, and mycotic. CRC Press, Inc., Boca Raton, Florida. 1994:93-112. Poliomyelitis CDC. Lack of evidence for wild poliovirus circulation -- United States, 1993. MMWR 1993;43:957-9. CDC. Progress toward global poliomyelitis eradication, 1985-1994. MMWR 1995;44:273-5, 281. Prevots DR, Sutter RW, Strebel PM, Weibel RE, Cochi SL. Completeness of reporting for paralytic poliomyelitis, United States, 1980 through 1991. Arch Pediatr Adoles Med 1994;148:479-85. Strebel PM, Sutter RW, Cochi SL, et al. Epidemiology of poliomyelitis in the United States: one decade after the last reported case of indigenous wild virus-associated disease. Clin Infect Dis 1992;14: 568-79. Psittacosis CDC. Human psittacosis linked to a bird distributor in Mississippi -- Massachusetts and Tennessee, 1992. MMWR 1992;41:794-7. Hedberg K, White KE, Forfang JC, et al. An outbreak of psittacosis in Minnesota turkey industry workers: implications for modes of transmission and control. Am J Epidemiol 1989; 130:569-77. National Association of State Public Health Veterinarians. Compendium of chlamydiosis (psittacosis) control, 1995. JAVMA 1995;206:1874-9. Wong KH, Skelton SK, Daugharty H. Utility of complement fixation and microimmunofluorescence assays for detecting serologic responses in patients with clinically diagnosed psittacosis. J Clin Microbiol 1994; 32:2417-21. Rabies CDC. Rabies prevention -- United States. 1991: recommendations of the Immunization Practices Advisory Committee (ACIP). MMWR 1991;40 (No. RR-3). CDC. Compendium of animal rabies control, 1995. MMWR 1995;44(No. RR-2). Krebs JW, Strine TW, Smith JS, Rupprecht CE, Childs JE. Rabies surveillance in the United States during 1994. JAVMA 1995;207:1562-75. Rocky Mountain spotted fever (RMSF) Dalton MJ, Clarke MJ, Holman RC, et al. National surveillance for Rocky Mountain spotted fever, 1981-1992, epidemiologic summary and evaluation of risk factors for fatal outcome. Am J Trop Med Hyg 1995;52(5):405-13. McDade JE, Fishbein DB. Rickettsiaceae: the rickettsiae. In: Laboratory diagnosis of infectious diseases: principles and practice. Vol II. Viral, rickettsial, and chlamydial diseases. New York: Springer-Verlag, 1988:864-89. Rubella CDC. Rubella prevention: recommendations of the Immunization Practices Advisory Committee (ACIP). MMWR 1990;39(No. RR-15). CDC. Outbreaks of rubella among the Amish -- United States, 1991. MMWR 1991;40:264. CDC. Rubella and congenital rubella syndrome -- United States, January 1, 1991-May 7, 1994. MMWR 1994;43:391,397-401. Lindegren ML, Fehrs LJ, Hadler SC, Hinman AR. Update: rubella and congenital rubella syndrome, 1980-1990. Epidemiol Rev 1991;13:341-8. Salmonellosis CDC. Reptile-associated Salmonellosis -- selected states, 1994-1995. MMWR 1995;44:347-50. Hennessy TW, Hedberg CW, Slutsker L, et al. A national outbreak of Salmonella Enteritidis infections from ice cream. N Engl J Med 1996; 334:1281-6. Lee LA, Puhr ND, Maloney EK, Bean NH, Tauxe RV. Increase in antimicrobial- resistant Salmonella infections in the United States, 1989-1990. J Infect Dis 1994;170:128-34. Mishu B, Koehler J, Lee LA, et al. Outbreaks of Salmonella enteritidis infections in the United States, 1985-1991. J Infect Dis 1994;169: 547-52. Tauxe RV. Salmonella: a postmodern pathogen. Journal of Food Protection 1991;54:563-8. Shigellosis Lee LA, Shapiro CN, Hargrett-Bean N, Tauxe RV. Hyperendemic shigellosis in the United States: a review of surveillance data for 1967-1988. J Infect Dis 1991;164:894-900. Mohle-Boetani JC, Stapleton M, Finger R, et al. Communitywide shigellosis: control of an outbreak and risk factors in child day-care centers. Am J Public Health 1995;85:812-16. Parsonnet J, Greene KD, Gerber AR, et al. Shigella dysenteriae type 1 infections in U.S. travelers to Mexico. Lancet 1989:543-5. Ries AA, Wells JG, Olivola D, et al. Epidemic Shigella dysenteriae type 1 in Burundi: panresistance and implications for prevention. J Infect Dis 1994;169:1035-41. Syphilis CDC. Outbreak of primary and secondary syphilis -- Baltimore City, Maryland, 1995. MMWR 1996;45:166-9. Nakashima AK, Rolfs RT, Flock ML, Kilmarx P, Greenspan JR. Epidemiology of syphilis in the United States, 1941-1993. Sex Transm Dis 1996;23:16-23. St.Louis ME, Farley TA, Aral SO. Untangling the persistence of syphilis in the south. Sex Transm Dis 1996;23:1-4. Thomas JC, Kulik AL, Schoenbach VJ. Syphilis in the South: rural rates surpass urban rates in North Carolina. Am J Public Health 1995;85: 1119-22. Tetanus Gergen PJ, McQuillan GM, Kiely M, et al. A population-based survey of immunity to tetanus in the United States. N Engl J Med 1995;332:761-6. Prevots R, Sutter RW, Strebel PM, Cochi SL, Hadler S. Tetanus surveillance -- United States, 1989-1990. MMWR 1992;41(No. SS-8):1-9. Sutter RW, Cochi SL, Brink EW, Sirotkin BI. Assessment of vital statistics and surveillance data for monitoring tetanus mortality, United States, 1979-1984. Am J Epidemiol 1990;131:132-42. Toxic-shock syndrome CDC. Reduced incidence of menstrual toxic shock syndrome -- United States, 1980-1990. MMWR 1990;39:421-3. Gaventa S, Reingold AL, Hightower AW, et al. Active surveillance for toxic shock syndrome in the United States, 1986. Rev Infect Dis 1989;(suppl): S28-34. Schuchat A, Broome CV. Toxic shock syndrome and tampons. Epidemiol Rev 1991;13:99-112. Trichinosis Bailey TM, Schantz PM. Trends in the incidence and transmission patterns of human trichinosis in the United States, 1982-1986. Rev Infect Dis 1990; 12:5-11. CDC. Trichinosis surveillance -- United States, 1987-1990. MMWR 1991;40 (No. SS-3):35-42. McAuley JB, Michelson MK, Hightower AW, Engeran S, Wintermeyer LA, Schantz PM. A trichinosis outbreak among Southeast Asian refugees. Am J Epidemiol 1992;135:1404-10. Tuberculosis American Thoracic Society/CDC. Treatment of tuberculosis and tuberculosis infection in adults and children. Am J Respir Crit Care Med 1994;149: 1359-74. CDC. Recommendations for counting reported tuberculosis cases. Atlanta: Us Department of Health and Human Services, Public Health Service, 1977. Typhoid fever CDC. Typhoid immunization: recommendations of the Advisory Committee on Immunization Practices. MMWR 1994;43(No. RR-14). Ryan CA, Hargrett-Bean NT, Blake PA. Salmonella typhi infections in the United States, 1975-1984: increasing role of foreign travel. Rev Infect Dis 1989;11:1-8. Woodruff BA, Pavia AT, Blake PA. A new look at typhoid vaccination: information for the practicing physician. JAMA 1991;265:756-9. Varicella CDC. Varicella outbreak in a women's prison -- Kentucky. MMWR 1989;38: 635-6,641-2. CDC. Prevention of varicella: recommendations of the Advisory Committee on Immunization Practices (ACIP). MMWR 1996;45(No. RR-11). Gershon AA, LaRussa P, Hardy I, Steinberg S, Silverstein S. Varicella vaccine: the American experience. J Infect Dis 1992;166(suppl 1):S63-8. Lieu TA, Cochi SL, Black SB, et al. Cost-effectiveness of a routine varicella vaccination program for U.S. children. JAMA
1994;271:375-81. NOTIFIABLE DISEASES -- Summary of reported cases, by month, United States, 1995 ================================================================================================================================================================================= NAME Total Jan. Feb. Mar. Apr. May June July Aug. Sept. Oct. Nov. Dec. Unk. ---------------------------------------------------------------------------------------------------------------------------------------------------------------- AIDS * 71,547 5,499 5,551 8,455 4,741 5,418 5,765 6,797 5,104 7,291 5,160 6,002 5,764 - Botulism, total 97 2 3 6 7 6 3 9 10 17 9 7 18 - Brucellosis 98 3 3 1 10 9 15 6 8 7 6 2 28 - Chancroid + 606 ..............142......... .............145......... ............184........ ............135......... - Chlamydia +& 477,638 ..........120,549......... .........118,618......... ........116,793........ ........121,768......... - Cholera 23 2 - - 2 5 3 5 - 2 1 2 1 - Escherichia coli O157:H7 2,139 50 69 62 65 73 138 263 289 381 256 215 278 - Gonorrhea + 392,848 ..........102,600......... ..........93,238......... ........100,910........ .........96,100......... - Haemophilus influenzae, invasive 1,180 105 103 106 127 94 68 111 66 79 80 73 168 - Hansen disease (leprosy) 144 9 7 10 17 19 15 15 8 12 8 3 21 - Hepatitis A 31,582 1,449 2,100 2,245 2,690 2,129 2,246 3,047 2,568 3,414 2,891 2,498 4,305 - Hepatitis B 10,805 466 707 837 1,046 864 799 1,012 763 884 829 744 1,854 - Hepatitis, C/non-A non-B 4,576 144 440 314 448 263 290 360 317 357 392 292 959 - Legionellosis 1,241 67 70 93 133 104 76 148 84 111 90 59 206 - Lyme disease 11,700 207 424 435 394 492 742 2,385 1,878 1,421 1,041 868 1,413 - Malaria 1,419 52 95 74 80 95 97 164 121 187 155 84 215 - Measles (rubeola) 309 22 26 108 29 17 30 16 14 9 11 10 17 - Meningococcal disease 3,243 225 278 339 357 314 219 253 149 157 223 161 568 - Mumps 906 51 52 85 86 124 81 59 36 63 70 69 130 - Pertussis (whooping cough) 5,137 195 216 212 275 200 220 538 534 795 458 430 1,064 - Plague 9 - - - 2 - 2 1 - 2 2 - - - Poliomyelitis, paralytic @ 2 - 2 - - - - - - - - - - - Psittacosis 64 4 2 5 7 6 9 4 4 1 6 7 9 - Rabies, animal 7,811 436 417 716 754 572 614 1,090 574 720 695 451 772 - Rabies, human 5 - - 1 - - - - - 1 1 - 2 - Rocky Mountain spotted fever 590 8 10 7 14 30 56 103 103 110 57 26 66 - Rubella (German measles) 128 9 4 3 9 10 17 35 17 2 3 7 12 - Rubella, congenital syndrome 6 2 1 - 1 - 1 - - - - - 1 - Salmonellosis 45,970 1,716 2,142 1,947 2,584 2,757 3,242 5,146 4,675 6,282 5,408 3,976 6,095 - Shigellosis 32,080 1,335 2,015 1,833 2,112 2,022 2,093 3,115 2,773 3,918 3,676 2,504 4,684 - Syphilis, total all stages + 68,953 ...........17,396......... ..........18,065......... .........18,150........ .........15,342......... - Primary and secondary + 16,500 ............4,332......... ...........4,030......... ..........4,325........ ..........3,813......... - Congenital <1 year ** 1,548 192 176 178 150 120 148 124 102 104 109 78 67 - Tetanus 41 1 1 3 3 1 2 3 4 4 3 6 10 - Toxic-shock syndrome 191 9 21 17 19 15 9 18 9 18 13 10 33 - Trichinosis 29 - 2 6 8 1 2 2 2 1 2 1 2 - Tuberculosis ++ 22,860 632 1,343 1,827 1,871 1,957 2,065 1,936 2,036 1,909 1,886 1,559 3,839 - Typhoid fever 369 16 27 32 33 35 21 31 20 53 32 33 36 - Varicella (chickenpox) && 120,624 12,488 15,502 17,503 19,957 16,712 11,242 7,195 907 1,923 2,447 4,300 10,448 - ---------------------------------------------------------------------------------------------------------------------------------------------------------------- * The total number of acquired immunodeficiency syndrome (AIDS) cases includes all cases reported to the Division of HIV/AIDS Prevention, National Center for HIV, STD, and TB Prevention (NCHSTP) through December 31, 1995. + Cases were updated through the Division of Sexually Transmitted Diseases Prevention, NCHSTP, as of March 1, 1996. & Chlamydia refers to genital infections caused by C. trachomatis. @ Seven additional suspected cases of paralytic poliomyelitis were reported in 1995. Confirmation of these cases is pending review by an external panel. ** For congenital syphilis only, cases were updated through the Division of Sexually Transmitted Diseases Prevention, NCHSTP, as of August 26, 1996. ++ Cases were updated through the Division of Tuberculosis Elimination, NCHSTP, as of May 29, 1996. && Not nationally notifiable. ================================================================================================================================================================================= Return to top. Table_B1 Note: To print large tables and graphs users may have to change their printer settings to landscape and use a small font size.
NOTIFIABLE DISEASES -- Reported cases, by geographic division and area,
United States, 1995
===============================================================================================================================
                     Total resident                   Botulism
                       population                -------------------
Area                 (in thousands)    AIDS *    Foodborne    Infant    Brucellosis    Chancroid +
--------------------------------------------------------------------------------------------------
United States           262,755        71,547       24          54           98            606

New England              13,312         3,608        1           -            1              7
  Maine                   1,241           130        -           -            -              -
  N.H.                    1,148           112        -           -            -              -
  Vt.                       585            44        -           -            -              -
  Mass.                   6,074         1,447        1           -            -              7
  R.I.                      990           223        -           -            -              -
  Conn.                   3,275         1,652        -           -            1              -

Mid. Atlantic            38,153        19,185        -          16            2            340
  N.Y. (excl. NYC)       10,824         2,364        -           1            -              2
  N.Y.C.                  7,312        10,035        -           -            1            334
  N.J.                    7,945         4,409        -           7            -              4
  Pa.                    12,072         2,377        -           8            1              -

E.N. Central             43,456         5,410        -           5           12             29
  Ohio                   11,151         1,110        -           2            -              5
  Ind.                    5,803           529        -           -            -              -
  Ill.                   11,830         2,220        -           -            8             21
  Mich.                   9,549         1,201        -           1            3              -
  Wis.                    5,123           350        -           2            1              3

W.N. Central             18,348         1,734        1           -            4              2
  Minn.                   4,610           369        -           -            2              -
  Iowa                    2,842           116        -           -            2              -
  Mo.                     5,324           791        -           -            -              -
  N. Dak.                   641             5        -           -            -              -
  S. Dak.                   729            19        -           -            -              -
  Nebr.                   1,637           114        -           -            -              -
  Kans.                   2,565           320        1           -            -              2

S. Atlantic              46,995        17,983        1           4            9             47
  Del.                      717           316        -           1            -              -
  Md.                     5,042         2,575        -           1            2              -
  D.C.                      554         1,029        -           -            -              -
  Va.                     6,618         1,610        1           2            -              2
  W. Va.                  1,828           127        -           -            -              1
  N.C.                    7,195         1,000        -           -            3             18
  S.C.                    3,673           976        -           -            1              -
  Ga.                     7,201         2,291        -           -            1              2
  Fla.                   14,166         8,059        -           -            2             24

E.S. Central             16,066         2,279        -           1            3              9
  Ky.                     3,860           298        -           1            -              -
  Tenn.                   5,256           897        -           -            -              2
  Ala.                    4,253           642        -           -            -              7
  Miss.                   2,697           442        -           -            3              -

W.S. Central             28,828         6,136        -           1           24            156
  Ark.                    2,484           277        -           -            4              1
  La.                     4,342         1,087        -           1            -            129
  Okla.                   3,278           295        -           -            1              -
  Tex.                   18,724         4,477        -           -           19             26

Mountain                 15,645         2,263        7           2           13              4
  Mont.                     870            25        -           -            1              -
  Idaho                   1,163            49        4           -            -              -
  Wyo.                      480            17        -           -            2              -
  Colo.                   3,747           673        1           -            1              -
  N. Mex.                 1,685           164        -           -            4              -
  Ariz.                   4,218           678        2           -            5              2
  Utah                    1,951           164        -           2            -              -
  Nev.                    1,530           493        -           -            -              2

Pacific                  41,951        12,813       14          25           30             12
  Wash.                   5,431           892        6           -            -              5
  Oreg.                   3,141           459        -           -            1              -
  Calif.                 31,589        11,134        3          23           29              7
  Alaska                    604            69        5           -            -              -
  Hawaii                  1,187           259        -           2            -              -

  Guam                      133             -        -           -            -              -
  P.R.                    3,522         2,594        -           -            -              1
  V.I.                      102            39        -           -            -              2
  C.N.M.I.                   43             -        -           -            -             NA
  American Samoa             47             -       NA          NA           NA             NA
--------------------------------------------------------------------------------------------------
* The total number of acquired immunodeficiency syndrome (AIDS) cases includes all cases                NA: Not Available
  reported to the Division of HIV/AIDS Prevention, National Center for HIV, STD, and TB Prevention       -: No reported cases
  (NCHSTP) through December 31, 1995. This total includes 136 cases in persons
  whose state of residence is unknown.
+ Cases were updated through the Division of Sexually Transmitted Diseases Prevention, NCHSTP, as of March 1, 1996.
===============================================================================================================================
Return to top. Table_C Note: To print large tables and graphs users may have to change their printer settings to landscape and use a small font size.
NOTIFIABLE DISEASES -- Summary of reported cases, by age group, *
United States, 1995
===========================================================================================================================================================================================
                                                          Age
                                                          not
NAME                                    Total        <5     (Rate)     5-14      (Rate)      15-24      (Rate)      25-44      (Rate)     45-64     (Rate)       65+     (Rate)    stated
-----------------------------------------------------------------------------------------------------------------------------------------------------------------------------------------
AIDS +                                  71,547       555    ( 2.82)      264     ( 0.71)      2,666    (  7.51)     53,460    ( 65.29)    13,764    (27.78)       838    ( 2.56)       -
Botulism, total                             97        56    ( 0.28)        4     ( 0.01)          2    (  0.01)         20    (  0.02)        12    ( 0.02)         1    ( 0.00)       2
Brucellosis                                 98         4    ( 0.02)       11     ( 0.03)         17    (  0.05)         44    (  0.05)        13    ( 0.03)         9    ( 0.03)       -
Cholera                                     23         3    ( 0.02)        -     (  -  )          1    (  0.00)          4    (  0.00)        11    ( 0.02)         3    ( 0.01)       1
Escherichia coli O157:H7                 2,139       444    ( 2.73)      503     ( 1.66)        264    (  0.91)        314    (  0.47)       290    ( 0.72)       266    ( 1.00)      58
Gonorrhea&                             395,493         -    (  -  )    8,076     (21.80)    228,698    (645.01)    132,988    (162.41)    11,046    (22.29)     3,457    (10.54)   9,271
Haemophilus influenzae, invasive         1,180       290    ( 1.47)       66     ( 0.18)         41    (  0.12)        135    (  0.16)       203    ( 0.41)       427    ( 1.30)      18
Hansen disease (leprosy)                   144         -    (  -  )        4     ( 0.01)         19    (  0.05)         40    (  0.05)        36    ( 0.07)        25    ( 0.08)      20
Hepatitis A                             31,582     2,053    (10.42)    6,666     (17.99)      6,382    ( 18.00)     12,160    ( 14.85)     2,801    ( 5.65)     1,042    ( 3.18)     478
Hepatitis B                             10,805        81    ( 0.42)      212     ( 0.58)      2,060    (  5.88)      6,018    (  7.42)     1,707    ( 3.48)       441    ( 1.36)     286
Hepatitis, C/non-A non-B                 4,576        50    ( 0.26)       32     ( 0.09)        264    (  0.75)      2,973    (  3.66)       920    ( 1.88)       251    ( 0.77)      86
Legionellosis                            1,241         4    ( 0.02)       10     ( 0.03)         30    (  0.09)        255    (  0.32)       397    ( 0.81)       518    ( 1.60)      27
Lyme disease                            11,700       699    ( 3.55)    1,997     ( 5.39)        994    (  2.80)      3,213    (  3.92)     3,043    ( 6.14)     1,608    ( 4.90)     146
Malaria                                  1,419        88    ( 0.45)      145     ( 0.39)        247    (  0.70)        596    (  0.73)       224    ( 0.45)        58    ( 0.18)      61
Measles (rubeola)                          309       107    ( 0.54)       48     ( 0.13)         45    (  0.13)         74    (  0.09)        16    ( 0.03)         -    (  -  )      19
Meningococcal disease                    3,243     1,093    ( 5.55)      518     ( 1.40)        606    (  1.71)        347    (  0.42)       299    ( 0.60)       346    ( 1.06)      34
Mumps                                      906       165    ( 0.85)      418     ( 1.15)        117    (  0.34)        138    (  0.17)        41    ( 0.08)         6    ( 0.02)      21
Pertussis (whooping cough)               5,137     2,733    (13.87)    1,246     ( 3.36)        405    (  1.14)        516    (  0.63)       160    ( 0.32)        41    ( 0.13)      36
Plague                                       9         -    (  -  )        1     ( 0.00)          1    (  0.00)          4    (  0.00)         2    ( 0.00)         1    ( 0.00)       -
Poliomyelitis, paralytic @                   2         2    ( 0.01)        -     (  -  )          -    (   -  )          -    (   -  )         -    (  -  )         -    (  -  )       -
Psittacosis                                 64         2    ( 0.01)        1     ( 0.00)          8    (  0.02)         27    (  0.03)        20    ( 0.04)         3    ( 0.01)       3
Rabies, human                                5         1    ( 0.01)        1     ( 0.00)          -    (   -  )          2    (  0.00)         -    (  -  )         1    ( 0.00)       -
Rocky Mountain spotted fever               590        47    ( 0.24)      112     ( 0.30)         60    (  0.17)        206    (  0.25)       109    ( 0.22)        49    ( 0.15)       7
Rubella (German measles)                   128         9    ( 0.05)       10     ( 0.03)         26    (  0.07)         66    (  0.08)        14    ( 0.03)         1    ( 0.00)       2
Salmonellosis                           45,970    12,177    (61.80)    4,477     (12.08)      4,002    ( 11.29)      9,145    ( 11.17)     4,701    ( 9.49)     3,978    (12.13)   7,490
Shigellosis                             32,080     9,130    (46.33)    7,428     (20.05)      2,369    (  6.68)      5,074    (  6.20)     1,364    ( 2.75)       639    ( 1.95)   6,076
Syphilis, primary and secondary &       16,501         -    (  -  )      114     ( 0.31)      4,860    ( 13.71)      9,647    ( 11.78)     1,655    ( 3.34)       187    ( 0.57)      11
Tetanus                                     41         2    ( 0.01)        1     ( 0.00)          2    (  0.01)         20    (  0.02)         6    ( 0.01)        10    ( 0.03)       -
Toxic-shock syndrome                       191         8    ( 0.04)       33     ( 0.09)         39    (  0.11)         74    (  0.09)        23    ( 0.05)         7    ( 0.02)       7
Trichinosis                                 29         1    ( 0.01)        -     (  -  )          2    (  0.01)         14    (  0.02)         8    ( 0.02)         3    ( 0.01)       1
Tuberculosis **                         22,860       783    ( 3.97)      645     ( 1.74)      1,703    (  4.80)      8,241    ( 10.06)     5,998    (12.10)     5,337    (16.28)     153
Typhoid fever                              369        43    ( 0.22)       78     ( 0.21)         84    (  0.24)        132    (  0.16)        19    ( 0.04)        12    ( 0.04)       1
-----------------------------------------------------------------------------------------------------------------------------------------------------------------------------------------
 * July 1, 1993, post-censal population estimates were used to calculate incidence rates per 100,000 population.
 + The total number of acquired immunodeficiency syndrome (AIDS) cases includes all cases reported to the Division of HIV/AIDS Prevention, National Center for HIV, STD, and TB
   Prevention (NCHSTP) through December 31, 1995.
 & Age-related data are collected on aggregate forms different from those used for the number of reported cases. Therefore, the total cases reported on this table may differ slightly
   from other tables. Cases among persons ages <5 years are not shown because some of these may not be caused by sexual transmission; these cases are, however, included in
   the totals. Cases were updated through the Division of Sexually Transmitted Diseases Prevention, NCHSTP, as of March 1, 1996. Age data for 1995 are unavailable for chancroid
   and chlamydia.
 @ Seven additional suspected cases of paralytic poliomyelitis were reported in 1995. Confirmation of these cases is pending review by an external panel.
** Casese were updated through the Division of Tuberculosis Elimination, NCHSTP, as of May 29, 1996.
===========================================================================================================================================================================================
Return to top. Table_D Note: To print large tables and graphs users may have to change their printer settings to landscape and use a small font size.
NOTIFIABLE DISEASES -- Summary of reported cases, by sex, * United States, 1995
=================================================================================================================================
                                                                                             Sex
                                                                                             not
NAME                                 Total       Male      (Rate)     Female       (Rate)   stated
--------------------------------------------------------------------------------------------------
AIDS +                               71,547     58,007    ( 46.56)     13,540     ( 10.27)      -
Botulism, total                          97         46    (  0.04)         51     (  0.04)      -
Brucellosis                              98         59    (  0.05)         39     (  0.03)      -
Chancroid &                             606        443    (  0.35)        160     (  0.12)      3
Chlamydia &@                        477,638          -    (   -  )    383,956     (290.29)      1
Cholera                                  23          9    (  0.01)         13     (  0.01)      1
Escherichia coli O157:H7              2,139        970    (  0.95)      1,144     (  1.06)     25
Gonorrhea &                         392,848    203,563    (158.64)    188,650     (140.32)    635
Haemophilus influenzae, invasive      1,180        575    (  0.46)        602     (  0.46)      3
Hansen disease (leprosy)                144         85    (  0.07)         40     (  0.03)     19
Hepatitis A                          31,582     17,488    ( 14.04)     13,943     ( 10.58)    151
Hepatitis B                          10,805      6,448    (  5.23)      4,286     (  3.29)     71
Hepatitis, C/non-A non-B              4,576      2,848    (  2.31)      1,696     (  1.30)     32
Legionellosis                         1,241        706    (  0.57)        529     (  0.41)      6
Lyme disease                         11,700      5,890    (  4.73)      5,772     (  4.38)     38
Malaria                               1,419        863    (  0.69)        519     (  0.39)     37
Measles (rubeola)                       309        133    (  0.11)        154     (  0.12)     22
Meningococcal disease                 3,243      1,688    (  1.35)      1,542     (  1.17)     13
Mumps                                   906        480    (  0.39)        411     (  0.32)     15
Pertussis (whooping cough)            5,137      2,421    (  1.94)      2,707     (  2.05)      9
Plague                                    9          4    (  0.00)          5     (  0.00)      -
Poliomyelitis, paralytic **               2          2    (  0.00)          -     (   -  )      -
Psittacosis                              64         28    (  0.02)         36     (  0.03)      -
Rabies, human                             5          3    (  0.00)          2     (  0.00)      -
Rocky Mountain spotted fever            590        322    (  0.26)        266     (  0.20)      2
Rubella (German measles)                128         63    (  0.05)         63     (  0.05)      2
Rubella, congenital syndrome              6          2    (  0.00)          4     (  0.00)      -
Salmonellosis                        45,970     19,093    ( 15.32)     20,084     ( 15.23)  6,793
Shigellosis                          32,080     11,955    (  9.60)     14,523     ( 11.02)  5,602
Syphilis, primary and secondary &    16,500      8,731    (  6.80)      7,768     (  5.78)      1
Tetanus                                  41         27    (  0.02)         14     (  0.01)      -
Toxic-shock syndrome                    191         54    (  0.04)        131     (  0.10)      6
Trichinosis                              29         19    (  0.02)          9     (  0.01)      1
Tuberculosis ++                      22,860     14,494    ( 11.63)      8,348     (  6.33)     18
Typhoid fever                           369        207    (  0.17)        160     (  0.12)      2
--------------------------------------------------------------------------------------------------
 * July 1, 1993, post-censal population estimates were used to calculate rates. Rates are reported per 100,000 population.
 + The total number of acquired immunodeficiency syndrome (AIDS) cases includes all cases reported to the Division of HIV/AIDS
   Prevention, National Center for HIV, STD, and TB Prevention (NCHSTP) through December 31, 1995.
 & Cases were updated through the Division of Sexually Transmitted Diseases Prevention, NCHSTP, as of March 1, 1996.
 @ Chlamydia refers to genital infections caused by C. trachomatis. The rates for men are not presented, as reporting on men is
   much more limited than on women.
** Seven additional suspected cases of paralytic poliomyelitis were reported in 1995. Confirmation of these cases is pending
   review by an external panel.
++ Cases were updated through the Division of Tuberculosis Elimination, NCHSTP, as of May 29, 1996.
=================================================================================================================================
Return to top. Table_E Note: To print large tables and graphs users may have to change their printer settings to landscape and use a small font size.
NOTIFIABLE DISEASES -- Summary of reported cases, by race, United States, 1995
===================================================================================================================================================================================
                                               American Indian          Asian or
                                                     or                 Pacific                                                                Race not
Name                                  Total     Alaskan Native   (%)    Islander   (%)      Black    (%)     White     (%)     Other   (%)      stated     (%)
---------------------------------------------------------------------------------------------------------------------------------------------------------------
AIDS *                                71,547          238        (<1)      556     ( 1)     29,326   (41)    29,715   ( 42)      -     ( -)      11,712 +  (16)
Botulism, total                           97            5        ( 5)        7     ( 7)          -   ( -)        53   ( 55)      -     ( -)          32    (33)
Brucellosis                               98            -        ( -)        -     ( -)          4   ( 4)        50   ( 51)      -     ( -)          44    (45)
Cholera                                   23            -        ( -)        2     ( 9)          -   ( -)        10   ( 43)      -     ( -)          11    (48)
Escherichia coli O157:H7               2,139            2        (<1)       18     ( 1)         62   ( 3)     1,224   ( 57)      4     (<1)         829    (39)
Gonorrhea &                          395,493        1,472        (<1)    1,305     (<1)    240,887   (61)    42,198   ( 11)      -     ( -)    109,631+    (28)
Haemophilus influenzae, invasive       1,180           15        ( 1)       15     ( 1)        144   (12)       766   ( 65)      3     (<1)         237    (20)
Hansen disease (leprosy)                 144            -        ( -)       43     (30)          7   ( 5)        39   ( 27)      1     ( 1)          54    (38)
Hepatitis A                           31,582        1,375        ( 4)      428     ( 1)      3,066   (10)    18,967   ( 60)     61     (<1)       7,685    (24)
Hepatitis B                           10,805          100        ( 1)      710     ( 7)      2,394   (22)     4,772   ( 44)     25     (<1)       2,804    (26)
Hepatitis, C/non-A non-B               4,576           45        ( 1)       38     ( 1)        542   (12)     1,798   ( 39)      3     (<1)       2,150    (47)
Legionellosis                          1,241            2        (<1)       10     ( 1)        108   ( 9)       852   ( 69)      2     (<1)         267    (22)
Lyme disease                          11,700           22        (<1)       83     ( 1)        204   ( 2)     8,945   ( 76)      -     ( -)       2,446    (21)
Malaria                                1,419            5        (<1)      225     (16)        444   (31)       367   ( 26)     28     ( 2)         350    (25)
Measles (rubeola)                        309            8        ( 3)       10     ( 3)         13   ( 4)       170   ( 55)      -     ( -)         108    (35)
Meningococcal disease                  3,243           42        ( 1)       29     ( 1)        503   (16)     2,152   ( 66)      4     (<1)         513    (16)
Mumps                                    906            8        ( 1)       33     ( 4)         73   ( 8)       403   ( 44)      3     (<1)         386    (43)
Pertussis (whooping cough)             5,137           55        ( 1)       62     ( 1)        314   ( 6)     2,780   ( 54)      2     (<1)       1,924    (37)
Plague                                     9            2        (22)        -     ( -)          -   ( -)         6   ( 67)      -     ( -)           1    (11)
Poliomyelitis, paralytic @                 2            -        ( -)        -     ( -)          -   ( -)         2   (100)      -     ( -)           -    ( -)
Psittacosis                               64            -        ( -)        -     ( -)          2   ( 3)        40   ( 63)      -     ( -)          22    (34)
Rabies, human                              5            -        ( -)        -     ( -)          -   ( -)         4   ( 80)      -     ( -)           1    (20)
Rocky Mountain spotted fever             590           11        ( 2)        4     ( 1)         33   ( 6)       450   ( 76)      -     ( -)          92    (16)
Rubella (German measles)                 128            -        ( -)       10     ( 8)          7   ( 5)        87   ( 68)      -     ( -)          24    (19)
Rubella, congenital syndrome               6            -        ( -)        -     ( -)          -   ( -)         2   ( 33)      -     ( -)           4    (67)
Salmonellosis                         45,970          217        (<1)      686     ( 1)      3,817   ( 8)    20,875   ( 45)     34     (<1)      20,341    (44)
Shigellosis                           32,080        2,031        ( 6)      166     ( 1)      4,153   (13)    12,828   ( 40)     13     (<1)     12,889+    (40)
Syphilis, primary and secondary &     16,501           47        (<1)       54     (<1)     13,974   (85)     1,487   (  9)      -     ( -)         939    ( 6)
Tetanus                                   41            1        ( 2)        1     ( 2)          1   ( 2)        31   ( 76)      -     ( -)           7    (17)
Toxic-shock syndrome                     191            1        ( 1)        3     ( 2)         12   ( 6)       140   ( 73)      -     ( -)          35    (18)
Trichinosis                               29            -        ( -)        -     ( -)          -   ( -)        10   ( 34)      -     ( -)          19    (66)
Tuberculosis **                       22,860          327        ( 1)    4,035     (18)      7,766   (34)    10,606   ( 46)      -     ( -)         126    ( 1)
Typhoid fever                            369            2        ( 1)      107     (29)         32   ( 9)        71   ( 19)     12     ( 3)         145    (39)
---------------------------------------------------------------------------------------------------------------------------------------------------------------
 * The total number of acquired immunodeficiency syndrome (AIDS) includes all cases reported through December 31, 1995.
 + Includes cases originally reported as Hispanic: 11,577 for AIDS; 16,447 for gonorrhea; and 686 for syphilis, primary and secondary.
 & Race data are collected on aggregate forms different from those used for numbers of reported cases. Thus, the total number of cases reported on this table may differ slightly
   from other tables. Cases were updated through the Division of Sexually Transmitted Diseases Prevention, NCHSTP, as of March 1, 1996. Race data for 1995 are unavailable for
   chancroid and chlamydia.
 @ Seven additional suspected cases of paralytic poliomyelitis were reported in 1995. Confirmation of these cases is pending review by an external panel.
** Cases were updated through the Division of Tuberculosis Elimination, NCHSTP, as of May 29, 1996.
===================================================================================================================================================================================
Return to top. Table_F Note: To print large tables and graphs users may have to change their printer settings to landscape and use a small font size.
NOTIFIABLE DISEASES -- Summary of reported cases, by ethnicity, United States, 1995
======================================================================================================================================
                                                                                         Ethnicity
                                                                                            not
NAME                                Total     Hispanic    (%)    Non-Hispanic   (%)       stated      (%)
----------------------------------------------------------------------------------------------------------
AIDS *                              71,547     11,577     (16)      59,041      (83)         929 +   (  1)
Botulism, total                         97         14     (14)          53      (55)          30     ( 31)
Brucellosis                             98         57     (58)          23      (23)          18     ( 18)
Cholera                                 23         14     (61)           7      (30)           2     (  9)
Escherichia coli O157:H7             2,139         50     ( 2)       1,090      (51)         999     ( 47)
Gonorrhea &                        395,493     16,447     ( 4)     283,085      (72)      95,961 +   ( 24)
Haemophilus influenzae               1,180         70     ( 6)         710      (60)         400     ( 34)
Hansen disease (leprosy)               144         42     (29)          68      (47)          34     ( 24)
Hepatitis A                         31,582      5,051     (16)      17,473      (55)       9,058     ( 29)
Hepatitis B                         10,805      1,074     (10)       5,767      (53)       3,964     ( 37)
Hepatitis, C/non-A non-B             4,576        281     ( 6)       1,829      (40)       2,466     ( 54)
 Legionellosis                       1,241         21     ( 2)         717      (58)         503     ( 41)
Lyme disease                        11,700        200     ( 2)       6,129      (52)       5,371     ( 46)
Malaria                              1,419        126     ( 9)         856      (60)         437     ( 31)
Measles (rubeola)                      309         56     (18)         147      (48)         106     ( 34)
Meningococcal disease                3,243        343     (11)       1,995      (62)         905     ( 28)
Mumps                                  906        139     (15)         343      (38)         424     ( 47)
Pertussis (whooping cough)           5,137        376     ( 7)       2,366      (46)       2,395     ( 47)
Plague                                   9          1     (11)           7      (78)           1     ( 11)
Poliomyelitis, paralytic @               2          -     ( -)           -      ( -)           2     (100)
Psittacosis                             64          2     ( 3)          40      (63)          22     ( 34)
Rabies, human                            5          2     (40)           2      (40)           1     ( 20)
Rocky Mountain spotted fever           590         10     ( 2)         339      (57)         241     ( 41)
Rubella (German measles)               128         60     (47)          48      (38)          20     ( 16)
Rubella, congenital syndrome             6          5     (83)           1      (17)           -     ( - )
Salmonellosis                       45,970      2,937     ( 6)      18,124      (39)      24,909     ( 54)
Shigellosis                         32,080      3,673     (11)      12,575      (39)      15,832 +   ( 49)
Syphilis, primary and secondary &   16,501        686     ( 4)      15,461      (94)         354     (  2)
Tetanus                                 41          6     (15)          23      (56)          12     ( 29)
Toxic-shock syndrome                   191          7     ( 4)         121      (63)          63     ( 33)
Trichinosis                             29          3     (10)           6      (21)          20     ( 69)
Tuberculosis **                     22,860      4,847     (21)      17,872      (78)         141     (  1)
Typhoid fever                          369         86     (23)         178      (48)         105     ( 28)
----------------------------------------------------------------------------------------------------------
 * The total number of acquired immunodeficiency syndrome (AIDS) cases includes all cases reported to the Division of HIV/AIDS
   Prevention, National Center for HIV, STD, and TB Prevention (NCHSTP) through December 31, 1995.
 + Ethnicity is not stated and includes cases originally reported as American Indian or Alaskan Native and Asian or Pacific Islander.
 & Ethnicity data are collected on aggregate forms different from those used for numbers of reported cases. Thus, the total number
   of cases reported on this table may differ slightly from other tables. Cases were updated through the Division of Sexually Trans-
   mitted Diseases Prevention, NCHSTP, as of March 1, 1996. Ethnicity data for 1995 are unavailable for chancroid and chlamydia.
 @ Seven additional suspected cases of paralytic poliomyelitis were reported in 1995. Confirmation of these cases is pending review
   by an external panel.
** Cases were updated through the Division of Tuberculosis Elimination, NCHSTP, as of May 29, 1996.
=======================================================================================================================================
Return to top. Figure_1 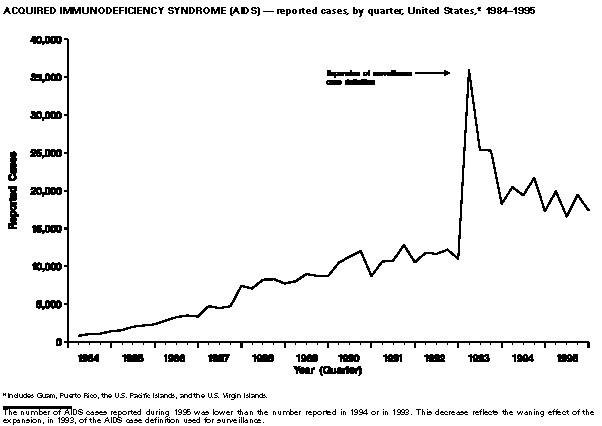 Return to top. Figure_2 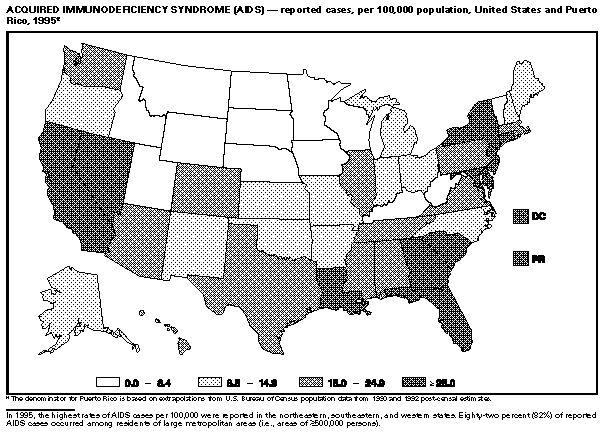 Return to top. Figure_3 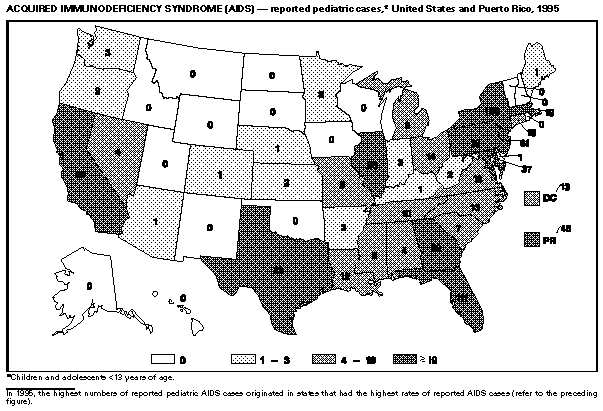 Return to top. Figure_4 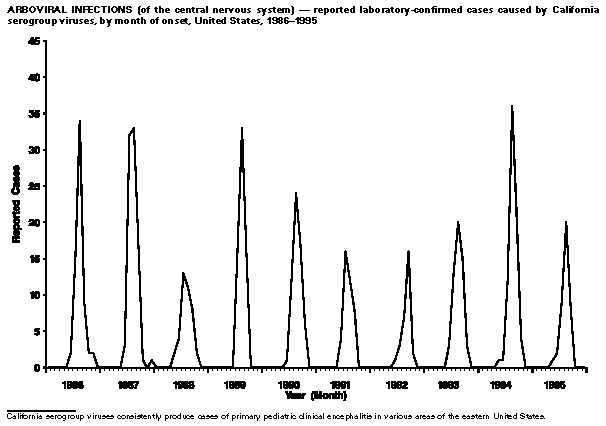 Return to top. Figure_5 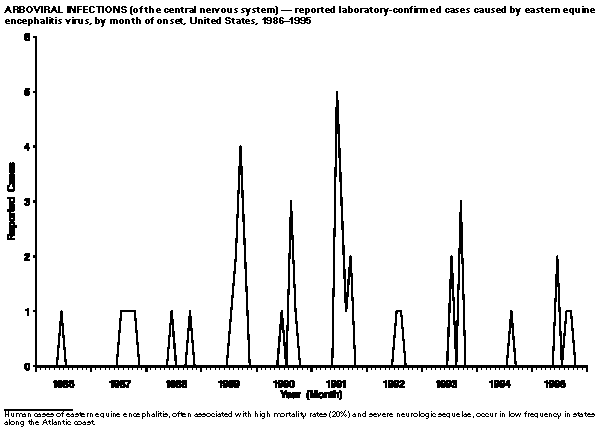 Return to top. Figure_6 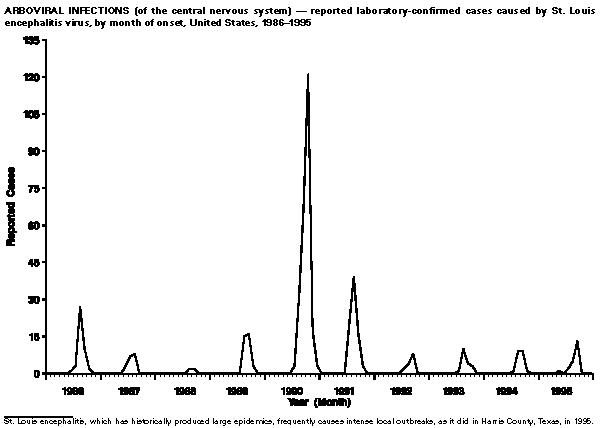 Return to top. Figure_7 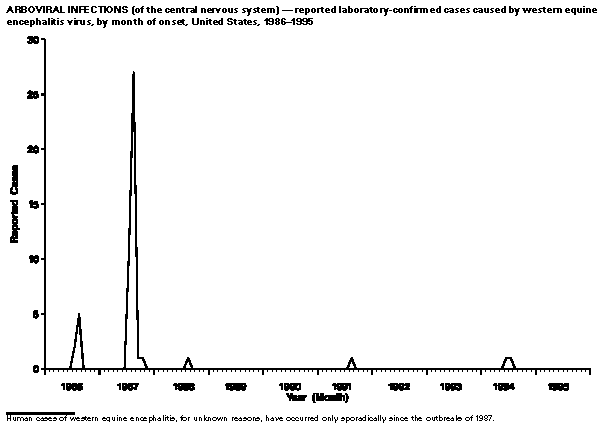 Return to top. Figure_8 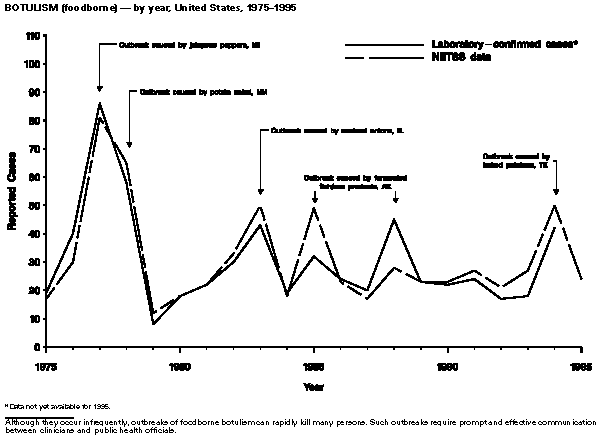 Return to top. Figure_9 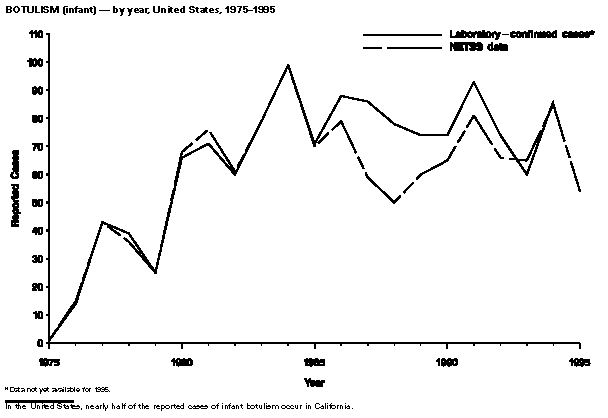 Return to top. Figure_10 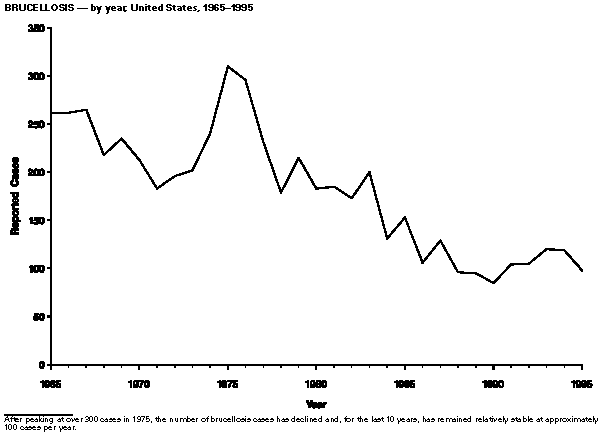 Return to top. Figure_11 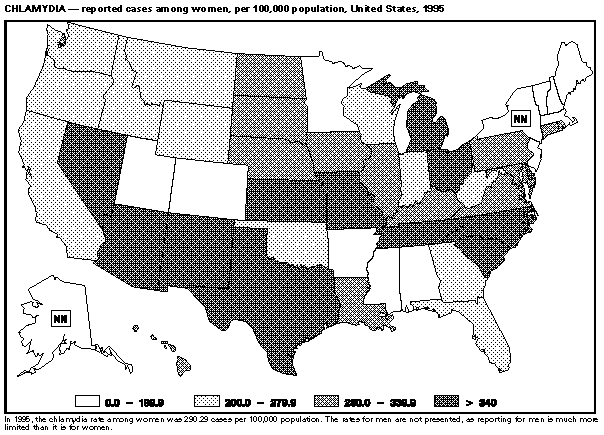 Return to top. Figure_12 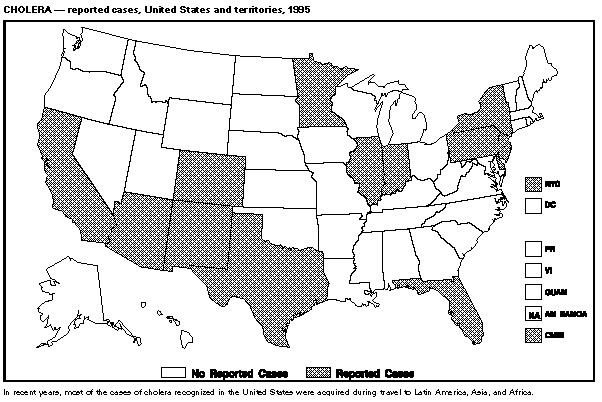 Return to top. Figure_13 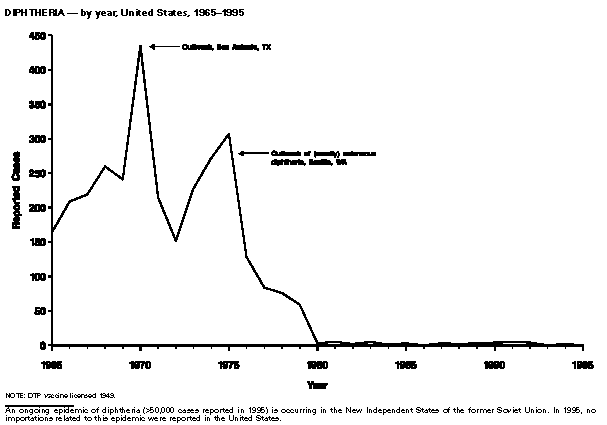 Return to top. Figure_14 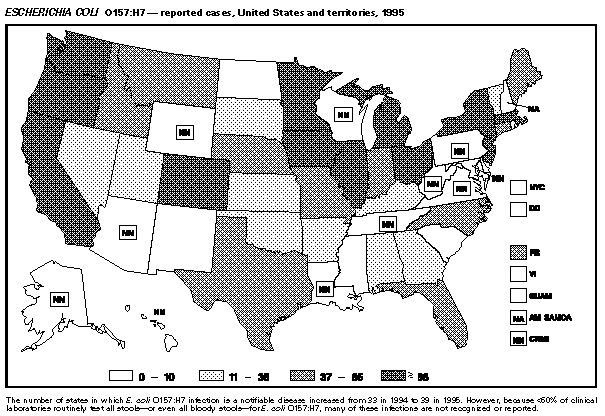 Return to top. Figure_15 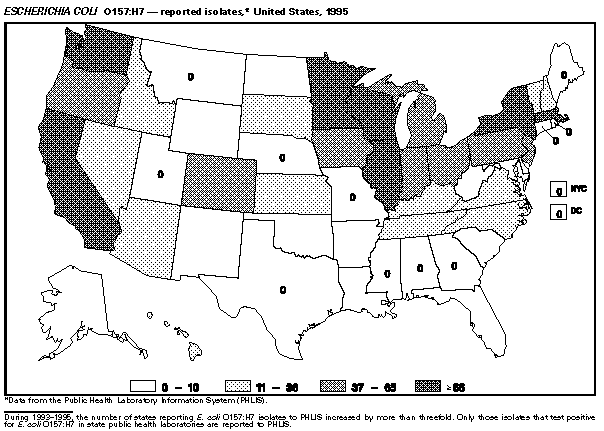 Return to top. Figure_16 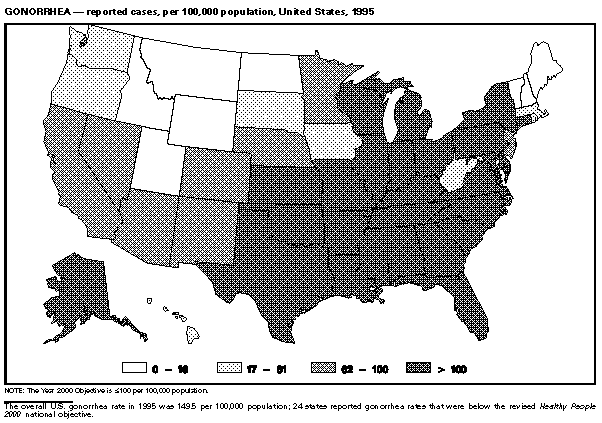 Return to top. Figure_17 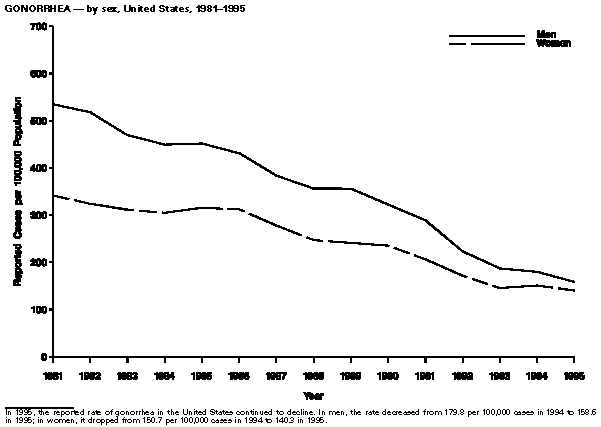 Return to top. Figure_18 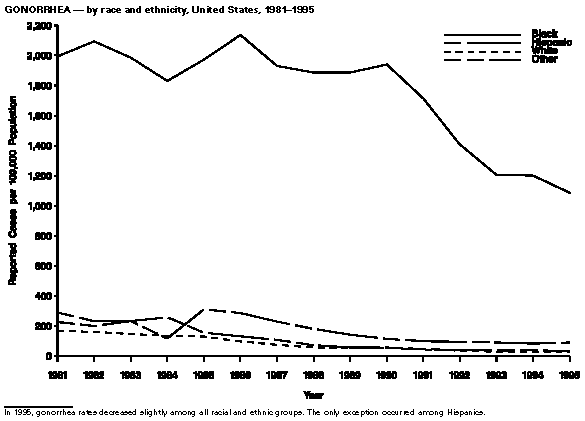 Return to top. Figure_19 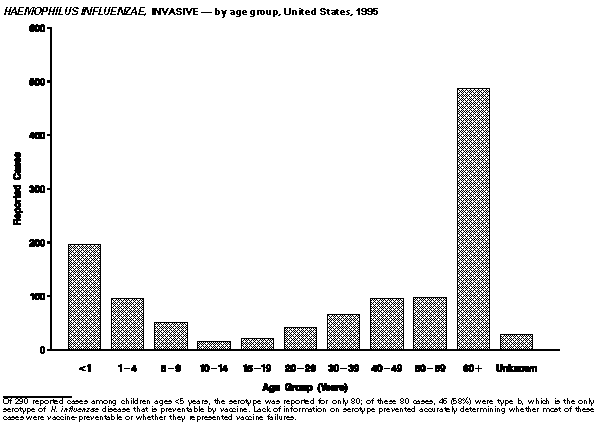 Return to top. Figure_20 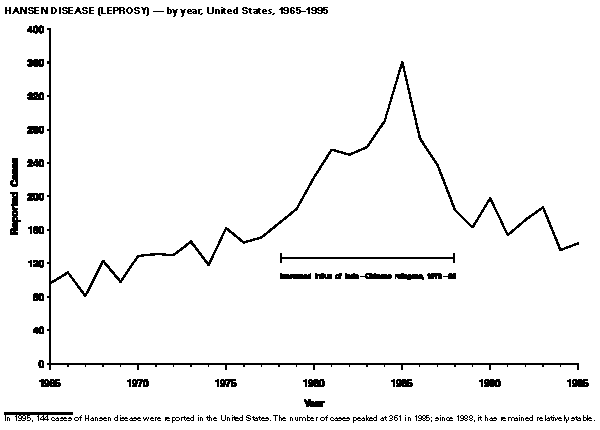 Return to top. Figure_21 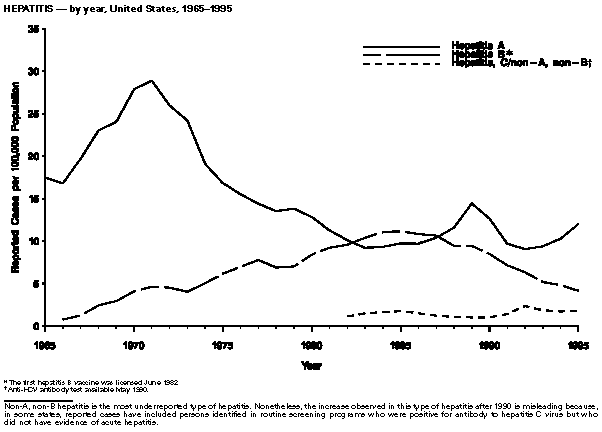 Return to top. Figure_22 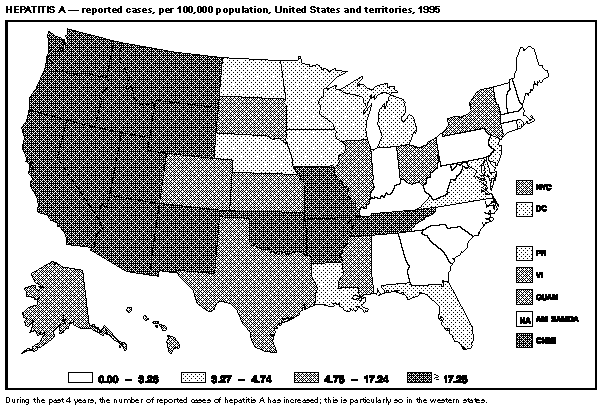 Return to top. Figure_23 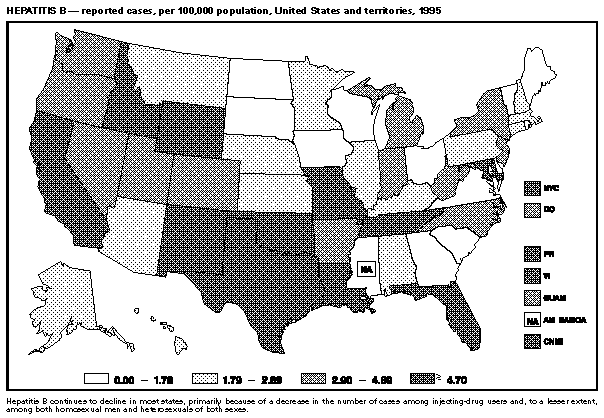 Return to top. Figure_24 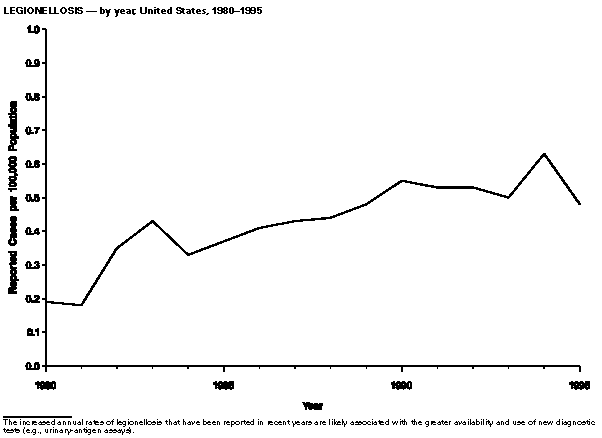 Return to top. Figure_25 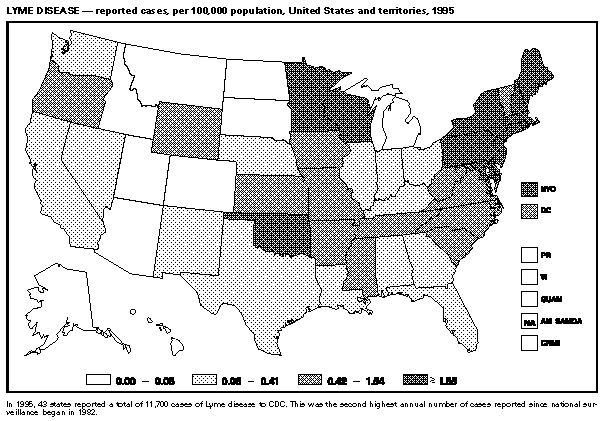 Return to top. Figure_26 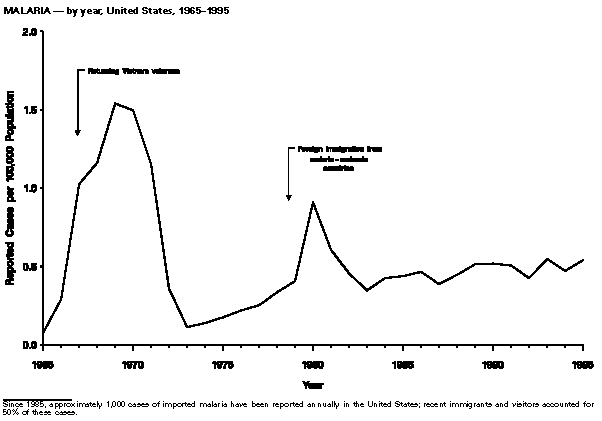 Return to top. Figure_27 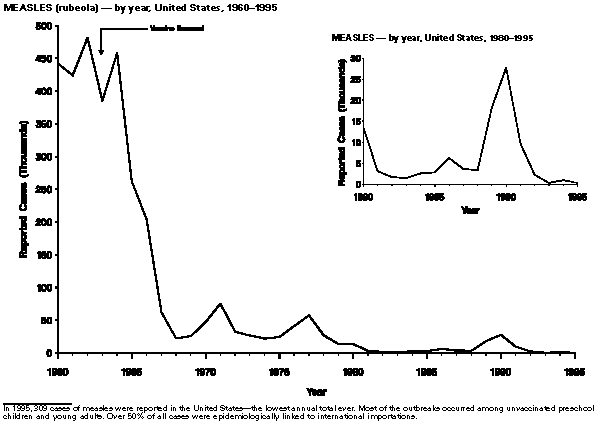 Return to top. Figure_28 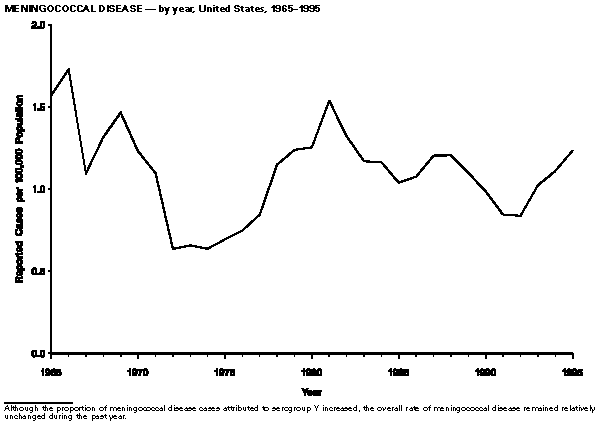 Return to top. Figure_29 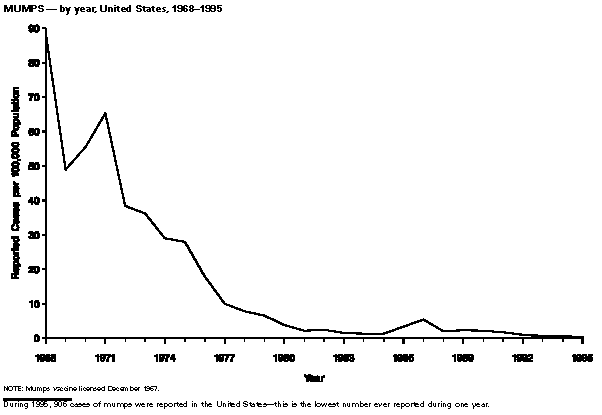 Return to top. Figure_30 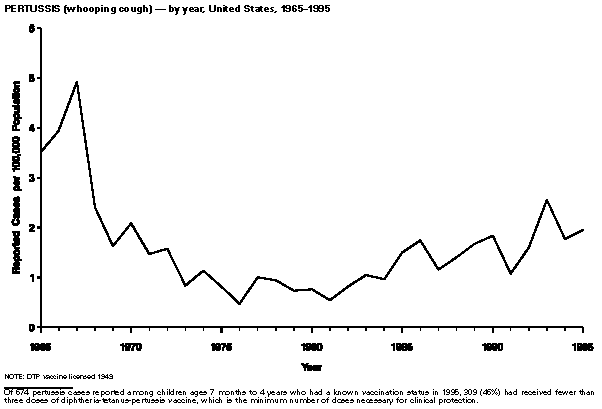 Return to top. Figure_31 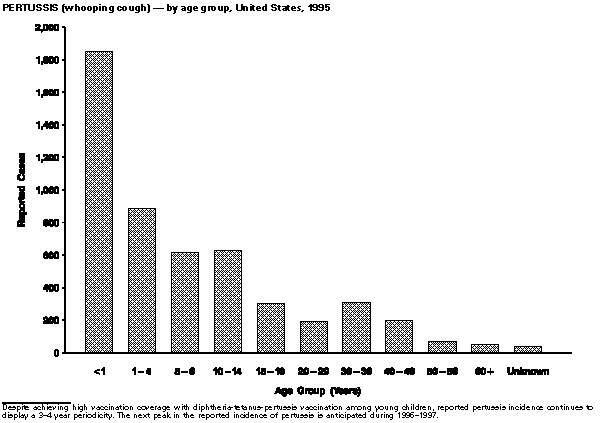 Return to top. Figure_32 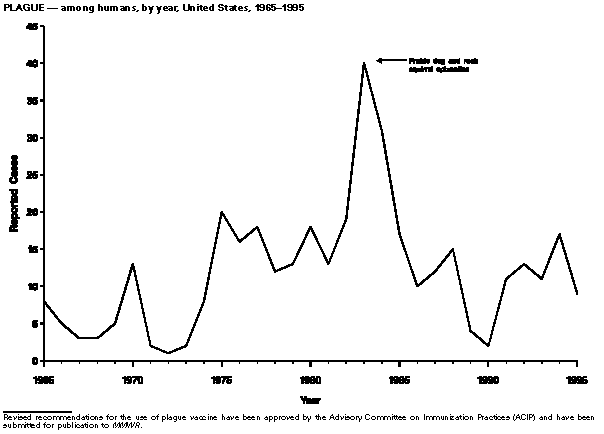 Return to top. Figure_33 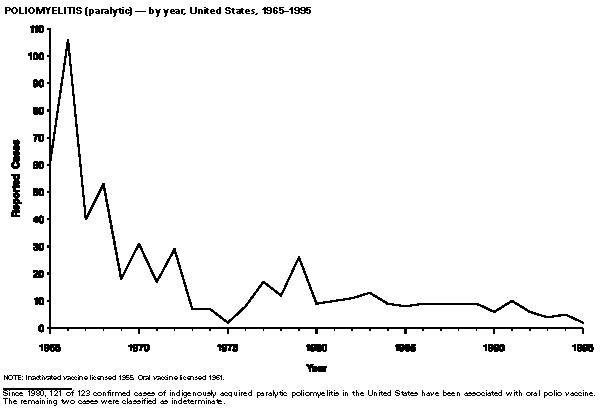 Return to top. Figure_34 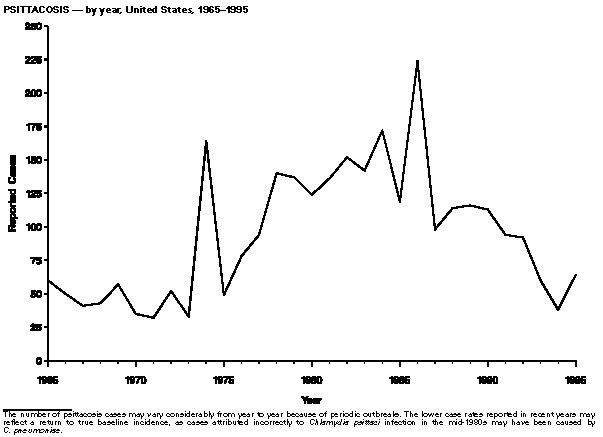 Return to top. Figure_35 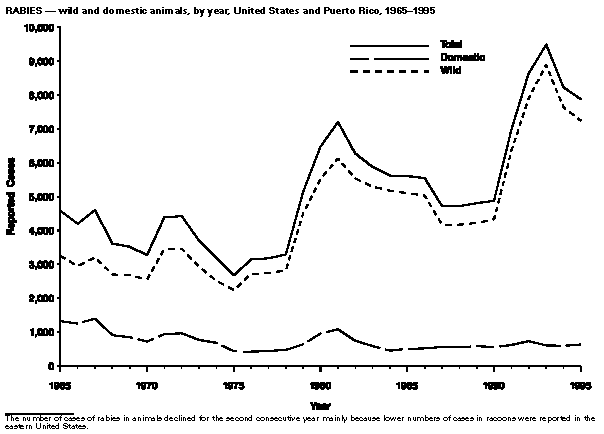 Return to top. Figure_36 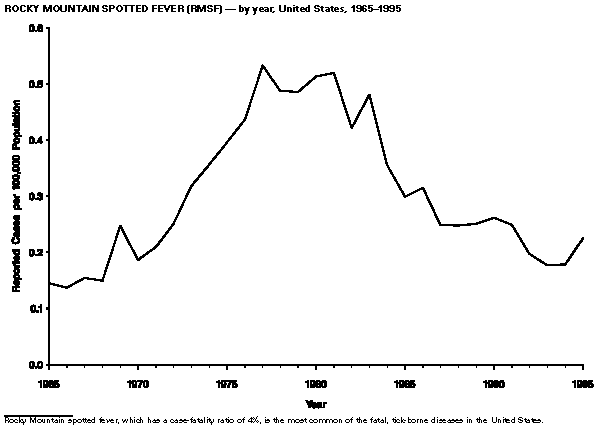 Return to top. Figure_37 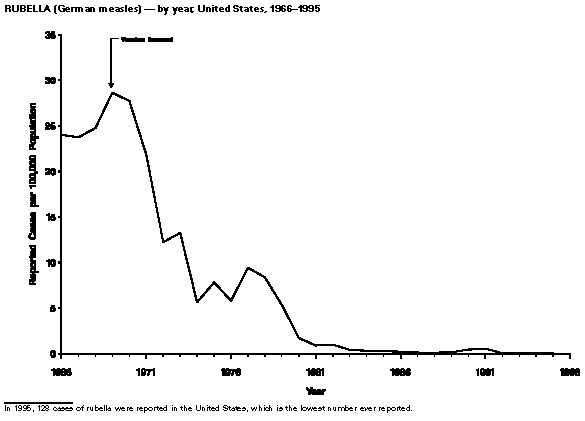 Return to top. Figure_38 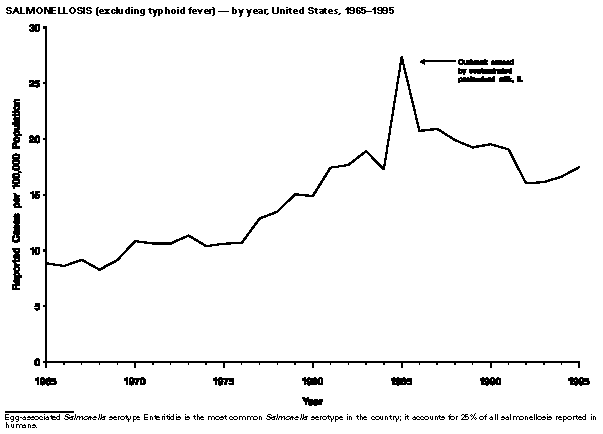 Return to top. Figure_39 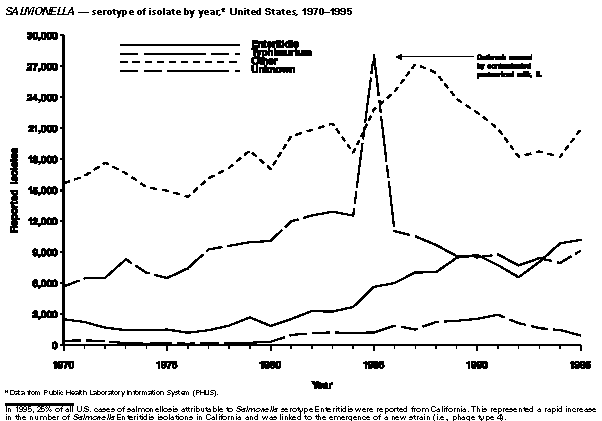 Return to top. Figure_40 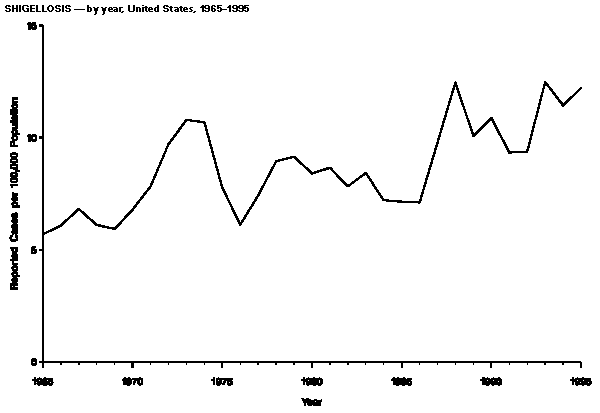 Return to top. Figure_41 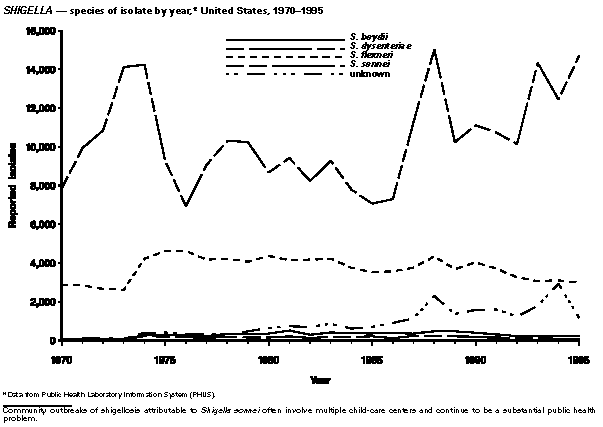 Return to top. Figure_42 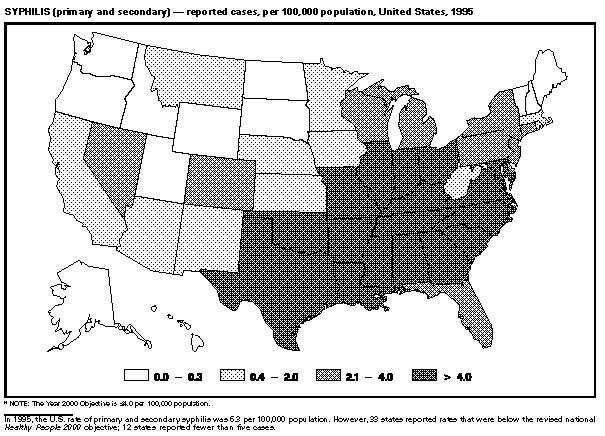 Return to top. Figure_43 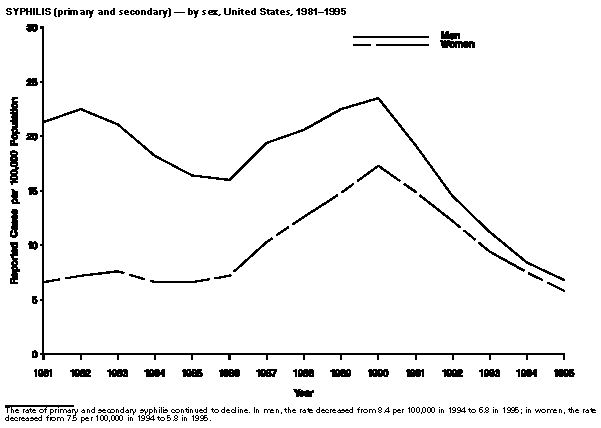 Return to top. Figure_44 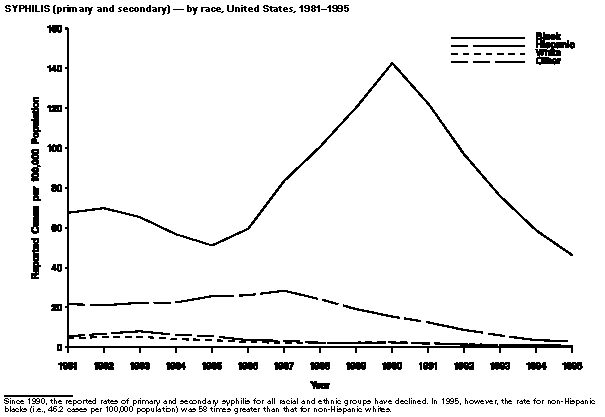 Return to top. Figure_45 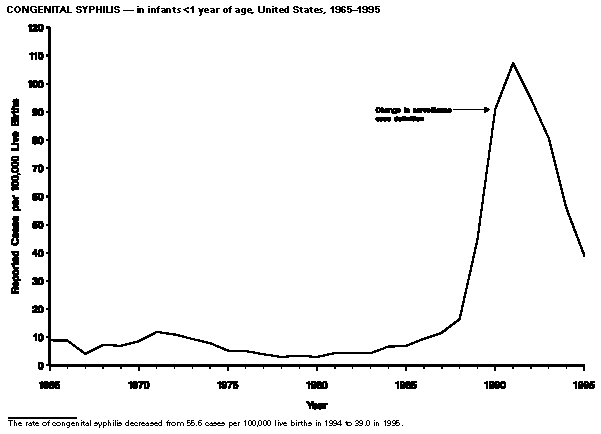 Return to top. Figure_46 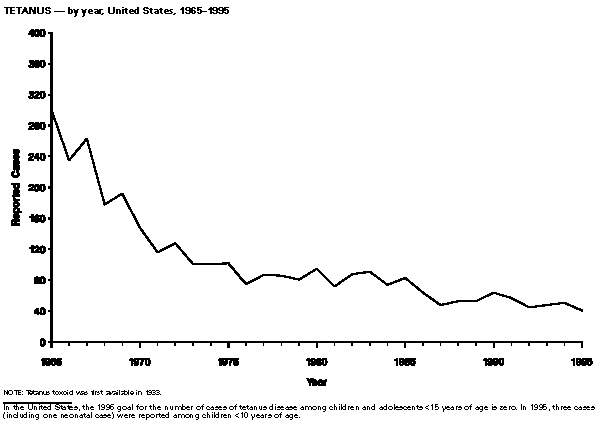 Return to top. Figure_47 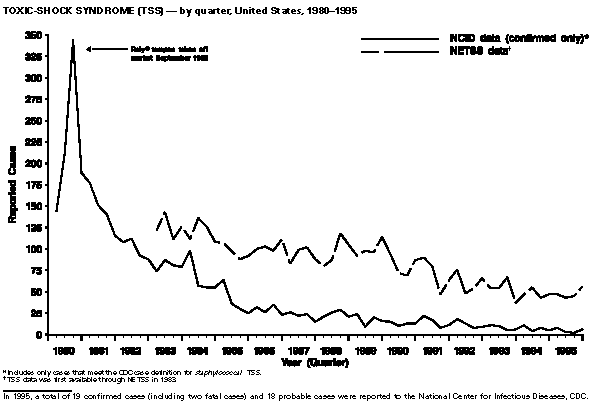 Return to top. Figure_48 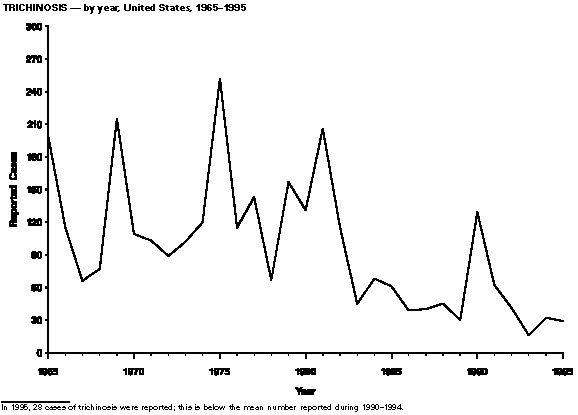 Return to top. Figure_49 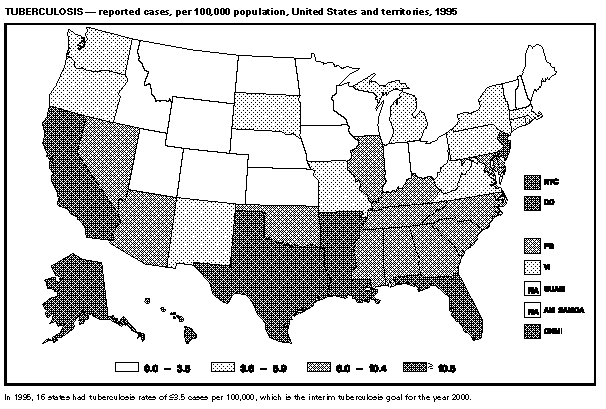 Return to top. Figure_50 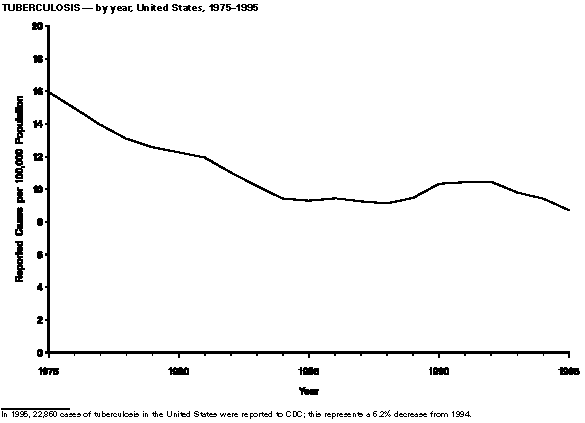 Return to top. Figure_51 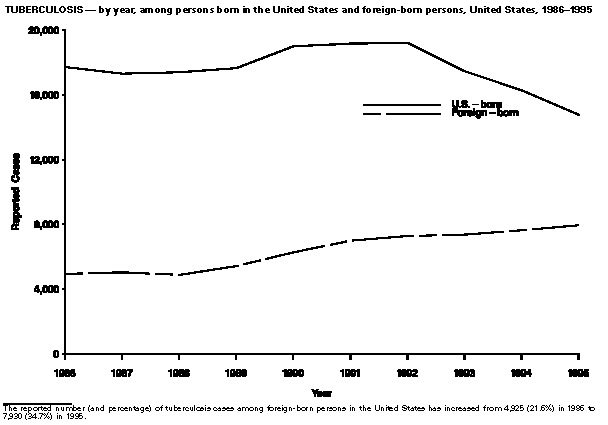 Return to top. Figure_52 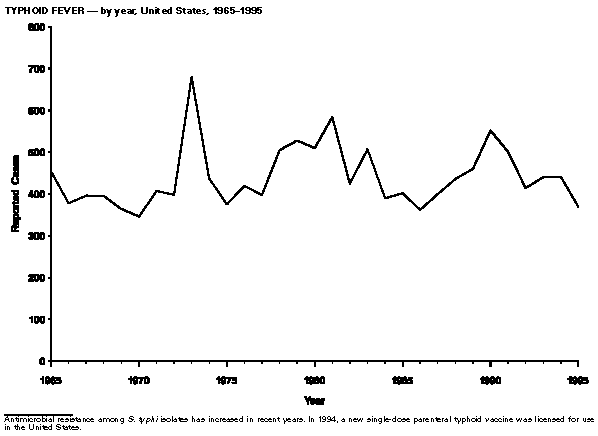 Return to top. Figure_53 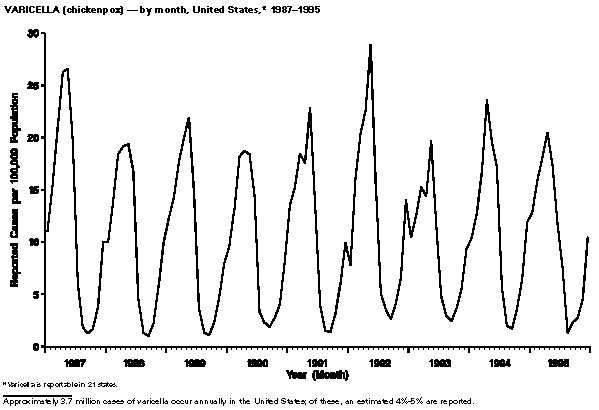 Return to top. Table_1 Note: To print large tables and graphs users may have to change their printer settings to landscape and use a small font size. TABLE 1. NOTIFIABLE DISEASES -- summary of reported cases, per 100,000 population, United States, 1986-1995 ============================================================================================================================================ Disease 1986 1987 1988 1989 1990 1991 1992 1993 1994 1995 ----------------------------------------------------------------------------------------------------------------------------------------- AIDS * 5.36 8.66 12.61 13.58 16.72 17.32 17.83 40.20 30.07 27.20 Amebiasis 1.47 1.33 1.20 1.34 1.38 1.23 1.21 1.21 1.20 + Anthrax 0.00 0.00 0.00 0.00 0.00 0.00 0.00 0.00 0.00 0.00 Aseptic meningitis 4.72 4.72 2.94 4.14 4.77 6.26 5.18 5.39 3.71 + Botulism, total (including wound and unsp.) 0.05 0.03 0.03 0.04 0.04 0.05 0.04 0.04 0.06 0.04 Foodborne 0.01 0.01 0.01 0.01 0.01 0.01 0.00 0.01 0.02 0.01 Brucellosis 0.04 0.05 0.04 0.04 0.03 0.04 0.04 0.05 0.05 0.04 Chancroid 1.57 2.07 2.04 1.90 1.70 1.40 0.80 0.54 0.30 0.20 & Chlamydia @ ..................................... ** ..................................... 182.20 & Cholera 0.01 0.00 0.00 0.00 0.00 0.01 0.04 0.00 0.02 0.01 Diphtheria 0.00 0.00 0.00 0.00 0.00 0.00 0.00 0.00 0.00 0.00 Encephalitis, primary 0.54 0.58 0.36 0.40 0.54 0.40 0.30 0.36 0.28 + Post-infectious 0.05 0.05 0.05 0.04 0.04 0.03 0.05 0.07 0.06 + Escherichia coli O157:H7 ................................. ** ................................ 0.82 1.01 Gonorrhea 376.37 323.14 298.74 297.36 276.60 249.48 201.60 172.40 168.40 149.50 & Granuloma inguinale 0.03 0.01 0.00 0.00 0.00 0.01 0.00 0.00 0.00 + Haemophilus influenzae, invasive ................... ** ................... 1.10 0.55 0.55 0.45 0.45 Hansen disease (leprosy) 0.11 0.10 0.07 0.07 0.08 0.06 0.07 0.07 0.05 0.06 Hepatitis A 10.02 10.39 11.60 14.43 12.64 9.67 9.06 9.40 10.29 12.13 Hepatitis B 11.17 10.65 9.43 9.43 8.48 7.14 6.32 5.18 4.81 4.19 Hepatitis, C/non-A, non-B ++ 1.55 1.23 1.07 1.02 1.03 1.42 2.36 1.86 1.78 1.78 Hepatitis, unspecified 1.69 1.27 1.00 0.93 0.67 0.50 0.35 0.24 0.17 + Legionellosis 0.43 0.43 0.44 0.48 0.55 0.53 0.53 0.50 0.63 0.48 Leptospirosis 0.02 0.02 0.02 0.04 0.03 0.02 0.02 0.02 0.02 + Lyme disease ................... ** ................... 3.80 0.12 3.20 5.01 4.49 Lymphogranuloma venereum 0.16 0.13 0.07 0.08 0.10 0.19 0.10 0.10 0.10 + Malaria 0.47 0.39 0.45 0.51 0.52 0.51 0.43 0.55 0.47 0.55 Measles (rubeola) 2.61 1.50 1.38 7.33 11.17 3.82 0.88 0.12 0.37 0.12 Meningococcal disease 1.08 1.20 1.21 1.10 0.99 0.84 0.84 1.02 1.11 1.25 Mumps 3.37 5.43 2.05 2.34 2.17 1.72 1.03 0.66 0.60 0.35 Murine typhus fever 0.03 0.02 0.02 0.02 0.02 0.02 0.01 0.01 ...... + ...... Pertussis (whooping cough) 1.74 1.16 1.40 1.67 1.84 1.08 1.60 2.55 1.77 1.97 Plague 0.00 0.00 0.01 0.00 0.00 0.00 0.01 0.00 0.01 0.00 Poliomyelitis, paralytic 0.00 0.00 0.00 0.00 0.00 0.00 0.00 0.00 0.00 0.00 Psittacosis 0.09 0.04 0.05 0.05 0.05 0.04 0.04 0.02 0.02 0.03 Rabies, human 0.00 0.00 0.00 0.00 0.00 0.00 0.00 0.00 0.00 0.00 Rheumatic fever, acute 0.12 0.13 0.14 0.13 0.09 0.12 0.06 0.08 0.09 + Rocky Mountain spotted fever 0.32 0.25 0.25 0.25 0.26 0.25 0.20 0.18 0.18 0.23 Rubella (German measles) 0.23 0.13 0.09 0.16 0.45 0.56 0.06 0.07 0.09 0.05 Salmonellosis, excluding typhoid fever 20.73 20.92 19.91 19.26 19.54 19.10 16.04 16.15 16.64 17.66 Shigellosis 7.11 9.80 12.46 10.07 10.89 9.34 9.38 12.48 11.44 12.32 Syphilis, primary and secondary 11.65 14.54 16.43 18.07 20.10 17.26 13.70 10.40 8.10 6.30 & Total, all stages 28.50 35.81 42.37 44.94 53.80 51.69 45.30 39.70 32.00 26.20 & Tetanus 0.03 0.02 0.02 0.02 0.03 0.02 0.02 0.02 0.02 0.02 Toxic-shock syndrome 0.19 0.15 0.16 0.16 0.13 0.11 0.10 0.08 0.10 0.07 Trichinosis 0.02 0.02 0.02 0.01 0.05 0.02 0.02 0.01 0.01 0.01 Tuberculosis 9.44 9.25 9.13 9.46 10.33 10.42 10.46 9.82 9.36 8.70 Tularemia 0.07 0.09 0.08 0.06 0.06 0.08 0.06 0.05 0.04 + Typhoid fever 0.15 0.16 0.18 0.19 0.22 0.20 0.16 0.17 0.17 0.14 Varicella (chickenpox) && 122.42 136.68 122.43 121.77 120.06 135.82 176.54 118.54 135.76 118.11 Yellow fever ............ Last indigenous case reported in 1911; last imported case, 1924 ............ ----------------------------------------------------------------------------------------------------------------------------------------- NOTE: Rates <0.01 after rounding are listed as 0.00. ** Not previously nationally notifiable. * Acquired immunodeficiency syndrome (AIDS). ++ Anti-HCV antibody test became available May 1990. + No longer nationally notifiable. && Not nationally notifiable. & DemoDetail 1991-1995 post-censal estimates were used to calculate 1995 rates. @ Chlamydia refers to genital infections caused by C. trachomatis. ============================================================================================================================================ Return to top. Table_2 Note: To print large tables and graphs users may have to change their printer settings to landscape and use a small font size.
TABLE 2. NOTIFIABLE DISEASES -- summary of reported cases, United States, 1988-1995
===================================================================================================================================================================================
Disease                                          1988      1989       1990       1991      1992       1993      1994       1995
-------------------------------------------------------------------------------------------------------------------------------
AIDS                                           31,001    33,722     41,595     43,672    45,472    103,533    78,279     71,547 *
Amebiasis                                       2,860     3,217      3,328      2,989     2,942      2,970     2,983          +
Anthrax                                             2         -          -          -         1          -         -          -
Aseptic meningitis                              7,234    10,274     11,852     14,526    12,223     12,848     8,932          +
Botulism, total (including wound and unsp.)        84        89         92        114        91         97       143         97
  Foodborne                                        28        23         23         27        21         27        50         24
  Infant                                           50        60         65         81        66         65        85         54

Brucellosis                                        96        95         85        104       105        120       119         98
Chancroid                                       5,001     4,692      4,212      3,476     1,886      1,399       773        606 &
Chalmydia @                                   .................................. ** ................................    477,638 &
Cholera                                             8         -          6         26       103         18        39         23
Diphtheria                                          2         3          4          5         4          -         2          -
Encephalitis, primary                             882       981      1,341      1,021       774        919       717          +
  Post-infectious                                 121        88        105         82       129        170       143          +

Escherichia coli O157:H7                      ............................ ** ............................     1,420      2,139
Gonorrhea                                     719,536   733,151    690,169    620,478   501,409    439,673   418,068    392,848 &
Granuloma inguinale                                11         7         97         29         6         19         3          +
Haemophilus influenzae, invasive              ............ ** ............    2,764     1,412      1,419     1,174      1,180
Hansen disease (leprosy)                          184       163        198        154       172        187       136        144
Hepatitis A                                    28,507    35,821     31,441     24,378    23,112     24,238    29,796     31,582

Hepatitis B                                    23,177    23,419     21,102     18,003    16,126     13,361    12,517     10,805
Hepatitis, C/non-A, non-B ++                    2,619     2,529      2,553      3,582     6,010      4,786     4,470      4,576
Hepatitis, unspecified                          2,470     2,306      1,671      1,260       884        627       444          +
Legionellosis                                   1,085     1,190      1,370      1,317     1,339      1,280     1,615      1,241
Leptospirosis                                      54        93         77         58        54         51        38          +
Lyme disease                                  ............ ** ............    9,465     9,895      8,257    13,043     11,700

Lymphogranuloma venereum                          185       189        277        471       302        285       235          +
Malaria                                         1,099     1,277      1,292      1,278     1,087      1,411     1,229      1,419
Measles (rubeola)                               3,396    18,193     27,786      9,643     2,237        312       963        281
Meningococcal disease                           2,964     2,727      2,451      2,130     2,134      2,637     2,886      3,243
Mumps                                           4,866     5,712      5,292      4,264     2,572      1,692     1,537        906
Murine typhus fever                                54        41         50         43        28         25  ......... + .......

Pertussis (whooping cough)                      3,450     4,157      4,570      2,719     4,083      6,586     4,617      5,137
Plague                                             15         4          2         11        13         10        17          9
Poliomyelitis, paralytic &&                         9         9          6         10         6          4         5          2
Psittacosis                                       114       116        113         94        92         60        38         64
Rabies, animal                                  4,651     4,724      4,826      6,910     8,589      9,377     8,147      7,811
Rabies, human                                       -         1          1          3         1          3         6          5

Rheumatic fever, acute                            158       144        108        127        75        112       112          +
Rocky Mountain spotted fever                      609       623        651        628       502        456       465        590
Rubella (German measles)                          225       396      1,125      1,401       160        192       227        128
Rubella, congenital syndrome                        6         3         11         47        11          5         7          6
Salmonellosis, excluding typhoid fever         48,948    47,812     48,603     48,154    40,912     41,641    43,323     45,970
Shigellosis                                    30,617    25,010     27,077     23,548    23,931     32,198    29,769     32,080

Syphilis, primary and secondary                40,117    44,540     50,223     42,935    33,973     26,498    20,627     16,500 &
  Total, all stages                           103,437   110,797    134,255    128,569   112,581    101,259    81,696     68,953 &
Tetanus                                            53        53         64         57        45         48        51         41
Toxic-shock syndrome                              390       400        322        280       244        212       192        191
Trichinosis                                        45        30        129         62        41         16        32         29
Tuberculosis                                   22,436    23,495     25,701     26,283    26,673     25,313    24,361     22,860 @@
Tularemia                                         201       152        152        193       159        132        96          +
Typhoid fever                                     436       460        552        501       414        440       441        369
Varicella (chickenpox) ***                    192,857   185,441    173,099    147,076   158,364    134,722   151,219    120,624
Yellow fever                                  ........ Last indigenous case reported in 1911; last imported case, 1924 ........
-------------------------------------------------------------------------------------------------------------------------------
  * The total number of acquired immunodeficiency syndrome (AIDS) cases includes all cases reported to the Division of HIV/AIDS Prevention, National Center for HIV, STD, and TB
    Prevention (NCHSTP) through December 31, 1995.
  + No longer nationally notifiable.
  & Cases were updated through the Division of Sexually Transmitted Diseases Prevention, NCHSTP, as of March 1, 1996.
  @ Chlamydia refers to genital infections caused by C. trachomatis.
 ** Not previously nationally notifiable.
 ++ Anti-HCV antibody test available May 1990.
 && Numbers may not reflect changes based on retrospective case evaluations or late reports (see MMWR 1986;35:180-2). Seven additional suspected cases of paralytic poliomyelitis
    were reported in 1995. Confirmation of these cases is pending review by an external panel.
 @@ Cases were updated through the Division of Tuberculosis Elimination, NCHSTP, as of May 29, 1996.
*** Varicella was taken off the nationally notifiable disease list in 1991. Many states continue to report these cases to CDC.
===================================================================================================================================================================================
Return to top. Table_3 Note: To print large tables and graphs users may have to change their printer settings to landscape and use a small font size. TABLE 3. NOTIFIABLE DISEASES -- summary of reported cases, United States, 1980-1987 ============================================================================================================================================================================================ Disease 1980 1981 1982 1983 1984 1985 1986 1987 --------------------------------------------------------------------------------------------------------------------------------- AIDS * ............... + .................. 4,445 8,249 12,932 21,070 Amebiasis 5,271 6,632 7,304 6,658 5,252 4,433 3,532 3,123 Anthrax 1 - - - 1 - - 1 Aseptic meningitis 8,028 9,547 9,680 12,696 8,326 10,619 11,374 11,487 Botulism, total (including wound and unsp.) 89 103 97 133 123 122 109 82 Foodborne ..................... & ...................... 49 23 17 Infant ..................... & ...................... 70 79 59 Brucellosis 183 185 173 200 131 153 106 129 Chancroid 788 850 1,392 847 665 2,067 3,756 4,998 Cholera 9 19 - 1 1 4 23 6 Diphtheria 3 5 2 5 1 3 - 3 Encephalitis, primary @ 1,362 1,492 1,464 1,761 1,257 1,376 1,302 1,418 Post-infectious @ 40 43 36 34 108 161 124 121 Gonorrhea 1,004,029 990,864 960,633 900,435 878,556 911,419 900,868 780,905 Granuloma inguinale 51 66 17 24 30 44 61 22 Hansen disease (leprosy) 223 256 250 259 290 361 270 238 Hepatitis A (infectious) 29,087 25,802 23,403 21,532 22,040 23,210 23,430 25,280 Hepatitis B (serum) 19,015 21,152 22,177 24,318 26,115 26,611 26,107 25,916 Hepatitis, non-A, non-B .......... + ............. 3,470 3,871 4,184 3,634 2,999 Hepatitis, unspecified 11,894 10,975 8,564 7,149 5,531 5,517 3,940 3,102 Legionellosis ** 475 408 654 852 750 830 980 1,038 Leptospirosis 85 82 100 61 40 57 41 43 Lymphogranuloma venereum 199 263 235 335 170 226 396 303 Malaria 2,062 1,388 1,056 813 1,007 1,049 1,123 944 Measles (rubeola) 13,506 3,124 1,714 1,497 2,587 2,822 6,282 3,655 Meningococcal disease 2,840 3,525 3,056 2,736 2,746 2,479 2,594 2,930 Mumps 8,576 4,941 5,270 3,355 3,021 2,982 7,790 12,848 Murine typhus fever 81 61 58 62 53 37 67 49 Pertussis (whooping cough) 1,730 1,248 1,895 2,463 2,276 3,589 4,195 2,823 Plague 18 13 19 40 31 17 10 12 Poliomyelitis, total 9 6 8 15 8 ........... ++ ........... Paralytic 9 10 11 13 9 7 9 9 Psittacosis 124 136 152 142 172 119 224 98 Rabies, animal 6,421 7,118 6,212 5,878 5,567 5,565 5,504 4,658 Rabies, human - 2 - 2 3 1 - 1 Rheumatic fever, acute 432 264 137 88 117 90 147 141 Rocky Mountain spotted fever 1,163 1,192 976 1,126 838 714 760 604 Rubella (German measles) 3,904 2,077 2,325 970 752 630 551 306 Rubella, congenital syndrome 50 19 7 22 5 - 14 5 Salmonellosis, excluding typhoid fever 33,715 39,990 40,936 44,250 40,861 65,347 49,984 50,916 Shigellosis 19,041 19,859 18,129 19,719 17,371 17,057 17,138 23,860 Syphilis, primary and secondary 27,204 31,266 33,613 32,698 28,607 27,131 27,883 35,147 Total, all stages 68,832 72,799 75,579 74,637 69,888 67,563 68,215 86,545 Tetanus 95 72 88 91 74 83 64 48 Toxic-shock syndrome .......... + ............. 502 482 384 412 372 Trichinosis 131 206 115 45 68 61 39 40 Tuberculosis 27,749 27,373 25,520 23,846 22,255 22,201 22,768 22,517 Tularemia 234 288 275 310 291 177 170 214 Typhoid fever 510 584 425 507 390 402 362 400 Varicella (chickenpox) 190,894 200,766 167,423 177,462 221,983 178,162 183,243 213,196 Yellow fever ....... Last indigenous case reported in 1911; last imported case, 1924 ........ --------------------------------------------------------------------------------------------------------------------------------- * Acquired immunodeficiency syndrome (AIDS). + Not previously notifiable nationally. & Not reported as distinct categories during this period. @ Beginning in 1984, data reflects change in categories for tabulating encephalitis reports that were recorded by date of report to state health departments. Data for previous years are from surveillance records reported by onset date. ** Beginning in 1982, data were recorded by date of report to the state health department. Data for 1976-1981 are from surveillance records reported by onset date. ++ Categories other than paralytic are no longer reported. ============================================================================================================================================================================================ Return to top. Table_4 Note: To print large tables and graphs users may have to change their printer settings to landscape and use a small font size. TABLE 4. NOTIFIABLE DISEASES -- summary of reported cases, United States, 1972-1979 ============================================================================================================================================== Disease 1972 1973 1974 1975 1976 1977 1978 1979 ------------------------------------------------------------------------------------------------------------------------------------- Amebiasis 2,199 2,235 2,743 2,775 2,906 3,044 3,937 4,107 Anthrax 2 2 2 2 2 - 6 - Aseptic meningitis 4,634 4,846 3,197 4,475 3,510 4,789 6,573 8,754 Botulism, total (including wound and unsp.) 22 34 28 20 55 129 105 45 Brucellosis 196 202 240 310 296 232 179 215 Chancroid 1,414 1,165 945 700 628 455 521 840 Cholera - 1 - - - 3 12 1 Diphtheria 152 228 272 307 128 84 76 59 Encephalitis, primary 1,059 1,613 1,164 4,064 1,651 1,414 1,351 1,504 Post-infectious 243 354 218 237 175 119 78 84 Gonorrhea 767,215 842,621 906,121 999,937 1,001,994 1,002,219 1,013,436 1,004,058 Granuloma inguinale 81 62 47 60 71 75 72 76 Hansen disease (leprosy) 130 146 118 162 145 151 168 185 Hepatitis A (infectious) 54,074 50,749 40,358 35,855 33,288 31,153 29,500 30,407 Hepatitis B (serum) 9,402 8,451 10,631 13,121 14,973 16,831 15,016 15,452 Hepatitis, unspecified ...... * ...... 8,351 7,158 7,488 8,639 8,776 10,534 Legionellosis ................ * ................. 235 359 761 593 Leptospirosis 41 57 68 93 73 71 110 94 Lymphogranuloma venereum 756 408 394 353 365 348 284 250 Malaria 742 237 293 373 471 547 731 894 Measles (rubeola) 32,275 26,690 22,094 24,374 41,126 57,345 26,871 13,597 Meningococcal disease 1,323 1,378 1,346 1,478 1,605 1,828 2,505 2,724 Mumps 74,215 69,612 59,128 59,647 38,492 21,436 16,817 14,225 Murine typhus fever 18 32 26 41 69 75 46 69 Pertussis (whooping cough) 3,287 1,759 2,402 1,738 1,010 2,177 2,063 1,623 Plague 1 2 8 20 16 18 12 13 Poliomyelitis, total 31 8 7 8 14 18 15 34 Paralytic 29 7 7 8 12 17 9 26 Psittacosis 52 33 164 49 78 94 140 137 Rabies, animal 4,369 3,640 3,151 2,627 3,073 3,130 3,254 5,119 Rabies, human 2 1 - 2 2 2 4 4 Rheumatic fever, acute 2,614 2,560 2,431 2,854 1,865 1,738 851 629 Rocky Mountain spotted fever 523 668 754 844 937 1,153 1,063 1,070 Rubella (German measles) 25,507 27,804 11,917 16,652 12,491 20,395 18,269 11,795 Rubella, congenital syndrome 42 35 45 30 30 23 30 62 Salmonellosis, excluding typhoid fever 22,151 23,818 21,980 22,612 22,937 27,850 29,410 33,138 Shigellosis 20,207 22,642 22,600 16,584 13,140 16,052 19,511 20,135 Syphilis, primary and secondary 24,429 24,825 25,385 25,561 23,731 20,399 21,656 24,874 Total, all stages 91,149 87,469 83,771 80,356 71,761 64,621 64,875 67,049 Tetanus 128 101 101 102 75 87 86 81 Trichinosis 89 102 120 252 115 143 67 157 Tuberculosis + 32,882 30,998 30,122 33,989 32,105 30,145 28,521 27,669 Tularemia 152 171 144 129 157 165 141 196 Typhoid fever 398 680 437 375 419 398 505 528 Varicella (chickenpox) 164,114 182,927 141,495 154,248 183,990 188,396 154,089 199,081 Yellow fever ........... Last indigenous case reported in 1911, last imported case 1924 ............ ------------------------------------------------------------------------------------------------------------------------------------- * Not previously notifiable nationally. + Case data subsequent to 1974 are not comparable with earlier years because of changes in reporting criteria that became effective in 1975. ============================================================================================================================================== Return to top. Table_5 Note: To print large tables and graphs users may have to change their printer settings to landscape and use a small font size. TABLE 5. NOTIFIABLE DISEASES -- summary of reported cases, United States, 1966-1971 =========================================================================================================== Disease 1966 1967 1968 1969 1970 1971 --------------------------------------------------------------------------------------------------------- Amebiasis 2,921 3,157 3,005 2,915 2,888 2,752 Anthrax 5 2 3 4 2 5 Aseptic meningitis 3,058 3,082 4,494 3,672 6,480 5,176 Botulism 9 5 7 16 12 25 Brucellosis 262 265 218 235 213 183 Chancroid 838 784 845 1,104 1,416 1,320 Cholera - - - - - 1 Diphtheria 209 219 260 241 435 215 Encephalitis, primary 2,121 1,478 1,781 1,613 1,580 1,524 Post-infectious 964 1,060 502 304 370 439 Gonorrhea 351,738 404,836 464,543 534,872 600,072 670,268 Granuloma inguinale 148 154 156 154 124 89 Hansen disease (leprosy) 109 81 123 98 129 131 Hepatitis A (infectious) 32,859 38,909 45,893 48,416 56,797 59,606 Hepatitis B (serum) 1,497 2,458 4,829 5,909 8,310 9,556 Leptospirosis 72 67 69 89 47 62 Lymphogranuloma venereum 308 371 485 520 612 692 Malaria 565 2,022 2,317 3,102 3,051 2,375 Measles (rubeola) 204,136 62,705 22,231 25,826 47,351 75,290 Meningococcal disease 3,381 2,161 2,623 2,951 2,505 2,262 Mumps ...... * ...... 152,209 90,918 104,953 124,939 Murine typhus fever 33 52 36 36 27 23 Pertussis (whooping cough) 7,717 9,718 4,810 3,285 4,249 3,036 Plague 5 3 3 5 13 2 Poliomyelitis, total 113 41 53 20 33 21 Paralytic 106 40 53 18 31 17 Psittacosis 50 41 43 57 35 32 Rabies, animal 4,178 4,481 3,591 3,490 3,224 4,310 Rabies, human 1 2 1 1 3 2 Rheumatic fever, acute 4,472 3,985 3,470 3,229 3,227 2,793 Rocky Mountain spotted fever 268 305 298 498 380 432 Rubella (German measles) 46,975 46,888 49,371 57,686 56,552 45,086 Rubella, congenital syndrome 11 10 14 31 77 68 Salmonellosis, excluding typhoid fever 16,841 18,120 16,514 18,419 22,096 21,928 Shigellosis 11,888 13,474 12,180 11,946 13,845 16,143 Streptococcal sore throat and scarlet fever 427,752 453,351 435,013 450,008 433,405 + Syphilis, primary and secondary 21,414 21,053 19,019 19,130 21,982 23,783 Total, all stages 105,159 102,581 96,271 92,162 91,382 95,997 Tetanus 235 263 178 192 148 116 Trichinosis 115 66 77 215 109 103 Tuberculosis 47,767 45,647 42,623 39,120 37,137 35,217 Tularemia 208 184 186 149 172 187 Typhoid fever 378 396 395 364 346 407 Yellow fever ... Last indigenous case reported in 1911; last imported case, 1924 ... --------------------------------------------------------------------------------------------------------- * Not previously notifiable nationally. + No longer nationally notifiable. =========================================================================================================== Return to top. Table_6 Note: To print large tables and graphs users may have to change their printer settings to landscape and use a small font size. TABLE 6. NOTIFIABLE DISEASES -- deaths from selected diseases, United States, 1984-1993. (Numbers in ICD column refer to the category numbers listed in the Ninth Revision of the International Classification of Diseases, 1994.) =========================================================================================================================================================================================== Cause of Death ICD * 1984 1985 1986 1987 1988 1989 1990 1991 1992 1993 -------------------------------------------------------------------------------------------------------------------------------------------------------------- AIDS + *042-*044 2,943 6,040 10,900 13,468 16,602 22,082 25,188 29,555 33,566 37,267 Anthrax 022 - - - - - - - - - - Botulism, foodborne 005.1 4 4 1 - 1 2 4 2 1 - Brucellosis 023 - 1 1 1 2 - - - - 1 Chancroid 099.0 - - - - - - - 1 - - Cholera 001 - 1 - 1 - - 2 2 2 - Diphtheria 032 - - - 1 - - 1 - 1 - Gonococcal infections 098 3 2 7 7 3 4 3 3 4 5 Haemophilus influenzae, invasive 041.5 14 22 21 25 25 16 16 17 16 7 Hansen disease (leprosy) 030 6 2 1 1 - 4 3 - 2 1 Hepatitis, viral, infectious (Hep A) 070.0,070.1 77 80 65 77 70 88 76 71 82 95 Hepatitis, viral, serum (Hep B) 070.2,070.3 465 490 557 595 621 711 816 912 903 1041 Hepatitis, viral, other and unsp. 070.4-070.9 327 372 384 510 599 717 686 857 1,016 1353 Lyme disease 088.81 - - - - - - - - - - Malaria 084 7 13 5 5 7 11 3 4 8 12 Measles (rubeola) 055 3 4 2 2 3 32 64 27 4 - Meningococcal disease 036 300 257 286 258 278 273 215 198 201 260 Mumps 072 1 - - 2 2 3 1 1 - - Pertussis (whooping cough) 033 7 4 6 1 4 12 12 - 5 7 Plague 020 3 1 - 1 - - - - 1 2 Poliomyelitis, total 045.0-045.9 - 3 - - 1 - - 1 - - Psittacosis 073 - 1 - 2 1 1 2 - 4 1 Rabies, human 071 2 - - 1 - 1 1 3 1 1 Rocky Mountain spotted fever 082.0 34 22 19 21 20 10 20 13 13 5 Rubella (German measles) 056 1 1 1 - 1 4 8 1 1 - Salmonellosis, incl. paratyphoid fever 002.1-002.9,003 90 117 102 105 66 99 80 53 47 52 Shigellosis 004 8 17 4 13 8 16 10 10 8 5 Syphilis 090-097 105 80 80 98 85 105 106 93 91 80 Tetanus 037 20 23 22 16 17 9 11 11 9 11 Trichinosis 124 - 1 - - - 1 - - - - Tuberculosis (all forms) 010-018 1,729 1,752 1,782 1,755 1,921 1,970 1,810 1,713 1,705 1631 Typhoid fever 002.0 - - 2 2 - - 1 1 - - Varicella (chickenpox) 052 53 68 47 89 83 89 120 81 100 100 -------------------------------------------------------------------------------------------------------------------------------------------------------------- * Numbers in ICD column refer to the category numbers listed in the Ninth Revision of the International Classification of Diseases, 1994. (The asterisks in the ICD column pertain to the ICD code, not a footnote. They indicate that the numbers are not part of the ICD but were introduced for use in the United States.) + For 1983-1986, deaths are estimated from death certificates that mention conditions coded to deficiency of cell-mediated immunity (ICD-9 No.279.1). These numbers include other human immunodeficiency virus (HIV)-related deaths and other diseases classifiable as deficiencies of cell-mediated immunity. Source: National Center for Health Statistics System, 1984-1993. Deaths are classified to the Ninth Revision, ICD. =========================================================================================================================================================================================== Return to top. Table_B2 Note: To print large tables and graphs users may have to change their printer settings to landscape and use a small font size.
NOTIFIABLE DISEASES -- Reported cases, by geographic division and area,
United States, 1995 (continued)
========================================================================================================================
                                             Escherichia coli O157:H7                 Haemophilus
                                             ------------------------                 influenzae,
Area                 Chlamydia *+    Cholera    NETSS &    PHLIS @    Gonorrhea +       invasive
-------------------------------------------------------------------------------------------------
United States          477,638          23       2,139      1,531       392,848          1,180

New England             18,248           -         243        139         7,539             46
  Maine                  1,144           -          65          -            94              3
  N.H.                     898           -          NA         21           118             13
  Vt.                      462           -          20         22            69              2
  Mass.                  7,402           -         118         96         2,658             16
  R.I.                   1,902           -           3          -           545              5
  Conn.                  6,440           -          37          -         4,055              7

Mid. Atlantic           53,703           4         242        209        44,813            177
  N.Y. (excl. NYC)          NN           1         169        114         9,493             45
  N.Y.C.                26,686           1           7          -        16,499             36
  N.J.                   4,056           1          66         51         5,783             32
  Pa.                   22,961           1          NN         44        13,038             64

E.N. Central            93,492           2         372        358        77,547            190
  Ohio                  29,124           -         107         59        23,176             99
  Ind.                   9,102           1          64         42         8,880             22
  Ill.                  24,645           1         126         90        21,747             48
  Mich.                 21,666           -          75         49        18,220             18
  Wis.                   8,955           -          NN        118         5,524              3

W.N. Central            34,055           1         415        278        20,106             94
  Minn.                  6,032           1         199        186         2,852             56
  Iowa                   5,089           -          66         52         1,723              3
  Mo.                   12,110           -          48          -        11,326             28
  N. Dak.                1,324           -           8          8            38              -
  S. Dak.                1,313           -          23         12           237              1
  Nebr.                  2,873           -          42          -         1,133              3
  Kans.                  5,314           -          29         20         2,797              3

S. Atlantic             85,575           2         135         83       110,052            236
  Del.                   2,701           1           5          2         2,201              -
  Md.                    8,740           -          NN          8        12,984             74
  D.C.                   1,665           -           -          -         5,687              -
  Va.                   12,285           -          NN         32        10,340             28
  W. Va.                 2,326           -          NN          3           860             11
  N.C.                  15,780           -          45         29        23,961             34
  S.C.                   8,591           -          10          5        12,120              3
  Ga.                   11,193           -          29          -        21,025             71
  Fla.                  22,294           1          46          4        20,874             15

E.S. Central            24,158           -          38         38        42,837             12
  Ky.                    6,904           -          19         15         4,751              5
  Tenn.                 13,154           -          NN         23        13,892              -
  Ala.                   3,188           -          16          -        14,683              6
  Miss.                    912           -           3          -         9,511              1

W.S. Central            59,483           2          69         18        50,800             80
  Ark.                     680           -          15          7         5,630              6
  La.                    9,111           -          NN          3         9,292              1
  Okla.                  5,065           -          16          8         5,077             31
  Tex.                  44,627           2          38          -        30,801             42

Mountain                29,361           3         278        122         9,509            122
  Mont.                  1,198           -          60          -            65              1
  Idaho                  1,739           -          63         35           149              6
  Wyo.                     703           -          NN          7            51             11
  Colo.                  6,650           1          93         37         2,803             16
  N. Mex.                4,285           1          10          5         1,054             16
  Ariz.                 10,061           1          NN         26         3,844             30
  Utah                   1,676           -          29          -           306             12
  Nev.                   3,049           -          23         12         1,237             30

Pacific                 79,563           9         347        286        29,645            223
  Wash.                  9,462           -         140        132         2,765             11
  Oreg.                  5,465           -          89         61           854             28
  Calif.                62,501           9         118         77        24,803            178
  Alaska                    NN           -          NN          1           660              2
  Hawaii                 2,135           -          NN         15           563              4

  Guam                     461           -           1          -            90              -
  P.R.                   2,305           -          43         NA           618              3
  V.I.                      17           -           -         NA            31              -
  C.N.M.I.                  NA           9          NN          -            NA             11
  American Samoa            NA          NA          NA         NA            NA             NA
-------------------------------------------------------------------------------------------------
* Chlamydia refers to genital infections caused by C. trachomatis.                               NA: Not Available
+ Cases were updated through the Division of Sexually Transmitted Diseases Prevention, NCHSTP,   NN: Not Notifiable
  as of March 1, 1996.                                                                            -: No reported cases
& Data from the National Electronic Telecommunications System for Surveillance.
@ Data from the Public Health Laboratory Information System.
========================================================================================================================
Return to top. Table_B3 Note: To print large tables and graphs users may have to change their printer settings to landscape and use a small font size.
NOTIFIABLE DISEASES -- Reported cases, by geographic division and area,
United States, 1995 (continued)
============================================================================================
                                        Hepatitis
                     Hansen     --------------------------
                     disease                      C/non-A,   Legionel-    Lyme
Area                (leprosy)      A        B      non-B       losis     disease   Malaria
------------------------------------------------------------------------------------------
United States             144   31,582   10,805    4,576       1,241     11,700     1,419

New England                 7      333      252      142          41      2,164        52
  Maine                     -       30       12        -           6         45         7
  N.H.                      -       13       23       14           2         28         2
  Vt.                       -        8        7       14           2          9         1
  Mass.                     7      161      114      106          24        189        21
  R.I.                      -       35       10        8           7        345         4
  Conn.                     -       86       86        -          NN      1,548        17

Mid. Atlantic              14    2,091    1,599      590         226      7,703       402
  N.Y. (excl. NYC)          1      523      414      341          65      3,983        75
  N.Y.C.                   12    1,008      524        1           6        455       222
  N.J.                      1      312      368      189          33      1,703        73
  Pa.                       -      248      293       59         122      1,562        32

E.N. Central                3    3,160    1,130      358         341        441       160
  Ohio                      1    1,760      116       15         151         30        13
  Ind.                      1      189      241       14          81         19        20
  Ill.                      1      663      293       86          36         18        78
  Mich.                     -      364      398      243          35          5        26
  Wis.                      -      184       82        -          38        369        23

W.N. Central                2    1,992      675       91         121        306        36
  Minn.                     -      198       93        4          49        208        12
  Iowa                      -      107       46       15          21         16         3
  Mo.                       1    1,338      437       23          19         53         9
  N. Dak.                   -       23        5        7           3          -         2
  S. Dak.                   -       99        2        1           3          -         2
  Nebr.                     1       65       39       23          18          6         4
  Kans.                     -      162       53       18           8         23         4

S. Atlantic                 4    1,434    1,599      316         199        726       277
  Del.                      -       12        9        -           2         56         1
  Md.                       2      221      262        7          29        454        63
  D.C.                      -       26       21        -           5          3        16
  Va.                       -      238      118       21          28         55        55
  W. Va.                    -       24       53       44           4         26         4
  N.C.                      -      111      311       64          34         84        20
  S.C.                      1       46       56       21          30         17         3
  Ga.                       -       84      103       28          19         14        41
  Fla.                      1      672      666      131          48         17        74

E.S. Central                -    2,312      830    1,020          56         73        27
  Ky.                       -       44       69       34          10         16         3
  Tenn.                     -    1,951      647      983          26         28        10
  Ala.                      -       93      114        3           8         12        11
  Miss.                     -      224       NA       NA          12         17         3

W.S. Central               38    5,287    1,712      631          32        160       100
  Ark.                      1      663       83        8           8         11         3
  La.                       1      196      243      222           3          9         7
  Okla.                     -    1,427      173       54           8         63         1
  Tex.                     36    3,001    1,213      347          13         77        89

Mountain                    -    4,346      879      519         116         13        66
  Mont.                     -      173       24       18           4          -         3
  Idaho                     -      353      102       58           3          -         2
  Wyo.                      -      110       33      223          12          4         1
  Colo.                     -      509      138       69          42          -        26
  N. Mex.                   -      808      321       53           6          1         7
  Ariz.                     -    1,363      121       59          13          1        15
  Utah                      -      696       75       13          16          1         6
  Nev.                      -      334       65       26          20          6         6

Pacific                    76   10,627    2,129      909         109        114       299
  Wash.                     3      937      226      234          22         10        23
  Oreg.                     1    2,723      129       37           -         20        21
  Calif.                   52    6,751    1,729      511          82         84       238
  Alaska                    1       50       13        3           -          -         5
  Hawaii                   19      166       32      124           5          -        12

  Guam                      7       10        5        6           1          -         2
  P.R.                      -      120      689      216           -          -         1
  V.I.                      -        9       16        -           -          -         2
  C.N.M.I.                  6       24       22        5           -          -         1
  American Samoa           NA       NA       NA       NA          NA         NA        NA
------------------------------------------------------------------------------------------
                                                                     NA: Not Available
                                                                     NN: Not Notifiable
                                                                      -: No reported cases
============================================================================================
Return to top. Table_B4 Note: To print large tables and graphs users may have to change their printer settings to landscape and use a small font size.
NOTIFIABLE DISEASES -- Reported cases, by geographic division and area,
United States, 1995 (continued)
=============================================================================================================================
Measles Meningo- Polio-
------------------------ coccal myelitis,
Area Indigenous Imported * disease Mumps Pertussis Plague paralytic +
------------------------------------------------------------------------------------------------------
United States 281 28 3,243 906 5,137 9 2
New England 10 3 165 13 731 - -
Maine - - 17 4 47 - -
N.H. - - 29 1 70 - -
Vt. - - 11 - 81 - -
Mass. 3 2 51 3 492 - -
R.I. 6 - 7 1 7 - -
Conn. 1 1 50 4 34 - -
Mid. Atlantic 9 5 372 134 469 - 1
N.Y. (excl. NYC) 1 - 106 33 253 - -
N.Y.C. 2 3 54 17 67 - -
N.J. 6 2 74 21 20 - -
Pa. - - 138 63 129 - 1
E.N. Central 11 4 419 172 667 - -
Ohio 1 1 115 54 175 - -
Ind. - - 65 10 76 - -
Ill. - 2 110 48 155 - -
Mich. 4 1 75 60 103 - -
Wis. 6 - 54 - 158 - -
W.N. Central 12 - 201 52 369 - 1
Minn. 9 - 31 11 238 - -
Iowa - - 31 11 11 - -
Mo. 2 - 76 25 63 - -
N. Dak. - - 2 1 8 - 1
S. Dak. - - 11 - 12 - -
Nebr. - - 22 4 14 - -
Kans. 1 - 28 - 23 - -
S. Atlantic 14 5 601 163 388 - -
Del. - - 6 - 10 - -
Md. - 1 42 41 49 - -
D.C. - - 8 - 8 - -
Va. - - 64 28 31 - -
W. Va. - - 10 - 1 - -
N.C. - - 86 42 137 - -
S.C. - - 59 13 28 - -
Ga. 4 - 124 11 30 - -
Fla. 10 4 202 28 94 - -
E.S. Central - - 244 20 277 - -
Ky. - - 51 - 27 - -
Tenn. - - 106 5 209 - -
Ala. - - 49 5 38 NN -
Miss. - - 38 10 3 - -
W.S. Central 31 3 404 66 342 - -
Ark. 2 - 39 7 59 - -
La. 17 1 63 15 22 - -
Okla. - - 49 1 44 - -
Tex. 12 2 253 43 217 - -
Mountain 68 2 218 33 743 5 -
Mont. - - 4 1 9 - -
Idaho 1 1 21 4 116 - -
Wyo. - - 8 - 1 - -
Colo. 26 - 49 3 149 - -
N. Mex. 30 1 36 NN 148 4 -
Ariz. 10 - 63 2 164 1 -
Utah - - 18 11 37 - -
Nev. 1 - 19 12 119 - -
Pacific 126 6 619 253 1,151 4 -
Wash. 20 - 126 16 491 - -
Oreg. - 1 117 NN 67 1 -
Calif. 106 3 356 211 531 3 -
Alaska - - 15 12 1 - -
Hawaii - 2 5 14 61 - -
Guam - - 3 4 2 - -
P.R. 3 - 24 3 3 - -
V.I. - - - 3 - - -
C.N.M.I. - - - 1 - - -
American Samoa NA NA NA NA NA NA NA
------------------------------------------------------------------------------------------------------
* Imported cases include only those imported from other countries. NA: Not Available
+ Seven additional suspected cases of paralytic poliomyelitis were reported in 1995. Confirmation NN: Not Notifiable
of these cases is pending review by an external panel. -: No reported cases
=============================================================================================================================
Return to top. Table_B5 Note: To print large tables and graphs users may have to change their printer settings to landscape and use a small font size.
NOTIFIABLE DISEASES -- Reported cases, by geographic division and area,
United States, 1995 (continued)
==========================================================================================================
Rubella
Rabies -------------------
Psitta- --------------- Cong. Salmonel- Shigel-
Area cosis Animal Human RMSF * Rubella syndrome losis losis
--------------------------------------------------------------------------------------------------------
United States 64 7,811 5 590 128 6 45,970 32,080
New England 1 1,512 1 2 52 - 3,355 664
Maine 1 101 - - - - 183 25
N.H. - 152 - - 1 - 188 71
Vt. - 179 - - - - 102 11
Mass. - 401 - 1 11 - 1,862 324
R.I. - 317 - - - - 221 70
Conn. - 362 1 1 40 - 799 163
Mid. Atlantic 12 1,923 - 43 16 1 8,157 3,531
N.Y. (excl. NYC) 5 1,157 - 12 5 - 1,912 985
N.Y.C. - - - 6 8 1 2,159 845
N.J. 1 326 - 15 3 - 1,734 1,038
Pa. 6 440 - 10 - - 2,352 663
E.N. Central 8 113 - 37 4 - 6,203 3,299
Ohio 1 12 - 17 - - 1,545 598
Ind. 2 24 - 9 - - 701 411
Ill. - 16 - 10 - - 2,087 1,539
Mich. 2 43 - 1 4 - 950 487
Wis. 3 18 - - - - 920 264
W.N. Central - 396 - 41 1 1 2,602 2,560
Minn. - 37 - - - - 737 197
Iowa - 141 - - - - 433 350
Mo. - 30 - 30 - 1 577 1,138
N. Dak. - 32 - - - - 83 146
S. Dak. - 105 - 1 - - 108 200
Nebr. - 5 - 6 - - 301 227
Kans. - 46 - 4 1 - 363 302
S. Atlantic 15 2,254 1 280 14 - 9,961 5,895
Del. - 96 - 3 - - 208 247
Md. 2 439 - 36 1 - 1,215 639
D.C. - 11 - - - - 154 197
Va. 1 459 - 34 - - 1,358 412
W. Va. - 116 - 4 - - 169 59
N.C. 3 466 - 150 1 - 1,176 1,006
S.C. 3 125 - 37 - - 633 251
Ga. 5 294 - 9 - - 1,662 1,358
Fla. 1 248 1 7 12 - 3,386 1,726
E.S. Central 1 285 - 83 1 - 2,022 1,575
Ky. - 28 - 16 - - 433 332
Tenn. 1 98 - 32 1 - 454 400
Ala. - 150 - 3 - - 581 510
Miss. - 9 - 32 NN - 554 333
W.S. Central - 728 - 86 8 - 3,743 3,932
Ark. - 52 - 31 - - 338 176
La. - 54 - 2 - - 590 485
Okla. - 32 - 47 - - 452 254
Tex. - 590 - 6 8 - 2,363 3,017
Mountain 4 192 - 16 5 - 2,198 4,538
Mont. - 46 - 5 - - 103 286
Idaho - 3 - - - - 85 124
Wyo. - 32 - 5 - - 37 15
Colo. 2 16 - 5 1 - 594 528
N. Mex. - 6 - - - - 342 1,089
Ariz. - 57 - - 3 - 519 1,610
Utah 1 15 - 1 1 - 280 764
Nev. 1 17 - - - - 238 122
Pacific 23 408 3 2 27 4 7,729 6,086
Wash. 7 15 1 1 1 - 691 425
Oreg. 3 4 - 1 - - 344 168
Calif. 13 382 2 - 21 4 6,343 5,371
Alaska - 7 - NN - - 48 20
Hawaii - - - - 5 - 303 102
Guam - - - - 1 - 40 19
P.R. - 39 - - - - 770 57
V.I. - - - - - - 9 6
C.N.M.I. - - - - - - 42 41
American Samoa NA NA NA NA NA NA NA NA
--------------------------------------------------------------------------------------------------------
* Rocky Mountain spotted fever. NA: Not Available
NN: Not Notifiable
-: No reported cases
==========================================================================================================
Return to top. Table_B6 Note: To print large tables and graphs users may have to change their printer settings to landscape and use a small font size.
NOTIFIABLE DISEASES -- Reported cases, by geographic division and area,
United States, 1995 (continued)
============================================================================================================================
Syphilis *
------------------------------- Toxic-
Primary & Cong. All shock Trich- Tuber- Typhoid
Area secondary (<1 yr.) stages Tetanus syndrome inosis culosis + fever
-----------------------------------------------------------------------------------------------------------
United States 16,500 1,463 68,953 41 191 29 22,860 369
New England 161 9 905 - 7 2 574 35
Maine 2 - 4 - 1 - 28 -
N.H. - - 32 - - - 23 1
Vt. - - - - 2 - 4 -
Mass. 69 2 508 - - 1 330 31
R.I. 4 - 90 - 4 - 50 1
Conn. 86 7 271 - - 1 139 2
Mid. Atlantic 885 415 12,230 4 35 2 4,588 120
N.Y. (excl. NYC) 85 45 999 2 20 - 621 12
N.Y.C. 364 191 7,791 - 4 1 2,445 66
N.J. 188 109 1,490 - - 1 848 27
Pa. 248 70 1,950 2 11 - 674 15
E.N. Central 2,732 202 8,257 8 44 3 2,044 41
Ohio 896 44 1,944 2 8 - 280 5
Ind. 321 10 880 1 3 2 199 3
Ill. 1,026 121 3,649 4 11 - 1,024 25
Mich. 304 21 1,204 1 17 - 424 4
Wis. 185 6 580 - 5 1 117 4
W.N. Central 738 48 1,822 8 34 8 618 9
Minn. 45 - 187 3 6 - 156 5
Iowa 48 - 171 - 5 8 72 -
Mo. 584 46 1,271 3 14 - 244 3
N. Dak. - - - - 1 - 5 -
S. Dak. - - 7 - 1 - 28 -
Nebr. 14 - 35 - 5 - 24 -
Kans. 47 2 151 2 2 - 89 1
S. Atlantic 4,212 297 15,862 6 24 - 4,113 43
Del. 19 1 129 - - - 56 1
Md. 479 14 1,471 - 2 - 370 6
D.C. 112 18 727 - - - 102 -
Va. 600 22 1,587 - 3 - 359 10
W. Va. 16 - 66 1 - - 71 3
N.C. 1,132 25 3,058 - 7 - 519 5
S.C. 570 49 1,676 - 4 - 334 -
Ga. 901 53 3,678 1 1 - 746 -
Fla. 383 115 3,470 4 7 - 1,556 18
E.S. Central 3,655 133 9,298 1 7 - 1,483 2
Ky. 185 8 502 - 2 - 327 -
Tenn. 906 33 2,608 1 5 - 465 1
Ala. 612 10 1,639 - - - 420 1
Miss. 1,952 82 4,549 - NN - 271 -
W.S. Central 3,273 228 13,423 5 1 - 3,353 24
Ark. 495 4 1,245 - 1 - 271 1
La. 1,024 17 3,675 2 - - 476 1
Okla. 197 13 585 - - - 237 1
Tex. 1,557 194 7,918 3 - - 2,369 21
Mountain 204 12 1,129 3 10 11 702 5
Mont. 4 - 13 - - - 21 -
Idaho - - 12 - 2 9 14 -
Wyo. 1 - 2 - 1 2 5 -
Colo. 100 2 304 2 3 - 95 -
N. Mex. 13 - 138 - 1 - 85 -
Ariz. 46 8 415 - - - 319 5
Utah 4 - 50 - 3 - 48 -
Nev. 36 2 195 1 - - 115 -
Pacific 640 119 6,027 6 29 3 5,385 90
Wash. 17 2 212 - 1 - 278 4
Oreg. 5 - 67 - - - 156 4
Calif. 616 117 5,703 5 28 3 4,677 75
Alaska 2 - 20 - - - 81 -
Hawaii - - 25 1 - - 193 7
Guam - - 6 1 - - NA 1
P.R. 285 3 1,608 - - - 263 3
V.I. 2 - 19 - - - 4 -
C.N.M.I. NA NA NA 1 - - 37 96
American Samoa NA NA NA NA NA NA NA NA
-----------------------------------------------------------------------------------------------------------
* Cases were updated through the Division of Sexually Transmitted Diseases Prevention, NCHSTP, NA: Not Available
as of March 1, 1996. NN: Not Notifiable
+ Cases were updated through the Division of Tuberculosis Elimination, NCHSTP, as of May 29, 1996. -: No reported cases
============================================================================================================================
Return to top. Disclaimer All MMWR HTML versions of articles are electronic conversions from ASCII text into HTML. This conversion may have resulted in character translation or format errors in the HTML version. Users should not rely on this HTML document, but are referred to the electronic PDF version and/or the original MMWR paper copy for the official text, figures, and tables. An original paper copy of this issue can be obtained from the Superintendent of Documents, U.S. Government Printing Office (GPO), Washington, DC 20402-9371; telephone: (202) 512-1800. Contact GPO for current prices. **Questions or messages regarding errors in formatting should be addressed to mmwrq@cdc.gov.Page converted: 09/19/98 |
|||||||||
This page last reviewed 5/2/01
|