 |
|
|
|
|
|
|
| ||||||||||
|
|
|
|
|
|
|
||||
| ||||||||||
|
|
| Weekly |
| October 06, 1995 / 43(53);1 |
|
|
|
Persons using assistive technology might not be able to fully access information in this file. For assistance, please send e-mail to: mmwrq@cdc.gov. Type 508 Accommodation and the title of the report in the subject line of e-mail. Summary of Notifiable Diseases, United States, 1994Foreword MMWR Summary of Notifiable Diseases, United States, 1994 This publication contains summary tables of the official statistics for the reported occurrence of nationally notifiable diseases in the United States for the year 1994. This information is collected and compiled from reports to the National Notifiable Diseases Surveillance System (NNDSS). Because the dates of onset and dates of diagnosis for notifiable diseases are often unknown, these surveillance data are presented by the week that they were reported to public health officials. These data are then finalized and published in the MMWR Summary of Notifiable Diseases, United States, for use by state and local health departments; schools of medicine and public health; communications media; local, state, and federal agencies; and other agencies or persons interested in following the trends of reportable conditions in the United States. Publication of the annual summary also ensures documentation of diseases that are considered national priorities for notification and of the annual number of cases of such diseases. Part 1 contains information on morbidity for each of the conditions considered nationally notifiable during 1994. In all tables, leprosy is listed as Hansen disease and typhus fever (tick-borne) as Rocky Mountain spotted fever (RMSF). The tables show the number of cases of notifiable diseases reported to CDC for 1994, as well as the distribution of cases by month and geographic location, and by patient's age, race, and ethnicity. The data are final totals as of July 7, 1995, unless otherwise noted. Part 2 contains graphs and maps depicting summary data for many of the notifiable conditions described in tabular form in Part Part 3 includes tables showing the number of cases of notifiable diseases reported to CDC and to the National Office of Vital Statistics since 1945. It also includes a table on deaths associated with specified notifiable diseases reported to the National Center for Health Statistics, CDC, for the period 1983-1992. Background As of January 1, 1994, 49 infectious diseases were designated as notifiable at the national level. A notifiable disease is one for which regular, frequent, and timely information on individual cases is considered necessary for the prevention and control of the disease. This section briefly summarizes the history of national notifiable disease reporting in the United States. In 1878, Congress authorized the U.S. Marine Hospital Service (the precursor to the Public Health Service, PHS) to collect morbidity reports on cholera, smallpox, plague, and yellow fever from U.S. consuls overseas; this information was to be used for instituting quarantine measures to prevent the introduction and spread of these diseases into the United States. In 1879, a specific Congressional appropriation was made for the collection and publication of reports of these notifiable diseases. The authority for weekly reporting and publication was expanded by Congress in 1893 to include data from states and municipal authorities. To increase the uniformity of the data, Congress enacted a law in 1902 directing the Surgeon General to provide forms for the collection and compilation of data and for the publication of reports at the national level. In 1912, state and territorial health authorities -- in conjunction with PHS -- recommended immediate telegraphic reporting of five infectious diseases and monthly reporting by letter of 10 additional diseases. The first annual summary of The Notifiable Diseases in 1912 included reports of 10 diseases from 19 states, the District of Columbia, and Hawaii. By 1928, all states, the District of Columbia, Hawaii, and Puerto Rico were participating in national reporting of nearly 30 specified conditions. At their annual meeting in 1950, the State and Territorial Health Officers authorized a conference of state and territorial epidemiologists whose purpose was to determine which diseases should be reported to PHS. CDC assumed responsibility for the collection and publication of data on nationally notifiable diseases in 1961. The list of nationally notifiable diseases is revised periodically. For example, diseases may be added to the list as new pathogens emerge or deleted as their incidence declines. Public health officials at state health departments and CDC continue to collaborate in determining which diseases should be nationally notifiable; the Council of State and Territorial Epidemiologists (CSTE), with CDC input, makes recommendations annually for additions and deletions to the list of nationally notifiable diseases. However, reporting of nationally notifiable diseases to CDC by the states is voluntary. Reporting is currently mandated (by state legislation or regulation) only at the state level. The list of diseases that are considered notifiable, therefore, varies slightly by state. All states generally report the internationally quarantinable diseases (i.e., cholera, plague, and yellow fever) in compliance with the World Health Organization's International Health Regulations. During 1994, 49 infectious diseases were considered notifiable at the national level and were reported to CDC; 41 were reported on a weekly basis, and eight were reported monthly. CSTE and CDC held a national surveillance conference November 30-December 2, 1994 to review the state of national infectious disease surveillance. Infectious diseases that have been approved for addition to national surveillance during 1995 are Chlamydia trachomatis (genital infections), coccidioidomycosis (for regional surveillance), cryptosporidiosis, hantavirus infection, (post-diarrheal) hemolytic uremic syndrome, pediatric infection with the human immunodeficiency virus, invasive group A streptococcal infections, streptococcal toxic-shock syndrome, and drug-resistant Streptococcus pneumoniae. These conditions currently are not reportable in all states, and the mechanism for reporting may not involve clinicians or consist of reports of individual cases (i.e., traditional notification methods). Reports of the number of cases of these conditions will not appear in the current year tables before 1996. At the 1994 conference the following diseases were also proposed as deletions from the list of infectious diseases under national surveillance: amebiasis, aseptic meningitis, primary encephalitis (except for arboviral encephalitis), postinfectious encephalitis, granuloma inguinale, unspecified hepatitis, leptospirosis, lymphogranuloma venereum, rheumatic fever, and tularemia. These changes were confirmed by a vote of the full membership of CSTE in early 1995. The number of reported cases of these diseases will not appear in the current year tables after 1994. The list of 49 infectious diseases that were designated as notifiable at the national level during 1994 appears below: AIDS Amebiasis Anthrax Aseptic meningitis * Botulism ** Brucellosis Chancroid ** Cholera Diphtheria Encephalitis, primary * Encephalitis, postinfectious * Escherichia coli O157:H7 ** Gonorrhea Granuloma inguinale * Haemophilus influenzae, invasive Hansen disease (leprosy) Hepatitis A Hepatitis B Hepatitis, non-A, non-B Hepatitis C, unspecified * Legionellosis Leptospirosis * Lyme disease Lymphogranuloma venereum * Malaria Measles Meningococcal disease Mumps Pertussis Plague Poliomyelitis Psittacosis Rabies, animal Rabies, human Rheumatic fever * Rocky Mountain spotted fever (RMSF) Rubella Rubella, congenital syndrome Salmonellosis ** Shigellosis ** Syphilis Syphilis, congenital Tetanus Toxic-shock syndrome Trichinosis Tuberculosis Tularemia * Typhoid fever Yellow fever **
Data Sources Provisional data on the reported occurrence of notifiable diseases are published weekly in MMWR. After each reporting year, staff in state health departments finalize reports of cases for the year with local or county health departments, as well as reconcile the data with reports previously sent to CDC throughout the year; these data are compiled in final form in this summary. Notifiable disease reports (published in the annual MMWR Summary of Notifiable Diseases only after the approval of each state epidemiologist) are the authoritative and archival counts of cases. MMWR Surveillance Summaries or other surveillance reports produced by CDC programs, which are useful for detailed epidemiologic analyses, may not agree exactly with numbers reported in the annual Summary of Notifiable Diseases due to differences in the timing of reports, the source of the data, and the use of different case definitions. Data in this summary are derived primarily from reports transmitted to the Division of Surveillance and Epidemiology, Epidemiology Program Office, CDC, by the 50 state, two city, and five territorial health departments through the National Electronic Telecommunications System for Surveillance (NETSS). Final data for other diseases are from surveillance program records of the CDC programs listed below; requests for further information regarding these data should be directed to the source specified. National Center for Health Statistics Office of Vital and Health Statistics Systems (deaths from selected notifiable diseases) National Center for Infectious Diseases Division of Bacterial and Mycotic Diseases (toxic-shock syndrome and laboratory data on botulism, Escherichia coli O157:H7, Salmonella, and Shigella) Division of HIV/AIDS (human immunodeficiency virus/acquired immunodeficiency syndrome) Division of Vector-Borne Infectious Diseases (laboratory data on arboviral encephalitis) Division of Viral and Rickettsial Diseases (animal rabies) National Center for Prevention Services Division of Sexually Transmitted Diseases and HIV Prevention (gonorrhea, syphilis, chancroid, granuloma inguinale, and lymphogranuloma venereum) Division of Tuberculosis Elimination (tuberculosis) National Immunization Program Epidemiology and Surveillance Division (poliomyelitis) Disease totals for the United States, unless otherwise stated, do not include data for American Samoa, Guam, Puerto Rico, the Virgin Islands, and the Commonwealth of the Northern Mariana Islands (CNMI). Data on notifiable diseases before 1960 (before CDC assumed responsibility for collection and publication of these data) are obtained from publications of the National Office of Vital Statistics. Population estimates for states are based on the July 1, 1994, post-censal estimates made by the U.S. Department of Commerce, Bureau of the Census, Population Division, Population Estimates Branch, Press Release CB94-204. Population estimates for territories are from the 1990 census, U.S. Department of Commerce, Bureau of the Census, Press Releases CB91-142, 242, 243, 263, and 276. Rates in the 1994 Summary of Notifiable Diseases were based on data for the U.S. total resident population. However, population data from states in which diseases were not notifiable or disease data were not available were excluded from rate calculations. Interpreting Data The data reported in this summary are useful for analyzing disease trends and determining relative disease burdens. However, these data must be interpreted in light of reporting practices. Some diseases that cause severe clinical illness (e.g., plague or rabies), if diagnosed by a clinician, are most likely reported accurately. However, persons who have diseases that are clinically mild and infrequently associated with serious consequences (e.g., salmonellosis) may not even seek medical care from a health-care provider; even if these diseases are diagnosed, they are less likely to be reported. The degree of completeness of reporting also is influenced by the diagnostic facilities available; the control measures in effect; the public awareness of a specific disease; and the interests, resources, and priorities of state and local officials responsible for disease control and public health surveillance. Finally, factors such as changes in the case definitions for public health surveillance, the introduction of new diagnostic tests, or the discovery of new disease entities may cause changes in disease reporting that are independent of the true incidence of disease. Public health surveillance data are published for selected racial and ethnic population groups because these variables may be risk markers for certain notifiable diseases. Risk markers can identify potential risk factors for investigation in future studies. Data on race and ethnicity also can be useful for identifying groups to target for prevention efforts. Year 2000 objectives for racial and ethnic groups (standardized to the 1940 U.S. population) have been established for several of the notifiable diseases. HIGHLIGHTS FOR SELECTED INFECTIOUS DISEASES NOT NATIONALLY NOTIFIABLE DURING 1994 Chlamydia Chlamydia trachomatis infections are common among adolescents and young adults. An estimated 10% of sexually active adolescent females are infected with chlamydia. In 1994, 47 states reported 448,984 chlamydia infections. From 1984 through 1994, reported cases increased from 3.2 cases per 100,000 to 188.4. This trend may reflect increasing recognition and interest among health-care providers and public health officials. Coccidioidomycosis An outbreak of coccidioidomycosis occurred in Ventura County, California, following the 1994 Northridge earthquake. From January 24 through March 15, 1994, 203 infected persons were identified, compared with 52 cases that were reported through passive surveillance in the county in 1993. The National Center for Infectious Diseases (NCID/CDC) Emerging Infections Program (EIP), in collaboration with the State of California Department of Health Services, is conducting active surveillance for coccidioidomycosis in 10 California counties. Cryptosporidiosis In 1994, waterborne outbreaks of cryptosporidiosis were investigated in Las Vegas, Nevada, Walla Walla, Washington, and Lake Nummy, New Jersey, focusing national attention on the potential for waterborne transmission of Cryptosporidium. In September 1994, a national workshop on waterborne cryptosporidiosis was held at CDC, which resulted in guidelines and recommendations for prevention of cryptosporidiosis in severely immunosuppressed persons, appropriate public health responses to the problem, and epidemiologic and laboratory-based surveillance and research. Hantavirus Hantavirus Pulmonary Syndrome (HPS) is a recently recognized hantaviral illness caused by Sin Nombre virus and the newly identified Black Creek Canal and Bayou viruses. The identified rodent reservoirs for these viruses -- Peromyscus maniculatus and leucopus (deer and white-footed mice) for Sin Nombre virus and its variants and Sigmodon hispidus (cotton rat) for Black Creek Canal virus -- extend across the continental United States. As of July 20, 1995, national surveillance for HPS has identified 113 confirmed case-patients in 23 states (case fatality rate: 52%); 31 of these cases occurred in 1994. Invasive group A streptococcal infections Prospective and retrospective active surveillance data for invasive group A streptococcal (GAS) infections were analyzed and several risk groups identified, including: persons who have human immunodeficiency virus (HIV) infections and acquired immunodeficiency syndrome (AIDS), injecting-drug users, persons who have cancer, diabetes mellitus, heart disease or chronic lung disease, alcohol abusers, and children who have varicella. Although different GAS strains have been identified from individual case patients, M-type 1 strains predominated. Drug-resistant Streptococcus pneumoniae In the United States, the prevalence of drug-resistant Streptococcus pneumoniae (DRSP) has increased since 1987 from 3.6% to 14.5%, according to limited voluntary reporting by 12 sentinel hospitals. Limited 1994 surveillance data from these hospitals indicate the proportion of invasive disease (bacteremia and meningitis) caused by penicillin-resistant pneumococci ranges from 3% to 30% and shows widespread geographic variation. Information regarding community-specific DRSP prevalence is needed to assist clinicians in choosing optimal empiric therapy. To enhance efficient and timely reporting, CDC is currently piloting an electronic laboratory-based surveillance system. Vancomycin-resistant enterococci In 1994, the percentage of nosocomial enterococci reported as resistant to vancomycin increased from 11.5% in 1993 to 13.6% among Intensive Care Unit (ICU) isolates and from 4.9% to 9.1% among noncritical care unit isolates. The increase was more dramatic among isolates from noncritical care units, suggesting that vancomycin-resistant enterococci are spreading from their focus in ICUs. Pneumonia of unknown etiology From 1979 to 1994, the overall crude death rate for pneumonia and influenza increased 59%, from 20.0 to 31.8 deaths per 100,000. Through 1992 (the most recent year for which complete data are available), pneumonia of unspecified etiology (ICD-9 code 486) accounted for most of the overall increase -- the age-adjusted death rates in this diagnostic category increased 74%. Since the 1970s, several previously unrecognized infectious agents have been identified as causes of lower respiratory infections, including Legionella pneumophila, Chlamydia pneumoniae, and Sin Nombre virus. Recent prospective studies of community-acquired pneumonia indicate that an etiology cannot be identified in up to 50% of cases. Transfusion-associated infectious diseases An Institute of Medicine committee recently released the report, "HIV and the Blood Supply: An Analysis of Crisis Decisionmaking," calling for the establishment of a surveillance system at CDC to detect, monitor, and warn of adverse effects in the recipients of blood and blood products. CDC is reviewing existing surveillance systems to highlight and address areas that need improvement. Diseases that are being examined to evaluate the level of risk associated with transfusion include HIV/AIDS, Chagas disease, babesiosis, Creutzfeld-Jacob disease, the hepatitis viruses, malaria, and transfusion-associated sepsis. INTERNATIONAL NOTES Dengue Although dengue fever is not endemic in the United States, its incidence is increasing in most tropical areas throughout the world. In 1994, CDC processed serum samples from 91 residents of 27 states and the District of Columbia who had travelled to countries where dengue is endemic. Among these 91 persons, 37 (40.7%) cases of dengue were diagnosed serologically or virologically. Plague During September and October 1994, outbreaks of bubonic and pneumonic plague were reported from sites east and north of Bombay, India, respectively. A lack of reliable epidemiologic information contributed to the ensuing international health emergency. Evidence revealed that plague did not occur in international travelers or spread beyond the original foci. Bibliography General Benenson AS. Control of communicable diseases in man. 15th ed. Washington, DC: American Public Health Association, 1990. CDC. Manual of procedures for the reporting of nationally notifiable diseases to CDC. Atlanta: US Department of Health and Human Services, Public Health Service, CDC, 1995. CDC. Case definitions for public health surveillance. MMWR 1990;39(No. RR-13). CDC. Mandatory reporting of infectious diseases by clinicians, and mandatory reporting of occupational diseases by clinicians. MMWR 1990;39(No. RR-9). CDC. National electronic telecommunications system for surveillance -- United States, 1990-1991. MMWR 1991;40:502. CDC. Update: graphic method for presentation of notifiable disease data -- United States, 1991. MMWR 1991;40:124-5. CDC. Use of race and ethnicity in public health surveillance. MMWR 1993;42(No. RR-10). CDC. Update: changes in notifiable disease surveillance data -- United States, 1992-1993. MMWR 42(42):824-6. CDC. Sexually transmitted disease surveillance, 1993. Atlanta: US Department of Health and Human Services, Public Health Service, 1994. Stroup DF, Wharton M, Kafadar K, Dean AG. An evaluation of a method for detecting aberrations in public health surveillance data. Am J Epidemiol 1993;137(3):373-80. Teutsch SM, Churchill RE, eds. Principles and practice of public health surveillance. New York: Oxford University Press, 1994. Thacker SB, Choi K, Brachman PS. The surveillance of infectious diseases. JAMA 1983; 249:1181-5. AIDS CDC. AIDS among racial/ethnic minorities -- United States, 1993. MMWR 1994;43(35):644-7, 653-5. CDC. Heterosexually acquired AIDS -- United States, 1993. MMWR 1994;43(9):155-60. CDC. HIV/AIDS surveillance report. Atlanta: US Department of Health and Human Services, 1994;6(2):1-39. CDC. Recommendations of the U.S. Public Health Service Task Force on the use of zidovudine to reduce perinatal transmission of human immunodeficiency virus. MMWR 1994;43(No. RR-11):1-20. CDC. Update: acquired immunodeficiency syndrome -- United States, 1994. MMWR 1995;44(4):64-7. CDC. Update: trends in AIDS diagnosis and reporting under the expanded surveillance definition for adolescents and adults -- United States, 1993. MMWR 1994;43(45):826-31. CDC. Update: AIDS among women -- United States, 1994. MMWR 1995;44(5):81-4. Amebiasis Katzenstein DA. Drug treatment of amebiasis. In: Peterson PK, Verhoef J, eds. Antimicrobial agents annual 2. New York: Elsevier Science Publishers, 1987:247-52. McAuley JB, Herwaldt BL, Stokes SL, et al. Diloxanide furoate for treating asymptomatic Entamoeba histolytica cyst passers: 14 years' experience in the United States. Clin Infect Dis 1992;15:464-8. Ravdin JI, ed. Amebiasis: human infection by Entamoeba histolytica. New York: John Wiley and Sons, Inc., 1988. Ravdin JI. Amebiasis. Clin Infect Dis 1995;20:1453-66. Anthrax Brachman PS. Anthrax. In: Hoeprich PD, Jordan MC, Roland AR, eds. Infectious diseases. 5th ed. Philadelphia: JB Lippincott Co., 1994:1003-8. Meselson M, Guillemin J, Hugh-Jones M, et al. The Sverdlovsk anthrax outbreak of 1979. Science 1994 Nov;266(5188):1202-8. Arboviral Infections ( California serogroup viruses, Eastern equine encephalitis, St. Louis encephalitis, and Western equine encephalitis ) Monath TP, ed. The arboviruses: epidemiology and ecology. Boca Raton, FL: CRC Press, 1983. Tsai TF. Arboviral infections in the United States. Infect Dis Clin North Am 1991;5:73-102. Tsai TF. Arboviruses and related zoonotic viruses. In: Oski FJ, ed. Principles and practice of pediatrics. 2nd ed. Philadelphia: JB Lippincott Co., 1994:1266-88. Aseptic Meningitis CDC. Aseptic meningitis -- New York State and United States, weeks 1-36, 1991. MMWR 1991; 40(45):773-5. Moore M. Enteroviral disease in the United States, 1970-1979. J Infect Dis 1982;146:103-8. Morens DM, Zweighaft RM, Bryan JA. Nonpolio enterovirus disease in the United States, 1971-1975. Int J Epidemiol 1979;8:49-54. Wilfert CM, Lehrman SN, Katz SL. Enteroviruses and meningitis. Pediatr Infect Dis J 1983;2:333-41. Botulism St. Louis ME, Peck SHS, Bowering D, et al. Botulism from chopped garlic: delayed recognition of a major outbreak. Ann Intern Med 1988;108:363-8. Webber JT, Hatheway CL, St. Louis ME. Botulism. In: Hoeprich PD, Jordan MC, Ronald AR. Infectious diseases: a treatise of infectious processes. 5th ed. Philadelphia: JB Lippincott Co., 1994:1185-94. Woodruff BA, Griffin PM, McCroskey LM, et al. Clinical and laboratory comparison of botulism from toxin types A, B, and E in the United States 1975-1988. J Infect Dis 1992;166:1281-6. Brucellosis CDC. Brucellosis outbreak at a pork processing plant -- North Carolina, 1992. MMWR 1994; 43(7):113-6. Chomel BB, DeBess EE, Mangiamele DM, et al. Changing trends in the epidemiology of human brucellosis in California from 1973 to 1992: a shift toward foodborne transmission. J Infect Dis 1994 Nov;170(5):1216-23. Kaufmann AF, Fox MD, Boyce JM, et al. Airborne spread of brucellosis. Ann NY Acad Sci 1980;353:105-14. Kaufman AF, Wenger JD. Brucellosis. In: Last JM, Wallace RB, eds. Public health and preventive medicine. Norwalk, CT: Appleton and Lange, 1992:263-4. Staskiewicz J, Lewis CM, Colville J, Zervos M, Band J. Outbreak of Brucella melitensis among microbiology laboratory workers in a community hospital. J Clin Microbiol 1991;29:287-90. Chancroid CDC. Chancroid in the United States, 1981-1990: evidence for underreporting of cases. MMWR 1992;41(No. SS-3):57-61. Schmid GP. Chancroid. In: Evans AS, Brachman PS, eds. Bacterial infections of humans: epidemiology and control. 2nd ed. New York: Plenum Medical Book Company, 1991;173-8. Schmid GP. Chancroid and Granuloma inguinale. In: Kelley WB, ed. Textbook of internal medicine. 2nd ed. Philadelphia: JB Lippincott Co., 1991:1412-4. Cholera Blake PA. Epidemiology of cholera in the Americas. Gastroenterol Clin North Am 1993;22:639-60. Swerdlow DL, Ries AA. Vibrio cholerae non-01 -- the eighth pandemic? Lancet 1993;342:382-3. Wachsmuth IK, Blake PA, Olsvik O, eds. Vibrio cholerae and cholera: molecular to global perspectives. Washington, DC: American Society for Microbiology, 1994. World Health Organization. Guidelines for cholera control. Geneva: World Health Organization, 1993. Congenital Syphilis CDC. Surveillance for geographic and secular trends in congenital syphilis -- United States, 1983-1991. MMWR 1993;42(No. SS-6):59-71. CDC. Evaluation of congenital syphilis surveillance system -- New Jersey, 1993. MMWR 1995; 44:225-7. Zenker PN. Syphilis. In: Schdlower M, Shafer M-A, eds. Adolescent medicine: state of the art reviews. Philadelphia: Hanley and Belfus, Inc., 1990;1:511-29. Zenker PN, Berman SM. Congenital syphilis: trends and recommendations for evaluation and management. Pediatr Infect Dis J 1991;10(7):516-22. Diphtheria CDC. Diphtheria acquired by U.S. citizens in the Russian Federation and Ukraine -- 1994. MMWR 1995;44:237,243-4. CDC. Diphtheria epidemic -- New Independent States of the Former Soviet Union, 1990-1994. MMWR 1995;44:177-81. Chen RT, Broome CV, Weinstein RA, Weaver R, Tsai TF. Diphtheria in the United States, 1971-81. Am J Public Health 1985;75:1393-7. Farizo KM, Strebel PM, Chen RT, Kimbler A, Cleary TJ, Cochi SL. Fatal respiratory disease due to Corynebacterium diphtheriae: case report and review of guidelines for management, investigation, and control. Clin Infect Dis 1993;16:59-68. Escherichia coli O157:H7 Bell BP, Goldoft M, Griffin M,et al. A multistate outbreak of Escherichia coli O157:H7 -- associated bloody diarrhea and hemolytic uremic syndrome from hamburgers. The Washington experience. JAMA 1994;272:1349-53. Besser RE, Lett SM, Webber JT,et al. An outbreak of diarrhea and hemolytic uremic syndrome from Escherichia coli O157:H7 in fresh-pressed apple cider. JAMA 1993;269:2217-20. Griffin PM. Escherichia coli O157:H7 and other enterohemorrhagic Escherichia coli. In: Blaser MJ, Smith PD, Ravdin JI, Greenberg HB, Guerrant RL, eds. Infections of the gastrointestinal tract. New York: Raven Press, 1995:739-61. Griffin PM, Tauxe RV. The epidemiology of infections caused by Escherichia coli O157:H7, other enterohemorrhagic E. Coli, and the associated hemolytic uremic syndrome. Epidemiol Rev 1991;13:60-98. Gonorrhea CDC. Special focus: surveillance for sexually transmitted diseases. MMWR 1993;42(No. SS-3):1-11, 29-39. CDC. Decreased susceptibility of Neisseria gonorrhoeae to fluoroquinolones -- Ohio and Hawaii, 1992-1994. MMWR 1994;43:325-7. CDC. Increasing incidence of gonorrhea -- Minnesota, 1994. MMWR 1995;44:282-6. Granuloma inguinale Schmid GP. Chancroid and Granuloma inguinale. In: Kelley WB, ed. Textbook of internal medicine. 2nd ed. Philadelphia: JB Lippincott Co., 1989:1555-6. Haemophilus influenzae, invasive CDC. Recommendations for use of Haemophilus b conjugate vaccines and a combined diphtheria, tetanus, pertussis, and Haemophilus b vaccine: recommendations of the Advisory Committee on Immunization Practices (ACIP). MMWR 1993;42(No. RR-13). Adams WG, Deaver KA, Cochi SL, et al. Decline of childhood Haemophilus influenzae type b (Hib) disease in the Hib vaccine era. JAMA 1993;269:221-6. CDC. Progress toward elimination of Haemophilus influenzae type b disease among infants and children -- United States, 1987-1993. MMWR 1994;43(8):144-8. Hansen disease (Leprosy) Mastro TD, Redd SC, Breiman RF. Imported leprosy in the United States, 1978 through 1988; an epidemic without secondary transmission. Am J Public Health 1992 Aug;82(8):1127-30. Noordeen SK. Epidemiology and control of leprosy -- a review of progress over the last 30 years. Trans R Soc Trop Med Hyg 1993 Sep-Oct;87(5):515-7. Smith PG. Recent trends in the epidemiology of tuberculosis and leprosy. Trop Geogr Med 1991 Jul;43(3):S22-9. Hepatitis Alter MJ, Mares A, Hadler SC, Maynard JE. The effect of underreporting on the apparent incidence and epidemiology of acute viral hepatitis. Am J Epidemiol 1987;125:133-9. CDC. Hepatitis surveillance report no. 55. Atlanta: US Department of Health and Human Services, Public Health Service, 1994. Hepatitis A Shapiro CN, Coleman PJ, McQuillan GM, et al. Epidemiology of hepatitis A: seroepidemiology and risk groups in the U.S.A. Vaccine 1992;10(suppl 1):S59-62. Hepatitis B Margolis HS, Alter MJ, Hadler SC. Hepatitis B: evolving epidemiology and implications for control. Semin Liver Dis 1991;11:84-92. Hepatitis, C/Non-A, non-B Alter MJ, Hadler SC, Judson FN, et al. Risk factors for acute non-A, non-B hepatitis in the United States and association with hepatitis C virus infection. JAMA 1990;264:2231-5. Alter MJ, Margolis HS, Krawczynski K, et al. The natural history of community-acquired hepatitis C in the United States. N Engl J Med 1992;327:1899-905. Legionellosis CDC. Legionnaires' disease associated with cooling towers -- Massachusetts, Michigan, and Rhode Island, 1993. MMWR 1994;43(27):491-9. Edelstein PH. Legionnaires' disease. Clin Infect Dis 1993;16:741-9. Hoge CW, Breiman RF. Advances in the epidemiology and control of Legionella infections. Epidemiol Rev 1991;13:329-40. Marston BJ, Lipman HB, Breiman RF. Surveillance for Legionnaires' disease: risk factors for morbidity and mortality. Arch Intern Med 1994;154:2417-22. World Health Organization. Epidemiology, prevention and control of legionellosis: memorandum from a WHO meeting. Bull World Health Organ 1990;68:155-64. Leptospirosis Anderson DC, Folland DS, Fox MD, Patton CM, Kaufmann AF. Leptospirosis: a common-source outbreak due to leptospires of the Grippotyphosa serogroup. Am J Epidemiol 1978;107:538-44. Faine S. Guidelines for the control of leptospirosis. Geneva, Switzerland: World Health Organization, 1982. Takafuji ET, Kirkpatrick JW, Miller RN, et al. An efficacy trial of doxycycline chemoprophylaxis against leptospirosis. N Engl J Med 1984;310:497-500. Lyme disease CDC. Lyme disease surveillance -- United States, 1993. MMWR 1994;43(31):564-5,571-2. Kalish R. Lyme disease. Rheum Dis Clin North Am 1993;19:399-426. Steere AC. Lyme disease. N Engl J Med 1989;321:586-96. Lymphogranuloma venereum Perine PL, Osoba AO. Lymphogranuloma venereum. In: Holmes KK, Mardh PA, Sparling PF, et al. eds. Sexually transmitted disease. New York: McGraw-Hill, 1990:195-204. Malaria CDC. Health information for international travel 1994. Atlanta: CDC, 1994: US Department of Health and Human Services, Public Health Service, CDC. DHHS publication no. (CDC) 94-8280. CDC. Local transmission of Plasmodium vivax malaria -- Houston, Texas, 1994, MMWR 1994; 44(15):295. Lobel HO, Miani M, Eng T, Bernard KW, Hightower AW, Campbell CC. Long-term malaria prophylaxis with weekly mefloquine. Lancet 1993;341:848-51. Zucker JR, Campbell CC. Malaria: principles of prevention and treatment. Infect Dis Clin North Am 1993;7:547-67. Measles CDC. Measles prevention: recommendations of the Immunization Practices Advisory Committee. MMWR 1989;38(No. SS-9):1-18. CDC. Measles -- United States, first 26 weeks, 1993. MMWR 1993;42:813-6. CDC. Absence of reported measles -- United States, November 1993. MMWR 1993;42:925-6. Meningococcal disease CDC. Meningococcal vaccines. MMWR 1985;34(18):255-9. CDC. Laboratory-based surveillance for meningococcal disease in selected areas -- United States, 1989-1991. MMWR 1993;42(No. SS-2):21-30. Jackson LA, Schuchat A, Reeves MW, Wenger JD. Serogroup C meningococcal outbreaks in the United States: an emerging threat. JAMA 1995;273(5):383-9. Schwartz B, Moore PS, Broome CV. Global epidemiology of meningococcal disease. Clin Microbiol Rev 1989;2(suppl):S118-24. Mumps Briss PA, Fehrs LJ, Parker RA, et al. Sustained transmission of mumps in a highly vaccinated population: assessment of primary vaccine failure and waning vaccine-induced immunity. J Infect Dis 1994;169:77-82. CDC. Mumps prevention. MMWR 1989;38(22):388-92,397-400. CDC. Mumps -- United States, 1985-1988. MMWR 1989;38(7):101-5. CDC. Mumps Surveillance -- United States, 1988-1993. MMWR 1995;44(No. SS-3):1-14. Hersch BS, Fine PEM, Kent WK, et al. Mumps outbreak in a highly vaccinated population. J Pediatr 1991;119:187-93. Pertussis CDC. Pertussis surveillance -- United States, 1989-1991. MMWR 1992;41(No. SS-8):11-19. Cherry JD, Brunell PA, Golden GS, et al. Report of the Task Force on Pertussis and Pertussis Immunization, 1988. Pediatrics 1988;81(suppl):S939-84. Davis SF, Sutter RW, Strebel PM, et al. Concurrent outbreaks of pertussis and Mycoplasma pneumoniae infection: clinical and epidemiological characteristics of illnesses manifested by cough. Clin Infect Dis 1995;20(3):621-8. Plague Craven RB, Barnes AM. Plague and tularemia. Infect Dis Clin North Am 1991;5:165-75. Poland JD. Plague. In: Hoeprich PD, ed. Infectious Diseases. 2nd ed. New York: Harper and Row, 1989:151;1296-306. Poliomyelitis CDC. Lack of evidence for wild poliovirus circulation -- United States, 1993. MMWR 1993;43:957-9. Prevots DR, Sutter RW, Strebel PM, Weibel RE, Cochi SL. Completeness of reporting for paralytic poliomyelitis, United States, 1980 through 1991. Archives of Pediatrics and Adolescent Medicine 1994;148:479-85. Strebel PM, Sutter RW, Cochi SL, et al. Epidemiology of poliomyelitis in the United States: one decade after the last reported case of indigenous wild virus-associated disease. Clin Infect Dis 1992;14:568-79. Psittacosis Anonymous. Compendium of chlamydiosis (psitticosis) control, 1994. National Association of State Public Health Veterinarians, Inc. JAVMA 1993;203:1673-80. Barnes RC. Laboratory diagnosis of human chlamydial infections. Clin Microbiol Rev 1989; 2:119-36. Kuritsky JN, Schmid GP, Potter ME, Anderson DC, Kaufmann AF. Psittacosis: a diagnostic challenge. J Occup Med 1984;26:731-3. Wong KH, Skelton SK, Daugharty H. Utility of complement fixation and microimmunofluorescence assays for detecting serologic responses in patients with clinically diagnosed psittacosis. J Clin Microbiol 1994;32:2417-21. Rabies CDC. Rabies prevention -- United States, 1991: recommendations of the Immunization Practices Advisory Committee (ACIP). MMWR 1991;40(No. RR-3). Baer G. Natural history of rabies. 2nd ed. Boca Raton, FL: CRC press, 1991. CDC. Compendium of animal rabies control, 1995. MMWR 1995;44(No. RR-2). Krebs JW, Strine TW, Smith JS, Rupprecht CE, Childs JE. Rabies surveillance in the United States during 1993. JAVMA 1993;205:1695-1709. Rheumatic fever Dajani AS. Prevention of rheumatic fever: a statement for health professionals by the Committee on Rheumatic Fever, Endocarditis, and Kawasaki Disease of the Council on Cardiovascular Disease in the Young, the American Heart Association. Pediatr Infect Dis J 1989;8:263-6. Kaplan EL, Johnson DR, Cleary PP. Group A streptococcal serotypes isolated from patients and sibling contacts during the resurgence of rheumatic fever in the United States in the mid-1980's. J Infect Dis 1989;1259:101-3. Veasy GL, Wiedmeier SE, Orsmond GS, et al. Resurgence of acute rheumatic fever in the intermountain area in the United States. N Engl J Med 1987;316:421-8. Rocky Mountain spotted fever (RMSF) Burgdorfer W, Anacker FL, eds. Rickettsiae and rickettsial diseases. New York: Academic Press, 1981. Dalton MJ, Clarke MJ, Holman RC, et al. National surveillance for Rocky Mountain spotted fever, 1981-1992, epidemiologic summary and evaluation of risk factors for fatal outcome. Am J Trop Med Hyg 1995;52(5):405-13. McDade JE, Fishbein DB. Rickettsiaceae: the rickettsiae. In: Laboratory diagnosis of infectious diseases: principles and practice. Vol II. Viral, rickettsial, and chlamydial diseases. New York: Springer-Verlag, 1988:864-89. Rubella CDC. Rubella prevention: recommendations of the Immunization Practices Advisory Committee (ACIP). MMWR 1990;39(No. RR-15). CDC. Increase in rubella and congenital rubella syndrome -- United States, 1988-1990. MMWR 1991;40(6):93-9. CDC. Outbreaks of rubella among the Amish -- United States, 1991. MMWR 1991;40(16):264. CDC. Congenital rubella syndrome among the Amish -- Pennsylvania, 1991-1992. MMWR 1992; 41(26):468-9,475-6. CDC. Rubella and congenital rubella syndrome -- United States, January 1, 1991-May 7, 1994. MMWR 1994;43(21):391,397-401. Lindegren ML, Fehrs LJ, Hadler SC, Hinman AR. Update: rubella and congenital rubella syndrome, 1980-1990. Epidemiol Rev 1991;13:341-8. Salmonellosis Lee LA, Puhr ND, Maloney EK, Bean NH, Tauxe RV. Increase in antimicrobial-resistant Salmonella infections in the United States, 1989-1990. J Infect Dis 1994;170:128-34. Mishu B, Griffin PM, Tauxe RV, Cameron DN, Hutcheson RH, Schaffner W. Salmonella enteritidis gastroenteritis transmitted by intact chicken eggs. Ann Intern Med 1991;115:190-4. Mishu B, Koehler J, Lee LA, et al. Outbreaks of Salmonella enteritidis infections in the United States, 1985-1991. J Infect Dis 1994;169:547-52. St. Louis ME, Morse DL, Potter ME, et al. The emergence of grade A eggs as a major source of Salmonella enteritidis infections: new implications for the control of salmonellosis. JAMA 1988;259:2103-7. Tauxe RV. Salmonella: a postmodern pathogen. Journal of Food Protection 1991;54:563-8. Shigellosis Lee LA, Shapiro CN, Hargrett-Bean N, Tauxe RV. Hyperendemic shigellosis in the United States: a review of surveillance data for 1967-1988. J Infect Dis 1991;164:894-900. Parsonnet J, Greene KD, Gerber AR, et al. Shigella dysenteriae type 1 infections in U.S. travellers to Mexico. Lancet 1989:543-5. Ries AA, Wells JG, Olivola D, et al. Epidemic Shigella dysenteriae type 1 in Burundi: panresistance and implications for prevention. J Infect Dis 1994;169:1035-41. Syphilis Aral SO, Wasserheit JN, Green SB, Judson FN, Sparling FP. The NIAID/NIH working group on integrated behavioral research for prevention and control of STDs. Part III: Issues in evaluating behavioral interventions. Sex Transm Dis 1990;17:208-10. CDC. Primary and secondary syphilis -- United States, 1981-1990. MMWR 1991;40(19):314-5, 321-3. CDC. Regional and temporal trends in the surveillance of syphilis, United States, 1986-1990. MMWR 1991;40(No. SS-3):29-33. CDC. Special focus: surveillance for sexually transmitted diseases. MMWR 1993;42(No. SS-3):13-9. Nakashima AK, Rolfs RT, Flock ML, Kilmarx P, Greenspan GR. Epidemiology of syphilis in the United States, 1941-1993. Sex Transm Dis 1995 (in press). Tetanus CDC. Surveillance of tetanus -- United States, 1989-1990. MMWR 1992;41(No. SS-8):1-9. Gergen PJ, McQuillan GM, Kiely M, et al. A population-based survey of immunity to tetanus in the United States. N Engl J Med 1995;332:761-6. Sutter RW, Cochi SL, Brink EW, Sirotkin BI. Assessment of vital statistics and surveillance data for monitoring tetanus mortality, United States, 1979-1984. Am J Epidemiol 1990;131:132-42. Toxic-shock syndrome CDC. Reduced incidence of menstrual toxic shock syndrome -- United States, 1980-1990. MMWR 1990;39(25):421-3. Gaventa S, Reingold AL, Hightower AW, et al. Active surveillance for toxic shock syndrome in the United States, 1986. Rev Infect Dis 1989;(suppl):S28-34. Schuchat A, Broome CV. Toxic shock syndrome and tampons. Epidemiol Rev 1991;13:99-112. Trichinosis Bailey TM, Schantz PM. Trends in the incidence and transmission patterns of human trichinosis in the United States, 1982-1986. Rev Infect Dis 1990;12:5-11. Campbell WC, ed. Trichinella and trichinosis. New York: Plenum Press, 1983. CDC. Trichinosis surveillance -- United States, 1987-1990. MMWR 1991;40(No. SS-3):35-42. McAuley JB, Michelson MK, Hightower AW, Engeran S, Wintermeyer LA, Schantz PM. A trichinosis outbreak among Southeast Asian refugees. Am J Epidemiol 1992;135:1404-10. Tuberculosis American Thoracic Society/CDC. Treatment of tuberculosis and tuberculosis infection in adults and children. Am J Respir Crit Care Med 1994;149:1359-74. CDC. Recommendations for counting reported tuberculosis cases. Atlanta: US Department of Health and Human Services, Public Health Service, 1977. CDC. Tuberculosis morbidity -- United States, 1994. MMWR 1995;44:(20)387-95. Tularemia Evans ME, Gregory DW, Schaffner W, McGee ZA. Tularemia: a 30 year experience with 88 cases. Medicine 1985;64:251-69. Schmid GP, Kornblatt AN, Connors CA, et al. Clinically mild tularemia associated with tick-borne Francisella tularensis. J Infect Dis 1983;148:63-7. Taylor JP, Istre GR, McChesny TC, Satalowich FT, Parker RE, McFarland LM. Epidemiologic characteristics of human tularemia in the southwest-central states, 1981-1987. Am J Epidemiol 1991;133:1032-8. Typhoid fever CDC. Typhoid immunization: recommendations of the Advisory Committee on Immunization Practices. MMWR 1994;43(No. RR-14). Ryan CA, Hargrett-Bean NT, Blake PA. Salmonella typhi infections in the United States, 1975-1984: increasing role of foreign travel. Rev Infect Dis 1989;11(1):1-8. Woodruff BA, Pavia AT, Blake PA. A new look at typhoid vaccination: information for the practicing physician. JAMA 1991;265(6):756-9. Varicella CDC. Varicella outbreak in a women's prison -- Kentucky. MMWR 1989;38(37):635-6,641-2. Gershon AA, LaRussa P, Hardy I, Steinberg S, Silverstein S. Varicella vaccine: the American experience. J Infect Dis 1992;166(suppl 1):S63-8. Lieu TA, Cochi SL, Black SB, et al. Cost-effectiveness of a routine varicella vaccination program for U.S. children. JAMA 1994;271:375-81. Varicella Vaccine. Medical Letter 1995;37(950):55-7. PART 1: Summaries of Notifiable Diseases in the United States Table_1 NOTIFIABLE DISEASES -- Summary of reported cases, by month, United States, 1994 Table_2A NOTIFIABLE DISEASES -- Reported cases, by geographic division and area, United States, 1994 Table_2B NOTIFIABLE DISEASES -- Reported cases, by geographic division and area, United States, 1994 (continued) Table_2C NOTIFIABLE DISEASES -- Reported cases, by geographic division and area, United States, 1994 (continued) Table_2D NOTIFIABLE DISEASES -- Reported cases, by geographic division and area, United States, 1994 (continued) Table_2E NOTIFIABLE DISEASES -- Reported cases, by geographic division and area, United States, 1994 (continued) Table_2F NOTIFIABLE DISEASES -- Reported cases, by geographic division and area, United States, 1994 (continued) Table_3 NOTIFIABLE DISEASES -- Summary of reported cases, by age group, United States, 1994 Table_4 NOTIFIABLE DISEASES -- Summary of reported cases, by age group, United States, 1994 Table_5 NOTIFIABLE DISEASES -- Summary of reported cases, by race, United States, 1994 Table_6 NOTIFIABLE DISEASES -- Summary of reported cases, by ethnicity, United States, 1994 PART 2: Graphs and Maps for Selected Notifiable Diseases in the United States Figure_1 ACQUIRED IMMUNODEFICIENCY SYNDROME (AIDS) -- reported cases, by quarter, and definition category, United States, 1984-1994 Figure_2 ACQUIRED IMMUNODEFICIENCY SYNDROME (AIDS) -- reported cases, per 100,000 population, United States and Puerto Rico, 1994 Figure_3 ACQUIRED IMMUNODEFICIENCY SYNDROME (AIDS) -- reported pediatric cases, United States and Puerto Rico, 1994 Figure_4 ARBOVIRAL INFECTIONS (of the central nervous system) -- reported laboratory-confirmed cases caused by California serogroup viruses, by month of onset, United States, 1985-1994 Figure_5 ARBOVIRAL INFECTIONS (of the central nervous system) -- reported laboratory-confirmed cases caused by eastern equine encephalitis virus, by month of onset, United States, 1985-1994 Figure_6 ARBOVIRAL INFECTIONS (of the central nervous system) -- reported laboratory-confirmed cases caused by St. Louis encephalitis virus, by month of onset, United States, 1985-1994 Figure_7 ARBOVIRAL INFECTIONS (of the central nervous system) -- reported laboratory-confirmed cases caused by western equine encephalitis virus, by month of onset, United States, 1985-1994 Figure_8A BOTULISM (foodborne) -- by year, United States, 1975-1994 Figure_8B BOTULISM (foodborne) -- by year, United States, 1975-1994 (continued) Figure_9 BRUCELLOSIS -- by year, United States, 1965-1994 Figure_10 CHOLERA -- reported cases, United States and territories, 1994 Figure_11 DIPTHERIA -- by year, United States, 1965-1994 Figure_12 ESCHERICHIA COLI O157:H7 -- reported cases, United States and territories, 1994 Figure_13 ESCHERICHIA COLI O157:H7 -- reported isolates, United States, 1994 Figure_14 GONORRHEA -- by sex, United States, 1981-1994 Figure_15 GONORRHEA -- by race, United States, 1981-1994 Figure_16 GONORRHEA -- reported cases, per 100,000 population, United States, 1994 Figure_17 HAEMOPHILUS INFLUENZAE, INVASIVE -- by age group, United States, 1994 Figure_18 HANSEN DISEASE (leprosy) -- by year, United States, 1965-1994 Figure_19 HEPATITIS -- by year, United States, 1965-1994 Figure_20 HEPATITIS A -- reported cases, per 100,000 population, United States and territories, 1994 Figure_21 HEPATITIS B -- reported cases, per 100,000 population, United States and territories, 1994 Figure_22 LEGIONELLOSIS -- by year, United States, 1978-1994 Figure_23 LYME DISEASE -- reported cases, per 100,000 population, United States and territories, 1994 Figure_24 MALARIA -- by year, United States, 1965-1994 Figure_25 MEASLES (rubeola) -- by year, United States, 1960-1994 Figure_26 MENINGOCOCCAL DISEASE -- by year, United States, 1965-1994 Figure_27 MUMPS -- by year, United States, 1968-1994 Figure_28 PERTUSSIS (whooping cough) -- by year, United States, 1965-1994 Figure_29 PERTUSSIS (whooping cough) -- by age group, United States, 1994 Figure_30 PLAGUE -- among humans, by year, United States, 1965-1994 Figure_31 POLIOMYELETIS (paralytic) -- by year, United States, 1965-1994 Figure_32 PSITTACOSIS -- by year, United States, 1965-1994 Figure_33 RABIES -- wild and domestic animals, by year, United States and Puerto Rico, 1955-1994 Figure_34 ROCKY MOUNTAIN SPOTTED FEVER (RMSF) -- by year, United States, 1965-1994 Figure_35 RUBELLA (German measles) -- by year, United States, 1966-1994 Figure_36 SALMONELLOSIS (excluding typhoid fever) -- by year, United States, 1955-1994 Figure_37 SALMONELLA -- serotype of isolate by year, United States, 1968-1994 Figure_38 SHIGELLOSIS -- by year, United States, 1965-1994 Figure_39 SHIGELLA -- species of isolate by year, United States, 1968-1994 Figure_40 SYPHILIS (primary and secondary) -- reported cases, per 100,000 population, United States, 1994 Figure_41 SYPHILIS (primary and secondary) -- by sex, United States, 1981-1994 Figure_42 SYPHILIS (primary and secondary) -- by race, United States, 1981-1994 Figure_43 CONGENITAL SYPHILIS -- in infants <1 year of age, United States, 1963-1994 Figure_44 TETANUS -- by year, United States, 1965-1994 Figure_45 TOXIC SHOCK SYNDROME (TSS) -- by quarter, United States, 1979-1994 Figure_46 TRICHINOSIS -- by year, United States, 1965-1994 Figure_47 TUBERCULOSIS -- reported cases, per 100,000 population, United States and territories, 1994 Figure_48 TUBERCULOSIS -- by year, United States, 1975-1994 Figure_49 TUBERCULOSIS -- by year, among foreign-born persons and persons born in the United States, 1986-1994 Figure_50 TYPHOID FEVER -- by year, United States, 1965-1994 Figure_51 VARICELLA (chickenpox) -- by month, United States, 1986-1994 PART 3: Historical Summary Tables Table_7 NOTIFIABLE DISEASES -- summary of reported cases, 100,000 population, United States, 1985-1994 Table_8 NOTIFIABLE DISEASES -- summary of reported cases, United States, 1985-1994 Table_9 NOTIFIABLE DISEASES -- summary of reported cases, United States, 1975-1984 Table_10 NOTIFIABLE DISEASES -- summary of reported cases, United States, 1965-1974 Table_11 NOTIFIABLE DISEASES -- summary of reported cases, United States, 1955-1964 Table_12 NOTIFIABLE DISEASES -- summary of reported cases, United States, 1945-1954 Table_13 NOTIFIABLE DISEASES -- deaths from specified notifiable diseases, United States, 1983-1992. (Numbers in ICD column refer to the category numbers listed in the Ninth Revision of the International Classification of Diseases, 1975.) Table_1 Note: To print large tables and graphs users may have to change their printer settings to landscape and use a small font size. NOTIFIABLE DISEASES -- Summary of reported cases, by month, United States, 1994 ======================================================================================================================================================================== NAME Total Jan. Feb. Mar. Apr. May June July Aug. Sept. Oct. Nov. Dec. Unk. ------------------------------------------------------------------------------------------------------------------------------------------------------------------------ AIDS * 78,279 7,058 4,446 8,774 5,954 6,136 7,100 6,305 7,814 7,563 5,800 6,056 5,273 - Amebiasis 2,983 158 167 196 315 215 258 226 281 197 280 202 488 - Anthrax - - - - - - - - - - - - - - Aseptic meningitis 8,932 351 322 423 516 497 690 1,043 1,067 1,030 1,086 7,180 1,189 - Botulism, total 143 13 8 12 7 19 19 11 12 8 15 9 10 - Brucellosis 119 4 3 6 9 8 5 18 11 10 1 9 35 - Chancroid + 773 .......... 198 ............ .......... 204 .......... .......... 182 .......... .......... 189 .......... - Cholera 39 - 2 3 3 1 5 1 3 1 4 8 8 - Diphtheria 2 - - 2 - - - - - - - - - - Encephalitis, primary 717 42 56 43 47 36 43 67 66 86 80 52 99 - infections Post-infectious 143 7 9 12 17 8 13 14 12 10 12 11 18 - Escherichia coli O157:H7 1,420 14 28 23 51 75 88 227 208 150 195 139 222 - Gonorrhea + 418,068 ......... 92,183 ......... ......... 99,347 ........ ........ 111,415 ........ ....... 115,123 ........ - Granuloma inguinale + 3 ........... 1 ............ ........... - ........... ........... 1 ........... .......... 1 ........... - Haemophilus influenzae, 1,174 84 98 91 107 145 72 111 55 69 107 69 166 - invasive Hansen disease 136 11 7 7 17 5 15 18 8 6 15 12 15 - (leprosy) Hepatitis A 26,796 1,235 1,788 1,669 2,250 1,863 1,835 2,597 2,042 2,191 2,820 2,128 4,378 - Hepatitis B 12,517 708 936 959 1,159 906 834 1,093 891 883 1,054 975 2,119 - Hepatitis, C/non-A non-B 4,470 309 276 388 375 296 361 352 297 387 329 318 782 - Hepatitis, unspecified 444 21 30 22 48 34 38 42 33 38 39 32 67 - Legionellosis 1,615 85 112 105 141 100 122 161 175 145 148 120 201 - Leptospirosis 38 6 1 1 5 - - 4 2 6 6 3 4 - Lyme disease 13,043 386 260 377 513 450 831 2,622 1,841 1,528 1,549 1,158 1,528 - Lymphogranuloma 235 ........... 74 .......... ........... 54 .......... ........... 52 .......... ........... 55 .......... - venereum + Malaria 1,229 48 91 99 85 56 71 101 126 104 122 70 256 - Measles (rubeola) 963 6 38 67 241 298 97 71 15 23 19 11 77 - Meningococcal disease 2,886 245 278 274 290 285 198 212 140 124 199 197 444 - Mumps 1,537 71 123 108 153 134 114 126 163 70 141 90 244 - Pertussis (whooping 4,617 257 344 260 274 281 274 362 402 306 603 312 942 - cough) Plague 17 1 - - - 2 6 6 1 - - 1 - - Poliomyelitis, - - - - - - - - - - - - - - paralytic & Psittacosis 38 3 5 4 - 4 4 6 1 2 3 1 5 - Rabies, animal 8,147 474 500 867 759 667 692 628 845 764 759 645 547 - Rabies, human 6 1 - - - - 1 - - - 2 2 - - Rheumatic fever, acute 112 6 3 8 13 6 29 7 5 3 10 6 16 - Rocky Mountain spotted 465 5 6 11 18 20 54 82 84 46 57 28 54 - fever Rubella (German 227 3 31 50 50 12 25 27 4 5 2 2 16 - measles) Rubella, congenital 7 - 2 - - - - - - 1 - 2 2 - syndrome Salmonellosis 43,323 1,560 1,656 1,899 2,799 2,529 3,040 4,776 4,666 4,436 6,057 3,620 6,275 - Shigellosis 29,769 1,293 1,406 1,734 2,319 2,070 2,126 2,969 2,597 2,543 3,190 2,541 4,981 - Syphilis, total all 81,696 ......... 20,981 ........ ......... 21,544 ........ ......... 20,462 ........ ......... 18,709 ........ - stages + Primary and secondary + 20,627 ......... 5,308 ......... ......... 5,154 ......... ......... 5,396 ......... ......... 4,769 ......... - Congenital <1 year + 2,204 .......... 535 .......... .......... 597 .......... .......... 525 .......... .......... 547 .......... - Tetanus 51 1 2 4 4 3 4 3 1 5 8 3 13 - Toxic-shock syndrome 192 13 21 13 28 16 11 10 19 14 13 11 23 - Trichinosis 32 10 3 3 5 - - - 2 - 2 5 2 - Tuberculosis 24,361 567 1,302 1,877 2,138 1,949 2,105 2,063 1,964 2,009 1,860 1,906 4,621 - Tularemia 96 - 1 - 1 7 14 24 10 14 7 - 18 - Typhoid fever 441 17 29 35 51 39 32 44 33 53 43 18 47 - Varicella (chickenpox) 151,219 11,939 14,564 19,132 27,154 22,550 19,723 6,554 2,238 1,994 4,241 7,415 13,715 - ------------------------------------------------------------------------------------------------------------------------------------------------------------------------ & Two suspected cases of paralytic poliomyelitis were reported in 1994. Confirmation of these cases is pending review by external panel. * AIDS total updated through December 31, 1994. + Cases updated through Feburary 28, 1995. ======================================================================================================================================================================== Return to top. Table_2A Note: To print large tables and graphs users may have to change their printer settings to landscape and use a small font size.
NOTIFIABLE DISEASES -- Reported cases, by geographic division and area, United States, 1994
==========================================================================================================================================================
Total Resident Botulism
population (in Aseptic ----------------------
Area thousands) AIDS Ambiasis Anthrax meningitis Foodborne Infant Brucellosis Canchroid
----------------------------------------------------------------------------------------------------------------------------------------------------------
United States 260,341 78,279* 2,983 - 8,932 50 85 119 773+
New England 13,270 2,836 80 - 340 - 1 - 1
Maine 1,240 117 10 - 33 - - - -
N.H. 1,137 92 2 - 47 - - - -
Vt. 580 38 3 - 36 - - - -
Mass. 6,041 1,401 61 - 103 - - - 1
R.I. 997 276 4 - 121 - - - -
Conn. 3,275 912 NN - NN - 1 - -
Mid. Atlantic 38,125 22,465 876 - 957 2 16 2 365
N.Y. (excl. NYC) 10,905 2,220 120 - 466 1 - - 8
N.Y.C. 7,264 12,724 701 - 150 - 1 - 357
N.J. 7,904 4,993 25 - NN - 2 - -
Pa. 12,052 2,528 30 - 341 1 13 2 -
E. N. Central 43,184 6,324 187 - 1,652 2 9 8 48
Ohio 11,102 1,184 22 - 399 1 4 2 8
Ind. 5,752 622 21 - 222 - 2 - -
Ill. 11,752 3,104 45 - 472 1 2 5 38
Mich. 9,496 1,035 42 - 538 - 1 1 -
Wis. 5,082 379 57 - 21 - - - 2
W.N. Central 18,210 1,638 131 - 476 - 2 1 8
Minn. 4,567 422 39 - 43 - - - -
Iowa 2,829 130 21 - 121 - - 1 1
Mo. 5,278 713 38 - 175 - - - 2
N. Dak. 638 20 8 - 14 - - - -
S. Dak. 721 19 4 - 3 - - - -
Nebr. 1,623 89 6 - 41 - - - -
Kans. 2,554 245 15 - 79 - 2 - 5
S. Atlantic 46,398 18,857 203 - 2,000 - 4 17 30
Del. 706 271 3 - 41 - 1 - -
Md. 5,006 2,722 14 - 246 - 1 1 -
D. C. 570 1,399 2 - 53 - - - -
Va. 6,552 1,162 39 - 337 - 2 2 -
W. Va. 1,822 96 6 - 39 - - - -
N.C. 7,070 1,187 19 - 240 - - 3 10
S.C. 3,664 1,158 NN - 31 - - - -
Ga. 7,055 2,245 58 - 80 - - 3 -
Fla. 13,953 8,617 62 - 933 - - 8 20
E.S. Central 15,890 2,099 10 - 582 3 3 2 27
Ky. 3,827 320 6 - 181 - 1 - -
Tenn. 5,175 764 NN - 164 2 1 1 3
Ala. 4,219 582 3 - 174 - - - 24
Miss. 2,669 433 1 - 63 1 1 1 -
W. S. Central 28,404 7,671 124 - 1,072 25 4 32 260
Ark. 2,453 284 4 - 62 - 1 1 -
La. 4,315 1,239 2 - 40 - - 2 209
Okla. 3,258 269 8 - - 1 - - -
Tex. 18,378 5,879 110 - 970 24 3 29 51
Mountain 15,215 2,287 150 - 353 - 8 20 3
Mont. 856 30 - - 8 - 1 - -
Idaho 1,133 61 6 - 6 - 2 - -
Wyo. 476 18 - - 4 - 1 - -
Colo. 3,656 816 39 - 135 - 1 1 -
N. Mex. 1,654 211 27 - 20 - - 1 -
Ariz. 4,075 612 61 - 79 - - 17 3
Utah 1,908 152 6 - 55 - 3 1 -
Nev. 1,457 387 11 - 46 - - - -
Pacific 41,645 13,949 1,222 - 1,500 18 38 37 31
Wash. 5,343 932 78 - NN 3 2 - 1
Oreg. 3,086 606 109 - NN - 3 1 5
Calif. 31,431 12,136 991 - 1,350 4 30 36 25
Alaska 606 59 5 - 19 11 - - -
Hawaii 1,179 216 39 - 131 - 3 - -
Guam 133 1 1 - 13 - - - -
P.R. 3,522 2,359 1 - 72 - - - 32
V.I. 102 52 - - - - - - 1
C.N.M.I. 43 - - - - - - - -
American Samoa 47 - - - - - - - -
----------------------------------------------------------------------------------------------------------------------------------------------------------
* Total reported to Division of HIV/AIDS Prevention, National Center for
Prevention Services, through December 31, 1994. Total includes 153 cases
with unknown state of residence.
+ Cases updated through Division of Sexually Transmitted Diseases and HIV
Prevention, National Center for Prevention Services, as of February 28, 1995.
==========================================================================================================================================================
Return to top. Table_2B Note: To print large tables and graphs users may have to change their printer settings to landscape and use a small font size.
NOTIFIABLE DISEASES -- Reported cases, by geographic division and area, United States, 1994 (continued)
===================================================================================================================================================
Encephalitis
-------------------------- Haemophilus Hansen
Primary Post- Escherichia Granuloma influenzae, disease
Area Cholera Diptheria Infections infections coli O157:H7 Gonorrhea inguinale invasive (leprosy)
---------------------------------------------------------------------------------------------------------------------------------------------------
United States 39 2 717 143 1,420 418,068 * 3 * 1,174 136
New England 2 1 18 6 223 8,640 - 45 4
Maine - - 5 - NN 93 - 5 -
N. H. - - - 2 NN 103 - 4 -
Vt. - - 3 1 12 40 - - -
Mass. 1 1 8 1 134 3,159 - 21 4
R.I. - - 2 2 9 478 - 4 -
Conn. 1 - - - 68 4,767 - 11 -
Mid. Atlantic 6 - 63 20 160 49,450 - 149 16
N.Y. (excl. NYC) 3 - 38 3 149 11,506 - 70 2
N.Y.C. 1 - 6 5 11 19,491 - 34 13
N.J. 2 - - - - 5,269 - 16 1
Pa. - - 19 12 NN 13,184 - 29 -
E. N. Central 5 - 169 22 269 87,065 - 199 9
Ohio - - 55 4 109 24,746 - 109 -
Ind. - - 11 1 57 9,757 - 26 -
Ill. 2 - 65 5 103 26,571 - 43 6
Mich. 3 - 38 12 - 18,215 - 19 -
Wis. - - - - NN 7,776 - 2 3
W.N. Central 1 - 52 12 366 22,834 - 103 -
Minn. - - 22 - 147 3,346 - 34 -
Iowa 1 - 1 1 56 1,645 - 9 -
Mo. - - 8 6 40 12,557 - 51 -
N. Dak. - - 4 - 31 35 - - -
S. Dak. - - 4 - 18 243 - 2 -
Nebr. - - 6 5 74 1,335 - 4 -
Kans. - - 7 - NN 3,673 - 3 -
S. Atlantic 3 - 161 65 23 104,591 2 234 2
Del. - - 1 - NN 2,038 - 1 -
Md. 1 - 28 5 NN 15,137 - 87 -
D. C. - - - 1 - 6,827 - - -
Va. 1 - 34 6 NN 13,414 - 22 1
W. Va. - - 51 - NN 805 - 7 -
N. C. - - 44 1 6 28,936 2 32 -
S. C. - - - - 17 13,067 - 3 -
Ga. - - 2 - NN NA - 67 -
Fla. 1 - 1 52 - 24,367 - 15 1
E.S. Central - - 41 4 6 48,208 - 34 1
Ky. - - 16 2 6 5,127 - 4 1
Tenn. - - 12 - NN 15,745 - 10 -
Ala. - - 9 1 - 15,881 - 15 -
Miss. - - 4 1 - 11,455 - 5 -
W. S. Central 4 - 63 2 98 53,529 - 74 33
Ark. - - 1 - 10 6,892 - 5 2
La. - - 10 - - 11,992 - 4 -
Okla. - - - - 16 4,888 - 45 -
Tex. 4 - 52 2 72 29,757 - 20 31
Mountain - - 14 3 100 10,669 - 128 -
Mont. - - - - - 85 - 1 -
Idaho - - - - - 98 - 5 -
Wyo. - - 3 1 NN 82 - 5 -
Colo. - - 4 - 76 3,632 - 17 -
N. Mex. - - - - - 1,130 - 12 -
Ariz. - - - 1 NN 3,603 - 26 -
Utah - - 3 1 NN 303 - 10 -
Nev. - - 4 - 24 1,736 - 52 -
Pacific 18 1 136 9 175 33,082 1 208 71
Wash. - - 1 - 174 2,893 - 10 7
Oreg. - - - - 1 978 1 26 -
Calif. 17 1 131 8 NN 27,593 - 165 43
Alaska - - 4 - NN 918 - 3 -
Hawaii 1 - - 1 NN 700 - 4 21
Guam 1 - - 1 NN 110 - - 11
P. R. - - 1 3 NN 500 - 3 1
V.I. - - - - - 60 - - -
C.N.M.I. - - - - - - - 26 -
American Samoa - - - - - - - - 4
---------------------------------------------------------------------------------------------------------------------------------------------------
* Cases updated through Division of Sexually Transmitted Diseases and HIV Prevention, National Center for Prevention
Services, as of February 28, 1995.
===================================================================================================================================================
Return to top. Table_2C Note: To print large tables and graphs users may have to change their printer settings to landscape and use a small font size.
NOTIFIABLE DISEASES -- Reported cases, by geographic division and area, United States, 1994 (continued)
============================================================================================================================================
Lympho
Hepatitis Hepatitis granuloma
Area Hepatitis A Hepatitis B C/non-A, non-B unsp. Legionellosis Leptospirosis Lyme disease venereum
--------------------------------------------------------------------------------------------------------------------------------------------
United States 26,796 12,517 4,470 444 1,615 38 13,043 235*
New England 296 354 168 15 79 3 2,827 6
Maine 25 11 - - 5 2 33 -
N. H. 17 28 11 - - - 30 -
Vt. 14 12 16 - 1 - 16 -
Mass. 112 200 121 13 55 - 247 6
R.I. 30 8 20 2 18 - 471 -
Conn. 98 95 - - NN 1 2,030 -
Mid. Atlantic 2,007 1,761 489 10 264 2 8,171 108
N.Y. (excl. NYC) 543 402 230 6 62 1 5,105 2
N.Y.C. 941 543 4 - 11 - 95 106
N.J. 306 410 211 - 49 1 1,533 -
Pa. 217 406 44 4 142 - 1,438 -
E. N. Central 2,777 1,221 320 16 433 1 530 9
Ohio 1,203 164 24 - 194 - 45 9
Ind. 361 215 9 - 48 - 19 -
Ill. 615 315 81 9 44 1 24 -
Mich. 352 432 206 7 82 - 33 -
Wis. 246 95 - - 65 - 409 -
W. N. Central 1,222 714 100 12 106 2 347 2
Minn. 261 82 20 - 4 - 208 -
Iowa 4 27 14 11 34 - 17 -
Mo. 619 538 32 1 41 1 102 2
N. Dak. 6 1 1 - 4 - - -
S. Dak. 39 4 - - 2 - - -
Nebr. 122 31 15 - 15 1 3 -
Kans. 111 31 18 - 6 - 17 -
S. Atlantic 1,466 2,240 485 32 413 3 855 65
Del. 22 14 2 - 31 - 106 -
Md. 198 354 21 8 82 1 341 -
D. C. 27 53 2 - 9 - 9 15
Va. 193 142 26 10 17 - 131 -
W. Va. 23 48 47 - 4 - 29 -
N. C. 145 291 59 - 28 1 77 44
S.C. 40 33 10 - 29 - 7 -
Ga. 43 555 220 - 118 - 127 3
Fla. 775 750 98 14 95 1 28 3
E.S. Central 784 1,211 945 2 83 3 43 2
Ky. 221 78 32 - 9 1 24 -
Tenn. 347 1,042 893 1 45 2 13 1
Ala. 139 91 20 1 13 - 6 1
Miss. 77 - - - 16 - - -
W.S. Central 3,719 1,830 599 94 63 1 174 12
Ark. 253 60 8 3 16 1 15 -
La. 170 203 215 2 20 - 4 12
Okla. 419 141 62 3 12 - 99 -
Tex. 2,877 1,426 314 86 15 - 56 -
Mountain 5,296 694 454 73 97 - 18 7
Mont. 25 21 13 - 16 - - -
Idaho 380 77 71 1 2 - 3 -
Wyo. 41 24 177 - 5 - 5 -
Colo. 584 97 79 14 19 - 1 1
N. Mex. 1,100 218 45 11 4 - 5 -
Ariz. 2,159 102 31 27 17 - - 5
Utah 754 96 18 6 8 - 3 -
Nev. 253 59 20 14 26 - 1 1
Pacific 9,229 2,492 910 190 77 23 78 24
Wash. 1,119 255 294 9 13 - 4 3
Oreg. 1,241 158 46 2 - 1 6 2
Calif. 6,602 2,038 565 176 59 - 68 19
Alaska 209 13 - - - - - -
Hawaii 58 28 5 3 5 22 - -
Guam 23 5 - 9 1 - - -
P.R. 86 415 215 3 - 2 - -
V.I. 3 9 1 - - - - -
C.N.M.I. 12 1 - - - - - -
American Samoa 11 - - - - - - -
--------------------------------------------------------------------------------------------------------------------------------------------
* Cases updated through Division of Sexually Transmitted Diseases and HIV Prevention, National Center for Prevention
Services, as of February 28, 1995.
============================================================================================================================================
Return to top. Table_2D Note: To print large tables and graphs users may have to change their printer settings to landscape and use a small font size.
NOTIFIABLE DISEASES -- Reported cases, by geographic division and area, United States, 1994 (continued)
==============================================================================================================================
Measles
----------------------
Area Malaria Indigenous Imported Memingococcal Mumps Pertussis Plague Poliomyelitis,
disease paralytic
------------------------------------------------------------------------------------------------------------------------------
United States 1,229 746 217* 2,886 1,537 4,617 17 -+
New England 78 15 12 141 26 760 - -
Maine 6 2 3 23 3 21 - -
N.H. 3 1 - 8 4 107 - -
Vt. 3 2 1 5 - 46 - -
Mass. 38 1 6 68 3 534 - -
R.I. 10 5 2 - 4 8 - -
Conn. 18 4 - 37 12 44 - -
Mid. Atlantic 261 200 27 312 116 695 - -
N.Y. (excl. 60 12 16 105 33 254 -
NYC)
N.Y.C. 106 11 4 40 12 224 - -
N.J. 57 172 3 65 13 15 - -
Pa. 38 5 4 102 58 202 - -
E.N. Central 117 60 46 397 267 615 - -
Ohio 20 15 2 121 77 162 - -
Ind. 15 - 1 55 7 97 - -
Ill. 48 18 41 125 110 111 - -
Mich. 31 24 2 59 59 96 - -
Wis. 3 3 - 37 14 149 - -
W.N. Central 48 127 44 174 71 273 - -
Minn. 16 - - 23 5 142 - -
Iowa 5 6 1 21 16 23 - -
Mo. 14 119 42 78 44 45 - -
N. Dak. 1 - - 1 4 5 - -
S. Dak. - - - 9 - 26 - -
Nebr. 5 1 1 14 1 14 - -
Kans. 7 1 - 28 1 18 - -
S. Atlantic 247 65 9 455 257 431 - -
Del. 3 - - 5 - 3 - -
Md. 83 2 2 35 65 74 - -
D.C. 15 - - 7 - 11 - -
Va. 37 1 2 69 48 37 - -
W. Va. - 37 - 14 5 6 - -
N.C. 12 2 1 57 73 140 - -
S.C. 5 - - 40 8 14 - -
Ga. 43 5 - 82 18 37 - -
Fla. 49 18 4 146 40 109 - -
E.S. Central 32 28 - 195 32 129 - -
Ky. 12 - - 42 - 60 - -
Tenn. 10 28 - 40 9 22 - -
Ala. 9 - - 77 12 35 - -
Miss. 1 - - 36 11 12 - -
W.S. Central 119 16 7 392 302 246 - -
Ark. 5 5 - 55 7 33 - -
La. 12 - 1 47 38 15 - -
Okla. 9 - - 53 23 38 - -
Tex. 93 11 6 237 234 160 - -
Mountain 41 163 55 178 162 609 15 -
Mont. - - - 6 - 12 - -
Idaho 2 1 - 17 10 172 - -
Wyo. 1 - - 9 3 - - -
Colo. 19 24 37 41 4 228 2 -
N. Mex. 3 2 - 17 NN 35 7 -
Ariz. 10 5 4 58 99 122 5 -
Utah 4 131 5 19 28 37 1 -
Nev. 2 - 9 11 18 3 - -
Pacific 286 72 17 642 304 859 2 -
Wash. 45 3 1 111 23 140 - -
Oreg. 17 - 2 143 NN 106 - -
Calif. 207 51 10 374 258 594 2 -
Alaska 2 10 - 5 4 - - -
Hawaii 15 8 4 9 19 19 - -
Guam - 228 - 2 7 2 - -
P.R. 5 46 - 7 2 3 - -
V.I. 1 - - - 4 - - -
C.N.M.I. 1 29 - - 2 - - -
American Samoa - - - - 3 1 - -
------------------------------------------------------------------------------------------------------------------------------
* For 1994, includes both 142 cases of out-of-state importations and 75 cases of international importations.
+ Two suspected cases of paralytic poliomyelitis were reported in 1994. Confirmation of thesecases is pending review by
external panel.
==============================================================================================================================
Return to top. Table_2E Note: To print large tables and graphs users may have to change their printer settings to landscape and use a small font size.
NOTIFIABLE DISEASES -- Reported cases, by geographic division and area, United States, 1994 (continued)
=================================================================================================================================
Rabies Rheumatic Rubella
---------------- fever, ----------------------
Area Psittacosis Animal Human acute RMSF* Rubella Cong.syndrome Salmonellosis Shigellosis
---------------------------------------------------------------------------------------------------------------------------------
United States 38 8,147 6 112 465 227 7 43,323 29,769
New England 2 2,009 - 2 12 132 2 3,439 508
Maine - 10 - 1 - - - 191 10
N.H. 1 221 - NN - - - 213 20
Vt. 1 143 - - - - - 119 4
Mass. - 34 - 1 4 126 2 2,009 243
R.I. - 153 - - - 3 - 248 55
Conn. - 748 - - 8 3 - 659 176
Mid. Atlantic 6 2,249 - 5 24 8 - 7,066 3,163
N.Y. (excl. NYC) 1 1,569 - NN 8 6 - 1,977 1,120
N.Y.C. - 16 - NN 3 1 - 1,889 1,007
N.J. 1 278 - 5 5 1 - 1,160 522
Pa. 4 386 - NN 8 - - 2,040 514
E.N. Central 7 69 - 30 40 10 - 5,678 3,648
Ohio - 4 - 8 19 - - 1,337 740
Ind. 1 14 - 2 8 - - 581 544
Ill. - 21 - 8 11 1 - 1,821 1,494
Mich. 3 14 - 8 2 9 - 869 432
Wis. 3 16 - 4 - - - 1,070 438
W.N. Central 4 232 - 12 42 2 - 2,624 2,361
Minn. - 22 - 3 1 - - 759 554
Iowa - 90 - 3 1 - - 404 338
Mo. 4 27 - 3 22 2 - 642 654
N. Dak. - 14 - NN - - - 68 59
S. Dak. - 44 - 2 13 - - 143 207
Nebr. - - - NN 1 - - 209 426
Kans. - 35 - 1 4 - - 399 123
S. Atlantic 4 2,083 2 - 224 22 - 9,165 8,352
Del. - 74 - NN 1 - - 168 38
Md. 2 520 - NN 21 - - 1,178 323
D.C. - 4 - NN - - - 118 70
Va. 2 428 - NN 22 - - 1,135 656
W. Va. - 84 1 - 2 - - 152 15
N.C. - 175 - NN 88 - - 1,137 1,970
S.C. - 179 - NN 20 - - 599 505
Ga. - 367 - NN 62 7 - 1,583 1,886
Fla. - 252 1 NN 8 15 - 3,095 2,889
E.S. Central 1 242 2 - 47 - - 1,777 1,706
Ky. - 28 - NN 10 - - 380 208
Tenn. - 82 1 NN 29 - - 441 418
Ala. 1 128 1 NN 2 - - 507 617
Miss. - 4 - - 6 NN - 449 463
W.S. Central - 741 1 1 63 13 1 3,578 3,259
Ark. - 38 - 1 18 - - 534 193
La. - 73 - NN 1 - - 591 416
Okla. - 39 - NN 37 4 - 470 240
Tex. - 591 1 NN 7 9 1 1,983 2,410
Mountain 3 154 - 39 13 5 2 2,226 1,953
Mont. - 22 - NN 4 - - 145 4
Idaho - 4 - 1 - - - 130 59
Wyo. - 24 - 1 2 - - 60 8
Colo. 3 18 - 8 4 - - 709 530
N. Mex. - 8 - 1 1 - 1 353 347
Ariz. - 56 - NN 1 - 1 427 680
Utah - 13 - 28 - 4 - 202 240
Nev. - 9 - NN 1 1 - 200 85
Pacific 11 368 1 23 - 35 2 7,770 4,819
Wash. 4 15 - - - - - 863 478
Oreg. 2 13 - NN - 4 - 313 165
Calif. 4 294 1 18 - 27 2 6,235 3,953
Alaska 1 46 - 5 - - - 55 21
Hawaii - - - NN - 4 - 304 202
Guam - - - 3 - 1 - 76 33
P.R. - 77 - - - - - 737 48
V.I. - - - - - - - 2 4
C.N.M.I. - - - 4 - - - 78 60
American Samoa - - - - - - - 14 9
---------------------------------------------------------------------------------------------------------------------------------
* Rocky Mountain spotted fever.
=================================================================================================================================
Return to top. Table_2F Note: To print large tables and graphs users may have to change their printer settings to landscape and use a small font size.
NOTIFIABLE DISEASES -- Reported cases, by geographic division and area, United States, 1994 (continued)
==========================================================================================================================================================
Syphillis
-------------------------------------
Primary & Cong. Toxic shock Varicella
Area Secondary (<1 yr.) All stages Tetanus syndrome Trichinosis Tuberculosis Tularemia Typhoid fever (chicken pox)
----------------------------------------------------------------------------------------------------------------------------------------------------------
United 20,627* 2,204* 81,696* 51 192 32 24,361 96 441 151,219
States
New England 219 14 1,128 2 5 1 595 1 25 11,676
Maine 4 - 9 - 1 1 35 - - 711
N.H. 4 - 18 1 - - 17 - - 3,408
Vt. - - 1 - 2 - 10 - - NN
Mass. 90 6 622 - 2 - 329 1 20 5,903
R.I. 16 2 141 - - - 56 - 1 1,654
Conn. 105 6 337 1 - - 148 - 4 NN
Mid. 1,446 681 14,302 7 30 5 5,112 2 121 5,978
Atlantic
N.Y. (excl. 173 59 1,375 3 16 2 641 1 12 NN
NYC)
N.Y.C. 629 329 8,001 - - - 2,995 1 78 5,978
N.J. 240 178 2,188 2 - 2 855 - 25 NN
Pa. 404 115 2,738 2 14 1 621 - 6 NN
E.N. Central 3,162 386 9,492 8 43 3 2,236 6 68 77,332
Ohio 1,187 71 2,740 1 10 - 337 1 7 5,495
Ind. 286 11 844 2 3 - 211 - 4 NN
Ill. 1,099 258 3,877 1 15 - 1,117 3 42 33,889
Mich. 292 28 1,234 4 15 1 462 1 6 37,948
Wis. 298 18 797 - - 2 109 1 9 NA
W.N. Central 1,203 82 2,663 4 28 2 610 38 2 18,210
Minn. 56 2 201 1 2 - 140 1 1 NN
Iowa 75 6 235 1 8 1 66 - - 4,197
Mo. 987 72 1,985 1 7 1 260 24 1 10,147
N. Dak. - - 1 - 1 - 10 1 - 48
S. Dak. 2 - 8 - - - 28 2 - 619
Nebr. 10 - 46 - 5 - 22 3 - 2
Kans. 73 2 187 1 5 - 84 7 - 3,197
S. Atlantic 5,362 322 18,942 7 12 1 4,448 2 56 8,653
Del. 27 5 138 - - - 57 - 1 2
Md. 325 9 1,538 1 - - 363 1 14 NN
D.C. 170 28 967 - - - 121 - 1 16
Va. 796 18 1,919 2 1 - 372 - 9 2,844
W. Va. 8 2 179 - - - 80 - - 5,656
N.C. 1,672 44 4,023 1 1 - 566 - 1 NN
S.C. 799 100 1,945 1 - - 387 NN - 135
Ga. 820 42 3,185 - 1 1 740 1 2 NN
Fla. 745 74 5,048 2 9 - 1,762 - 28 NN
E.S. Central 3,997 144 9,992 - 6 - 1,578 3 6 4,701
Ky. 208 13 534 - 2 - 347 2 1 984
Tenn. 1,044 57 2,978 - 2 - 520 - 3 3,717
Ala. 661 18 1,933 - 1 - 433 - 2 NN
Miss. 2,084 56 4,547 - 1 - 278 1 - NN
W.S. Central 4,124 355 16,275 15 2 - 3,500 27 17 16,159
Ark. 446 29 1,328 - - - 264 23 - NN
La. 1,608 87 5,422 2 - - 433 1 4 NN
Okla. 157 15 497 1 2 - 261 3 3 NN
Tex. 1,913 224 9,028 12 - - 2,542 - 10 16,159
Mountain 242 23 1,137 2 12 4 654 9 13 7,286
Mont. 3 - 9 - - - 24 3 - 53
Idaho 2 - 10 - 3 - 13 - - NN
Wyo. - - 3 - - 2 12 - - NN
Colo. 126 4 296 1 6 1 94 1 3 NN
N. Mex. 18 - 178 - - - 81 1 1 NN
Ariz. 50 16 419 - 1 - 249 - 4 6,783
Utah 12 - 51 1 2 - 55 2 2 450
Nev. 31 3 171 - - 1 126 2 3 NN
Pacific 872 197 7,765 6 54 16 5,628 8 133 1,224
Wash. 36 3 281 1 7 - 264 1 12 NN
Oreg. 22 - 100 - - - 165 4 5 NN
Calif. 807 194 7,321 5 43 12 4,859 2 111 NN
Alaska 3 - 22 - - 4 93 1 - NN
Hawaii 4 - 41 - 4 - 247 - 5 1,224
Guam 2 - 7 - - - 21 - 1 952
P.R. 311 20 2,018 2 - - 274 - - 9,193
V.I. 7 - 30 - - - 10 - - 551
C.N.M.I. - - - - - - 14 - 1 121
American Samoa - - - - - - 5 - 1 74
----------------------------------------------------------------------------------------------------------------------------------------------------------
* Cases updated through Division of Sexually Transmitted Diseases and HIV Prevention, National Center for Prevention Services, as of February 28, 1995.
==========================================================================================================================================================
Return to top. Table_3 Note: To print large tables and graphs users may have to change their printer settings to landscape and use a small font size.
NOTIFIABLE DISEASE -- Summary of reported cases, by age group, United States, 1994
================================================================================================================================================
NAME                Total    Under 1    1-4       5-9      10-14    15-19    20-24     25-29     30-39   40-49      50-59     60+    Age not
------------------------------------------------------------------------------------------------------------------------------------------------
AIDS*               78,279     318      418       148       146      324     2,604     10,162   35,466   20,676     5,940    2,077      -
Amebiasis           2,983      19       116       178       144      102      142       208       474    243         123      122     1,112
Anthrax               -         -        -         -         -        -        -         -         -     -            -        -        -
Aseptic             8,932     2,148     734       762       550      493      686       833      1,367   561         242      322      234
meningitis
Botulism, total      143       81        2         -         3        2        6         8         8     14          10        5        4
Brucellosis          119        2        5         4         7       11        10        15       25     19           7       12        2
Cholera               39        -        1         -         -        1        2         4         7     6            7       11        -
Diphtheria            2         -        1         -         -        -        1         -         -     -            -        -        -
Encephalitis,        717       54        71        86       72       42        40        52       76     50          56       114       4
primary
infections
Post-infectious      143        7        17        31       11        8        8         5        13     11           6       25        1
Escherichia coli    1,420      28       304       176       132      111       64        60       109    101         103      167       65
O157:H7
Gonorrhea+         413,647      -        -         -       8,508   123,079  121,084    60,204   63,985   ........  25,068   .......   9,670
Haemophilus         1,174      210      119        33       18       26        18        23       74     76          79       463       35
influenzae,
invasive
Hansen disease       136        -        -         -         4        6        9         8        24     18          18       26        23
(leprosy)
Hepatitis A         26,796     130     1,911     4,076     2,492    2,036    2,770     2,981     4,904   2,390      1,049    1,279     778
Hepatitis B         12,517     55        73        82       165      807     1,618     1,940     3,615   2,027       840      845      450
Hepatitis, C/non-   4,470      19        15        14       21       70       172       420      1,668   1,259       331      401       80
A non-B
Hepatitis,           444        6        23        47       26       30        38        50       109    48          18       41        8
unspecified
Legionellosis       1,615       6        5         4         3       19        28        39       170    259         276      768       38
Leptospirosis         38        -        -         1         2        3        2         7         9     8            1        5        -
Lyme disease        13,043     27       650      1,142      831      632      473       640      2,062   2,207      1,612    2,540     227
Malaria             1,229      11        52        65       61       79       149       120       297    196         86       75        38
Measles (rubeola)    963       72       174        95       128      255      112        43       60     15           2        1        6
Meningococcal       2,886      479      537       248       183      332      180        87       157    162         122      333       66
disease
Mumps               1,537      13       237       473       271      128       59        61       108    52          20       12       103
Pertussis           4,617     1,640     837       496       548      301       66        76       187    129         46       34       257
(whooping cough)
Plague                17        -        2         2         2        1        -         1         2     3            3        -        1
Poliomyelitis,        -         -        -         -         -        -        -         -         -     -            -        -        -
paralytic@
Psittacosis           38        -        1         -         2        -        1         3        10     15           3        3        -
Rabies, human         6         -        -         -         1        -        1         -         -     4            -        -        -
Rheumatic fever,     112        1        4         28       26       10        3         4         8     3            -        4        21
acute
Rocky Mountain       465        3        29        51       24       34        23        25       85     58          61       65        7
spotted fever
Rubella (German      227       11        17        13        4       11        32        33       54     38          10        4        -
measles)
Salmonellosis       43,323    5,265    6,425     2,804     1,600    1,541    2,011     2,261     4,406   2,879      1,975    4,511    7,645
Shigellosis         29,769     645     8,094     5,856     1,585     873     1,472     1,702     2,476   1,059       542      668     4,797
Syphilis, primary   20,638      -        -         -        118     2,234    4,067     3,814     6,638   ........   3,692   .......     41
and secondary                                                                                            ........           .......
                                                                                                         ........             ...
                                                                                                         ..
Tetanus               51        -        -         -         1        1        3         3         9     3            5        2
                      2
Toxic-shock          192        2        6         7        20       25        19        22       48     25           8       10        -
syndrome
Trichinosis           32        -        1         1         2        3        6         1         8     2            4        4        -
Tuberculosis        24,361     164      860       399       272      544     1,281     1,808     4,859   4,375      2,920    6,831      48
Tularemia             96        1        7         11        8        4        5         3         3     12          16       22        4
Typhoid fever        441       10        43        51       32       38        59        49       90     28          19       16        6
Varicella          151,219     227     2,772     4,119      771      256      207       218       219    78          33       37     142,282
(chickenpox)
------------------------------------------------------------------------------------------------------------------------------------------------
* AIDS total updated through December 31, 1994.
+ Age data are collected on aggregate forms different from those used for numbers of reported cases. Therefore, total cases reported on this
  table may differ slightly from other tables. Cases among persons ages <9 years are not shown because some of these may not be due to sexual
  transmission; however, they are included in the totals.
@ Two suspected cases of paralytic poliomyelitis were reported in 1994. Confirmation of these cases is pending review by external panel.
================================================================================================================================================
Return to top. Table_4 Note: To print large tables and graphs users may have to change their printer settings to landscape and use a small font size.
NOTIFIABLE DISEASES -- Summary of reported cases, by race, * United States, 1994
====================================================================================================
                             American
                            Indian or    Asian or
                             Alaskan      Pacific                                       Race not
Name               Total      Native     Islander      Black       White       Other    stated+
----------------------------------------------------------------------------------------------------
AIDS@              78,279      227          576        31,457      33,180        -       12,839
Amebiasis          2,983        10          144         123         628         14       2,064
Anthrax              -          -            -           -           -           -         -
Aseptic            8,932        19          155        1,338       5,229        23       2,168
meningitis
Botulism, total     143         11           4           1           97          1         29
Brucellosis         119         -            -           5           64          3         47
Cholera              39         -            2           -           17          1         19
Diphtheria           2          -            -           -           2           -         -
Encephalitis,       717         1           11           80         484          3        138
primary
infections
Post-infectious     143         -            2           20          96          -         25
Escherichia coli   1,420        3            9           31         856          6        515
O157:H7
Gonorrhea&        413,647     1,829        1,416      271,195      43,618        -       95,589
Haemophilus        1,174        16          13          174         701          1        269
influenzae,
invasive
Hansen disease      136         -           57           3           29          -         47
(leprosy)
Hepatitis A        26,796     2,330         386        1,737       15,275       98       6,970
Hepatitis B        12,517      101          837        2,745       5,158        50       3,626
Hepatitis,C/non-   4,470        53          35          723        2,400         9       1,250
A non-B
Hepatitis,          444         22          14           33         242          1        132
unspecified
Legionellosis      1,615        7           14          138         999          1        456
Leptospirosis        38         -            8           -           23          -         7
Lyme disease       13,043       41          82          205        9,589         7       3,119
Malaria            1,229        3           167         407         327         22        303
Measles             963         1           37           80         641          -        204
(rubeola)
Meningococcal      2,886        34          32          352        1,869         8        591
disease
Mumps              1,537        8           55          115         887          1        471
Pertussis          4,617        20          57          281        2,454         9       1,796
(whooping cough)
Plague               17         8            -           -           7           -         2
Poliomyelitis,       -          -            -           -           -           -         -
paralytic**
Psittacosis          38         1            -           -           19          -         18
Rabies, human        6          -            -           1           4           -         1
Rheumatic fever,    112         1            2           1           58          -         50
acute
Rocky Mountain      465         14           2           19         324          1        105
spotted fever
Rubella (German     227         -           12           9          131         48         27
measles)
Rubella,             7          -            1           1           5           -         -
congenital
syndrome
Salmonellosis      43,323      264          512        3,713       19,702       49       19,083
Shigellosis        29,769      731          161        5,169       12,159       34       11,515
Syphilis,          20,638       43          73         17,619      1,830         -       1,073
primary and
secondary&
Tetanus              51         -            1           9           32          -         9
Toxic-shock         192         -            5           4          145          -         38
syndrome
Trichinosis          32         -            1           2           12          -         17
Tuberculosis       24,361      341         3,868       8,622       11,309        -        221
Tularemia            96         2            1           2           69          -         22
Typhoid fever       441         5           126          44          73         12        181
Varicella         151,219       6           232        1,997        853          -      148,131
(chickenpox)
----------------------------------------------------------------------------------------------------
*  Some information on race/ ethnicity was reported using one variable with the following
   categories: American Indian or Alaska Native, Asian or Pacific Islander, Black non-
   Hispanic, White non- Hispanic, and Hispanic. Race not stated includes cases originally reported
   as Hispanic.
+  Includes cases originally reported as Hispanic: 12,699 for AIDS; 14,907 for Gonorrhea; and 794
   for Syphilis, primary and secondary.
@  AIDS total reported through December 31, 1994.
&  Race data are collected on aggregate forms different from those used for numbers of reported
   cases. Therefore, total cases reported on this table may differ slightly from other tables.
** Two suspected cases of paralytic poliomyelitis were reported in 1994. Confirmation of these cases
   is pending review by external panel.
====================================================================================================
Return to top. Table_5 Note: To print large tables and graphs users may have to change their printer settings to landscape and use a small font size.
NOTIFIABLE DISEASES -- Summary of reported cases, by ethnicity, * United States, 1994.
============================================================================================
                                                        Ethnicity not
NAME                Total      Hispanic   Non-Hispanic      stated
--------------------------------------------------------------------------------------------
AIDS+               78,279      12,699       64,637          943
Amebiasis           2,983         386          541          2,056
Anthrax               -            -            -             -
Aseptic             8,932        1,030        4,369         3,533
meningitis
Botulism, total      135          26           73             36
Brucellosis          119          79           15             25
Cholera               39          17           10             12
Diphtheria            2            -            2             -
Encephalitis,        717          42           343           332
primary
infections
Post- infectious     143          12           75             56
Escherichia coli    1,420         34           708           678
O157:H7
Gonorrhea@         413,647      14,907       314,813        83,927
Haemophilus         1,174         66           712           396
influenzae,
invasive
Hansen disease       136          30           70             36
(leprosy)
Hepatitis A         26,796       5,386       13,940         7,470
Hepatitis B         12,517       1,031        6,580         4,906
Hepatitis, C/non-   4,470         387         2,259         1,824
A non-B
Hepatitis,           444          123          214           107
unspecified
Legionellosis       1,615         26           823           766
Leptospirosis         38           -           20             18
Lyme disease        13,043        165         6,118         6,760
Malaria             1,229         91           716           422
Measles              963          55           651           257
(rubeola)
Meningococcal       2,886         298         1,684          904
disease
Mumps               1,537         188          684           665
Pertussis           4,617         403         2,050         2,164
(whooping cough)
Plague                17           -           16             1
Poliomyelitis,        -            -            -             -
paralytic&
Psittacosis           38           2           12             24
Rabies, human         6            1            2             3
Rheumatic fever,     112           5           28             79
acute
Rocky Mountain       465           6           244           215
spotted fever
Rubella (German      227          78           118            31
measles)
Rubella,              7            3            4             -
congenital
syndrome
Salmonellosis       43,323       2,564       16,052         24,707
Shigellosis         29,769       2,909       12,149         14,711
Syphilis,primary    20,638        794        19,449          395
and secondary@
Tetanus               51           1           28             22
Toxic-shock          192           5           127            60
syndrome
Trichinosis           32           1            7             24
Tuberculosis        24,361       5,074       19,084          203
Tularemia             96           2           22             72
Typhoid fever        441          114          204           123
Varicella          151,219       1,697        1,393        148,129
(chickenpox)
--------------------------------------------------------------------------------------------
* Some information on race/ethnicity was reported using one variable with the following
  categories: American Indian or Alaska Native,Asian or Pacific Islander, Black non-
  Hispanic, White non- Hispanic,and Hispanic. Ethnicity not stated includes cases originally
  reported as American Indian or Alaska Native and Asian or Pacific Islander.
+ AIDS total reported through December 31, 1994.
@ Ethnicity data are collected on aggregate forms different from those used for numbers of
  reported cases. Therefore, total cases reported on this table may differ slightly from
  other tables.
& Two suspected cases of paralytic poliomyelitis were reported in 1994. Confirmation of
  these cases is pending review by external panel.
============================================================================================
Return to top. Table_6 Note: To print large tables and graphs users may have to change their printer settings to landscape and use a small font size. Return to top. Figure_1 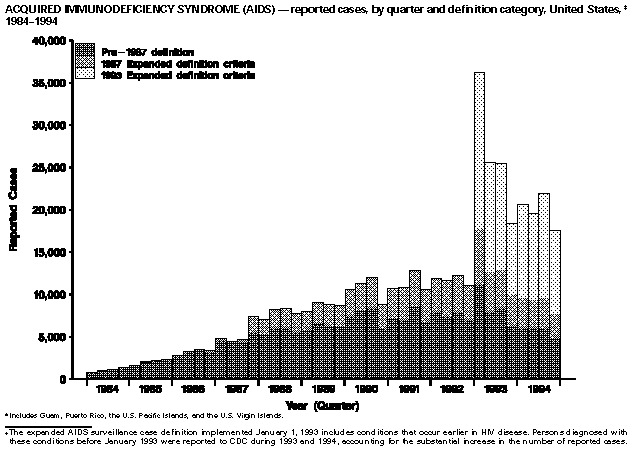 Return to top. Figure_2 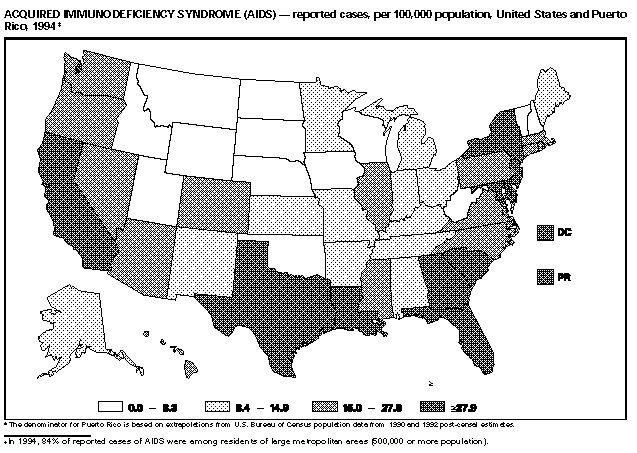 Return to top. Figure_3 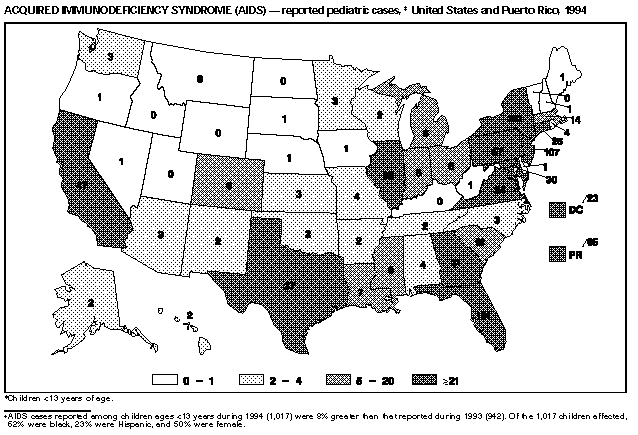 Return to top. Figure_4 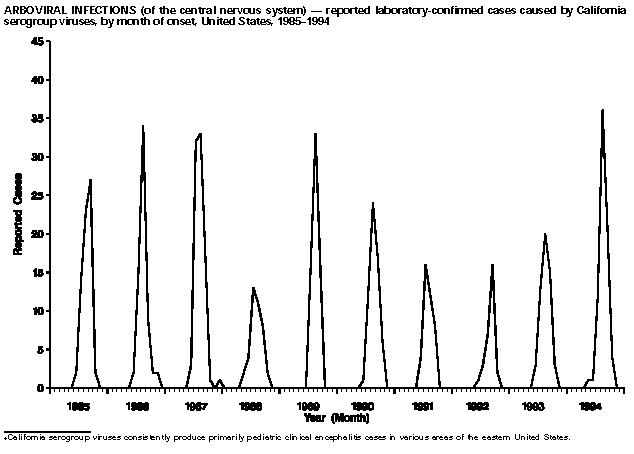 Return to top. Figure_5 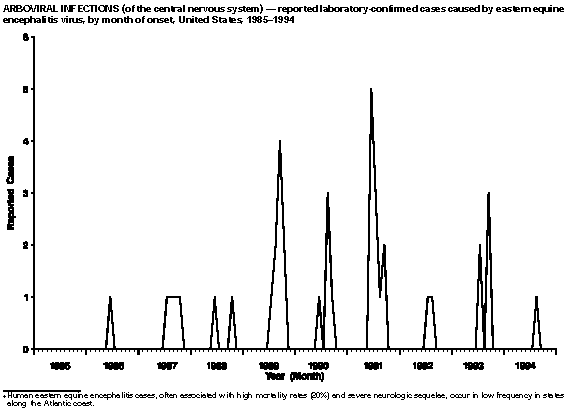 Return to top. Figure_6 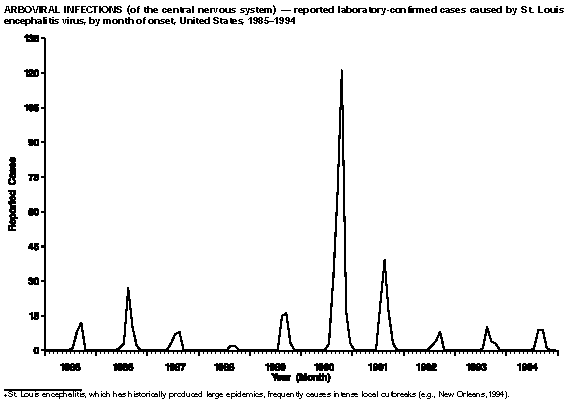 Return to top. Figure_7 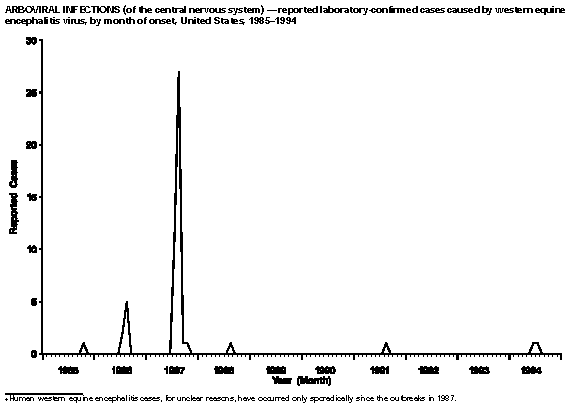 Return to top. Figure_8A 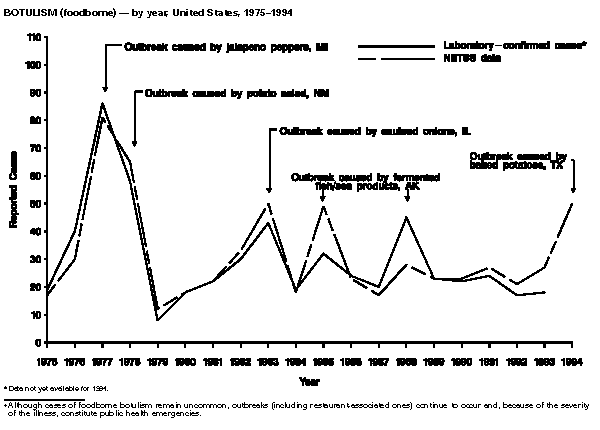 Return to top. Figure_8B 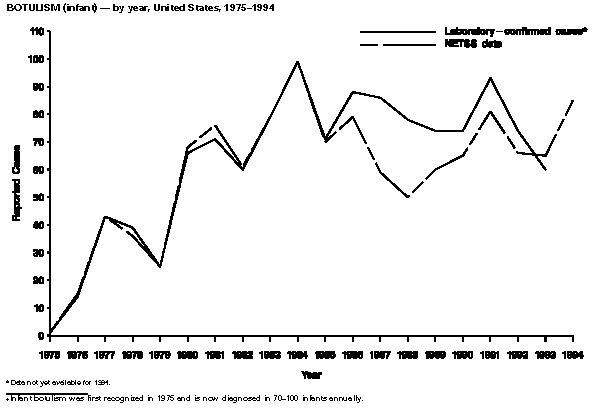 Return to top. Figure_9 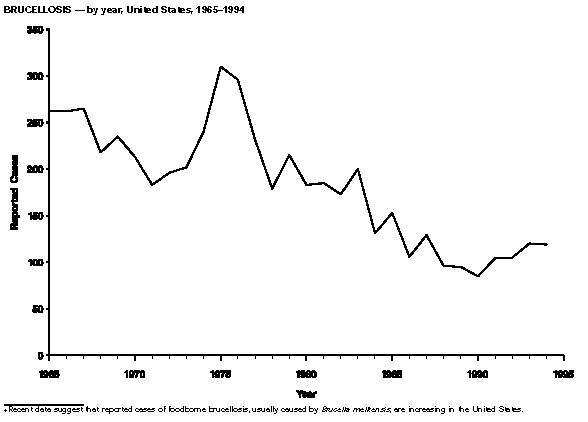 Return to top. Figure_10 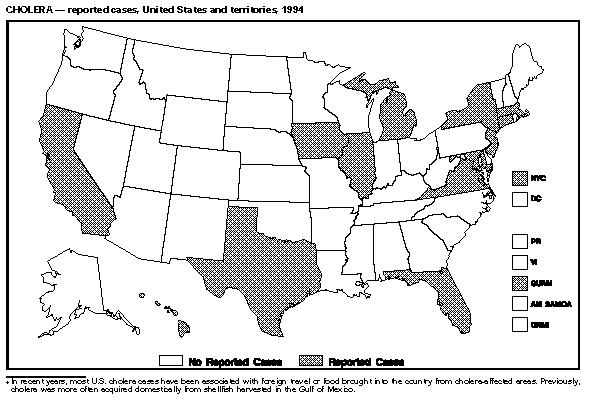 Return to top. Figure_11 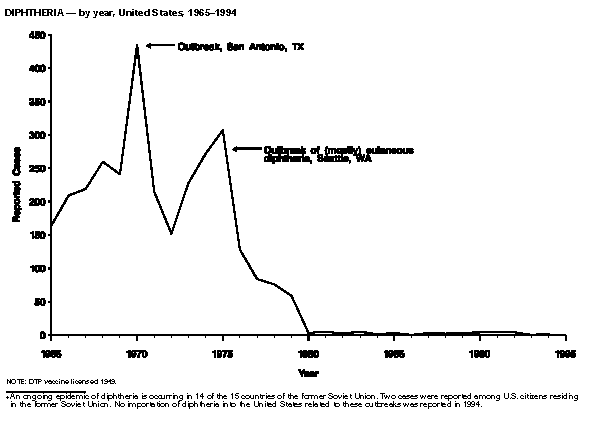 Return to top. Figure_12 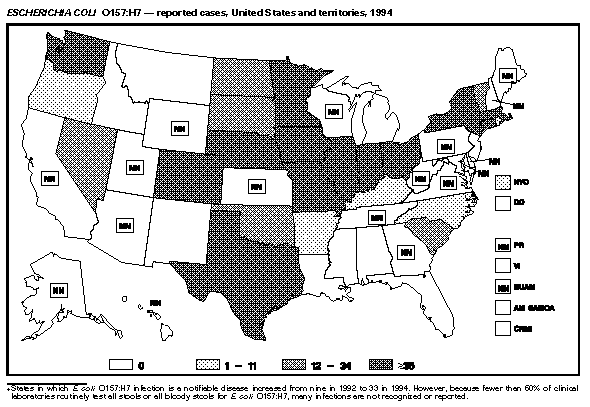 Return to top. Figure_13 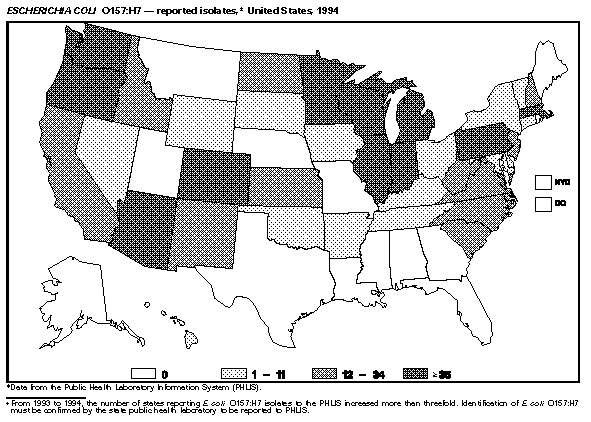 Return to top. Figure_14 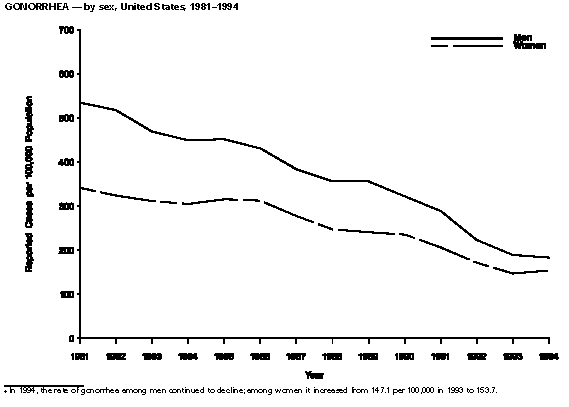 Return to top. Figure_15 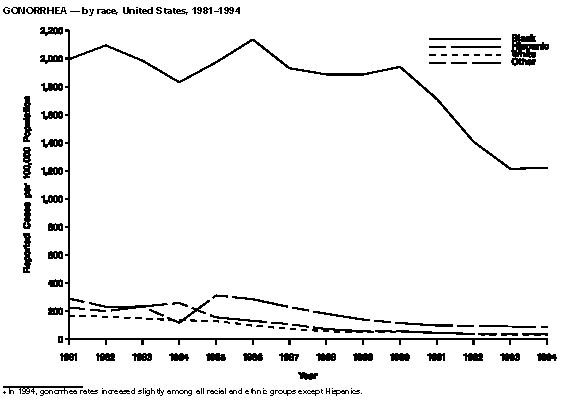 Return to top. Figure_16 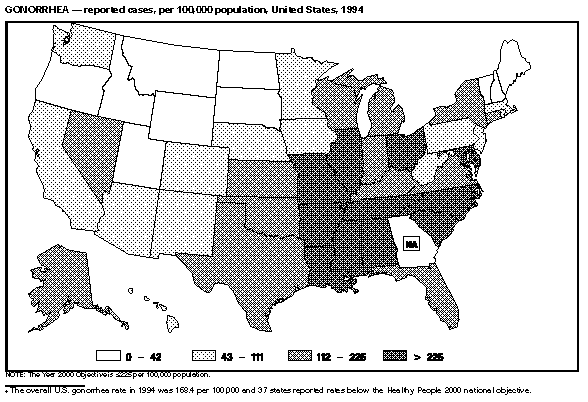 Return to top. Figure_17 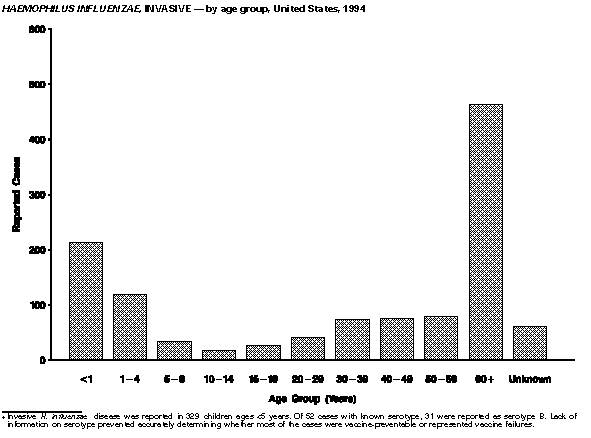 Return to top. Figure_18 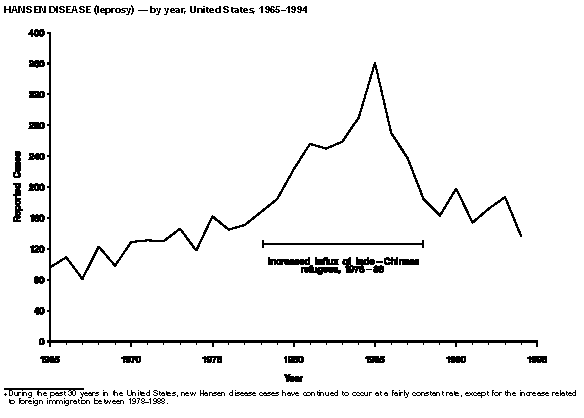 Return to top. Figure_19 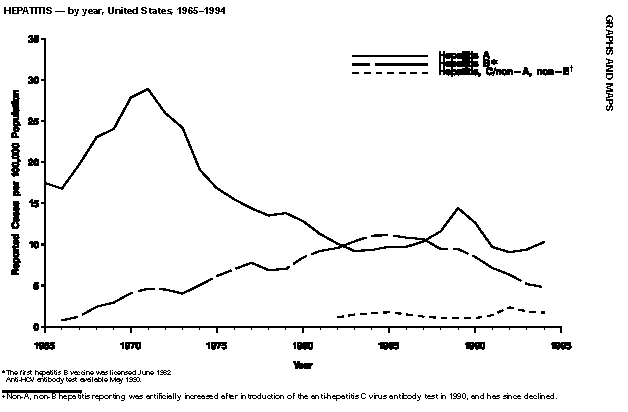 Return to top. Figure_20 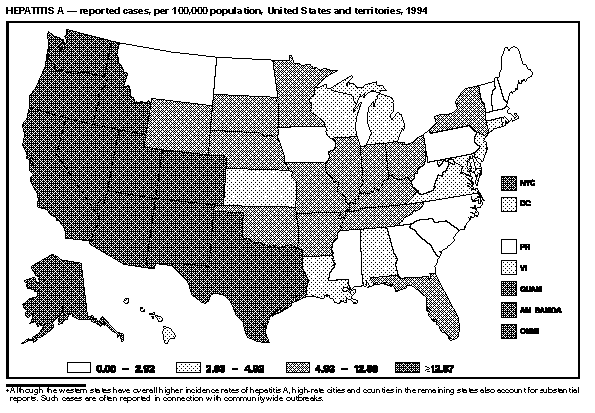 Return to top. Figure_21 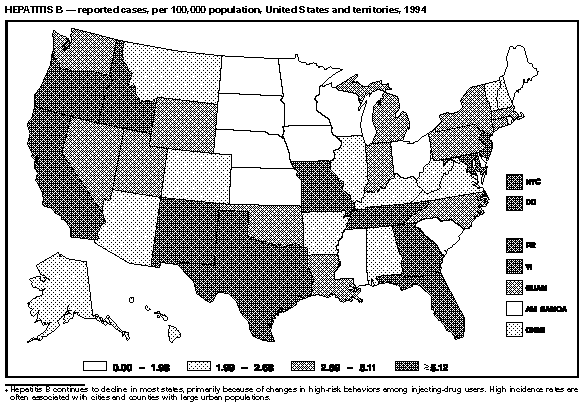 Return to top. Figure_22 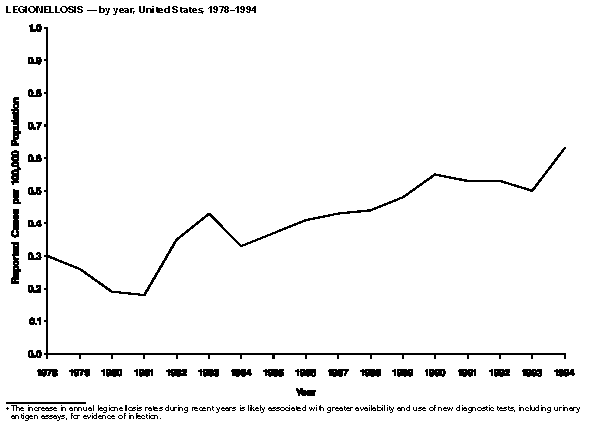 Return to top. Figure_23 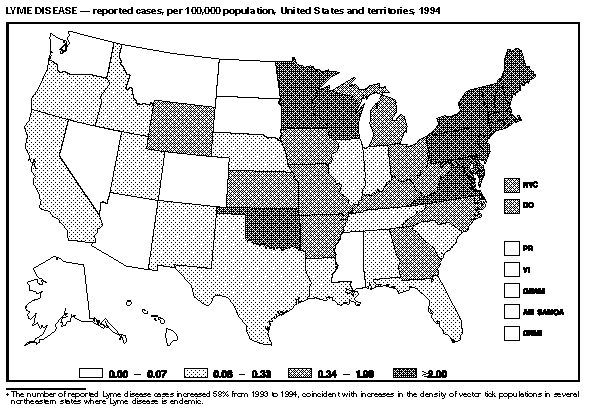 Return to top. Figure_24 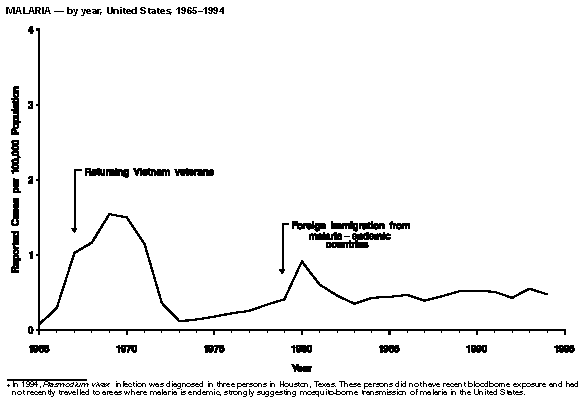 Return to top. Figure_25 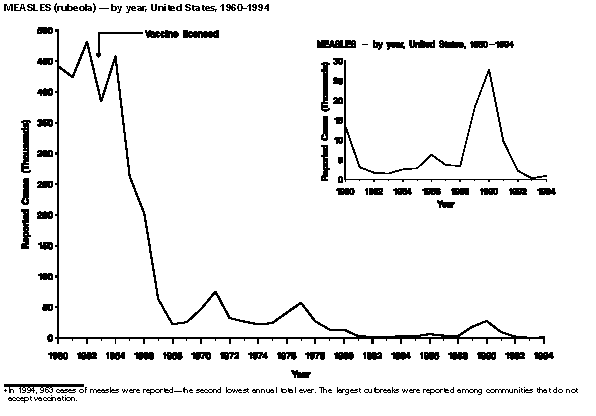 Return to top. Figure_26 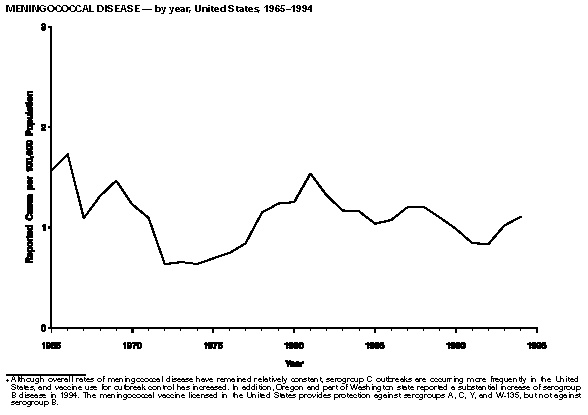 Return to top. Figure_27 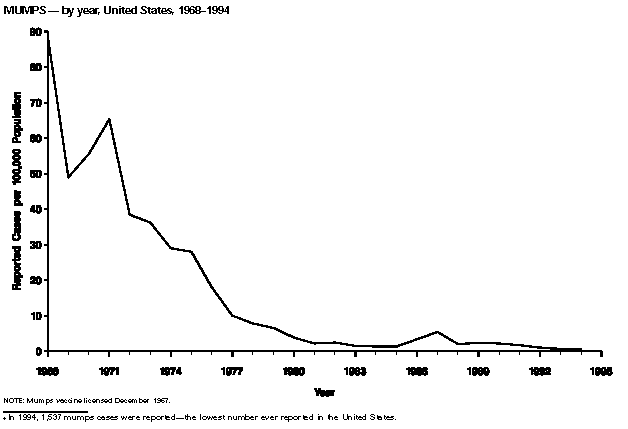 Return to top. Figure_28 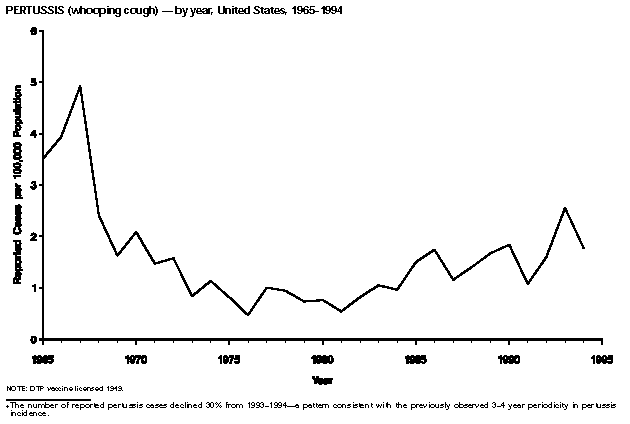 Return to top. Figure_29 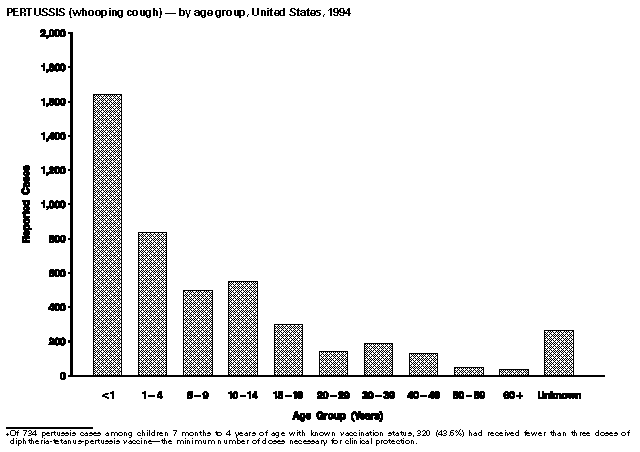 Return to top. Figure_30 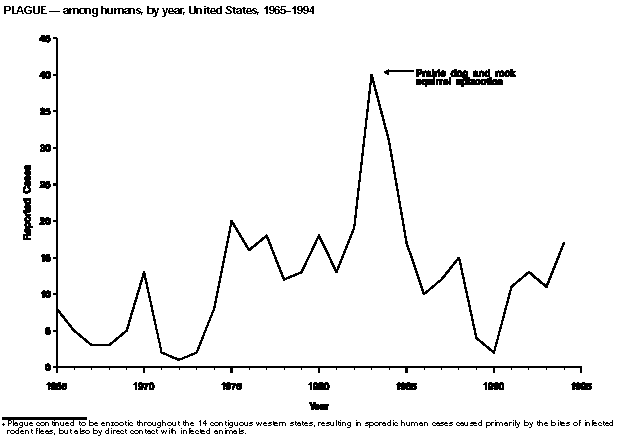 Return to top. Figure_31 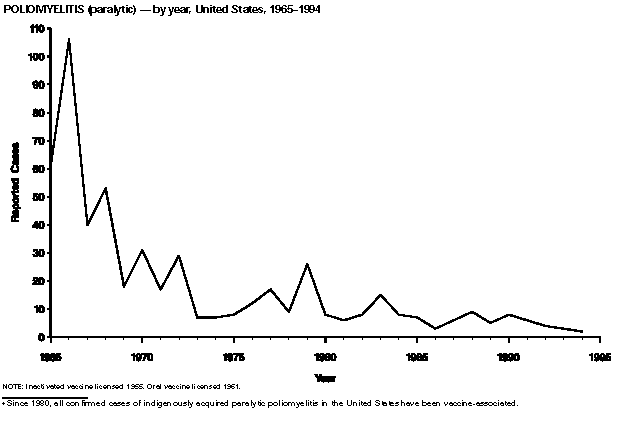 Return to top. Figure_32 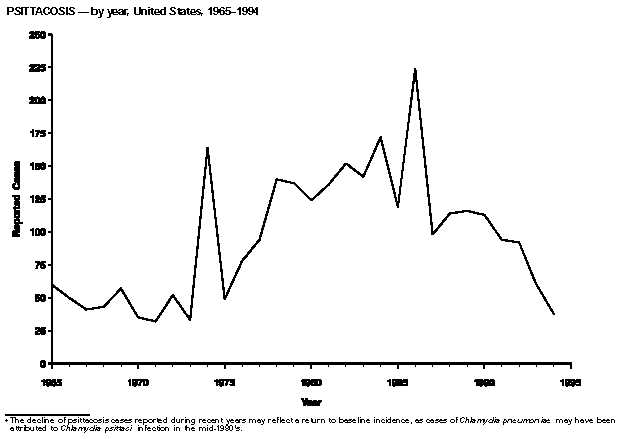 Return to top. Figure_33 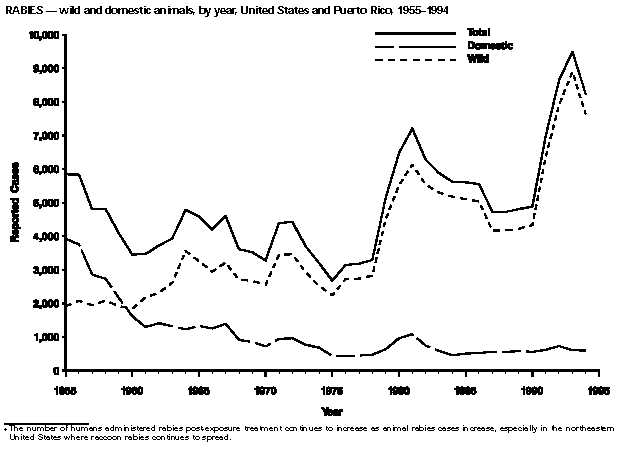 Return to top. Figure_34 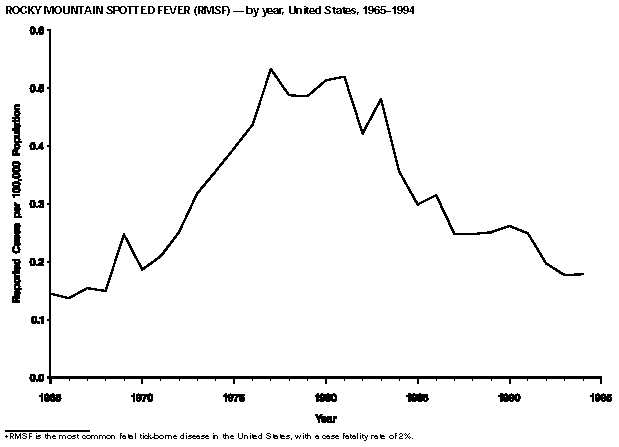 Return to top. Figure_35 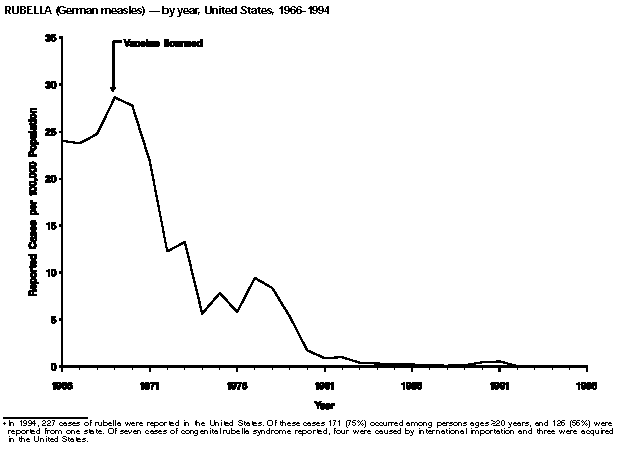 Return to top. Figure_36 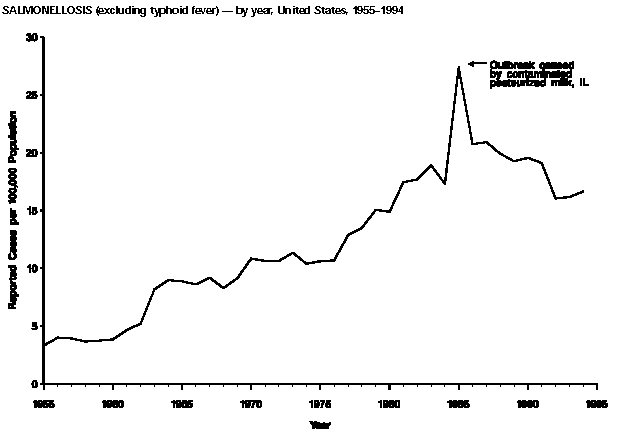 Return to top. Figure_37 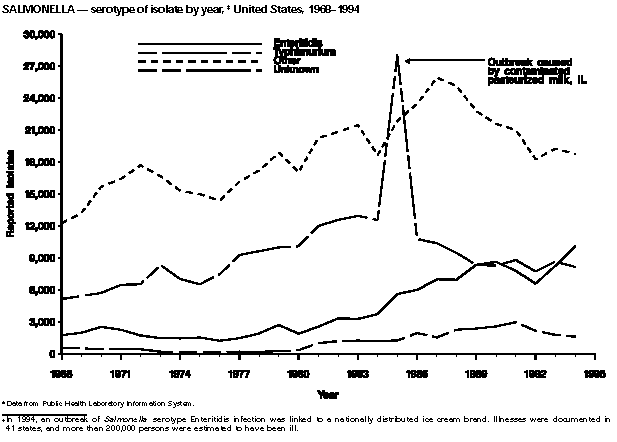 Return to top. Figure_38 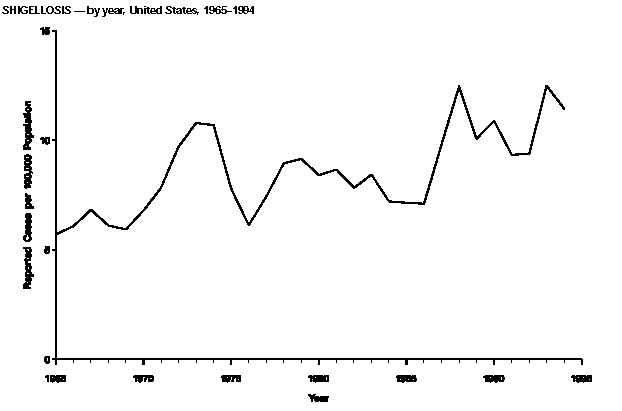 Return to top. Figure_39 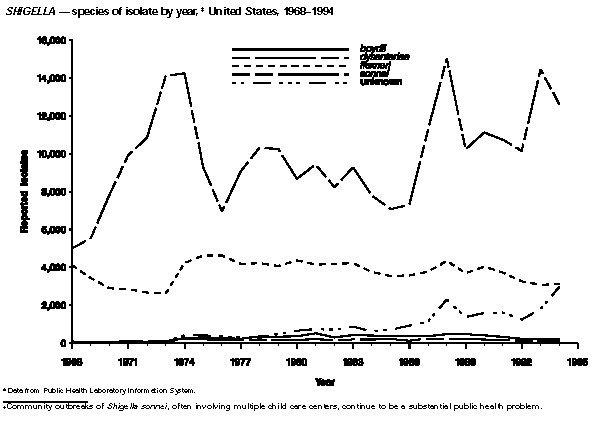 Return to top. Figure_40 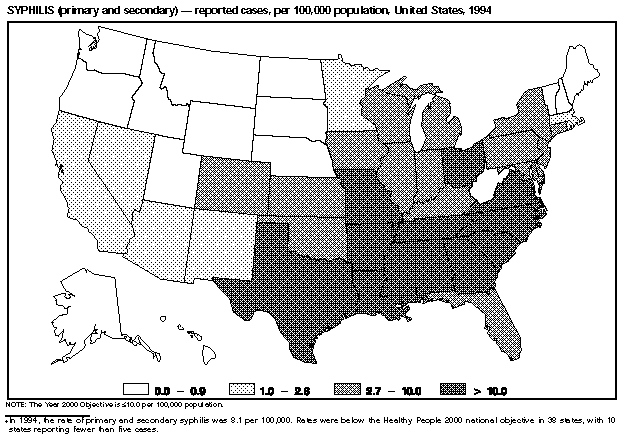 Return to top. Figure_41 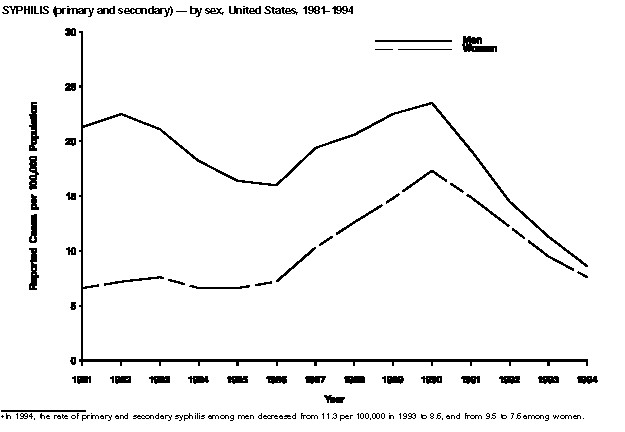 Return to top. Figure_42 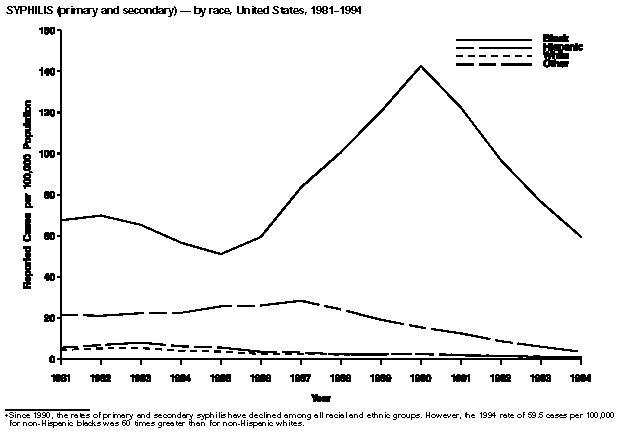 Return to top. Figure_43 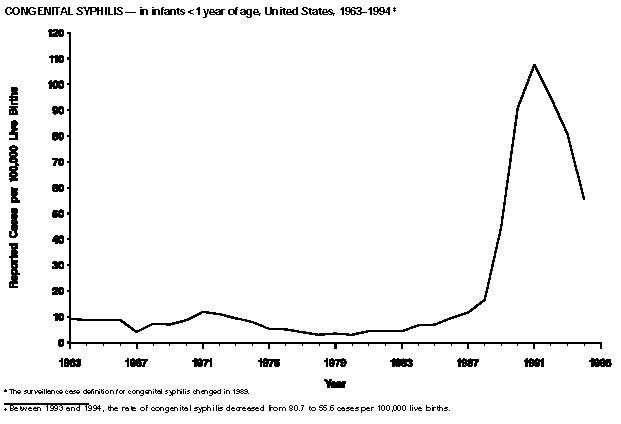 Return to top. Figure_44 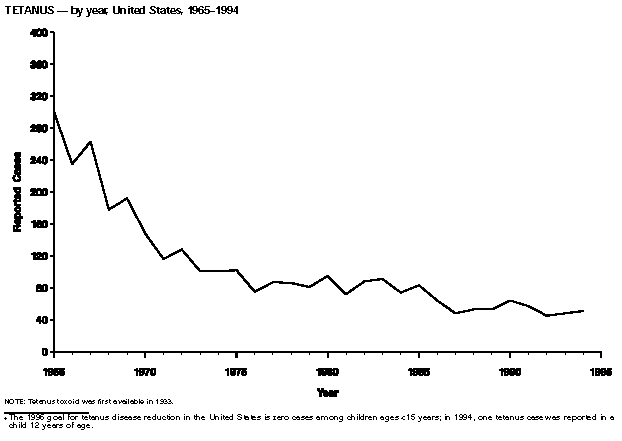 Return to top. Figure_45 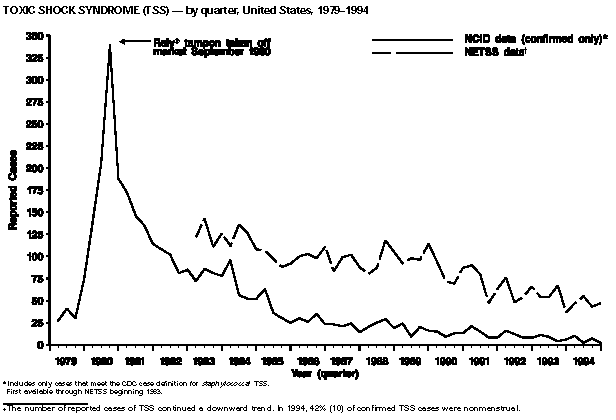 Return to top. Figure_46 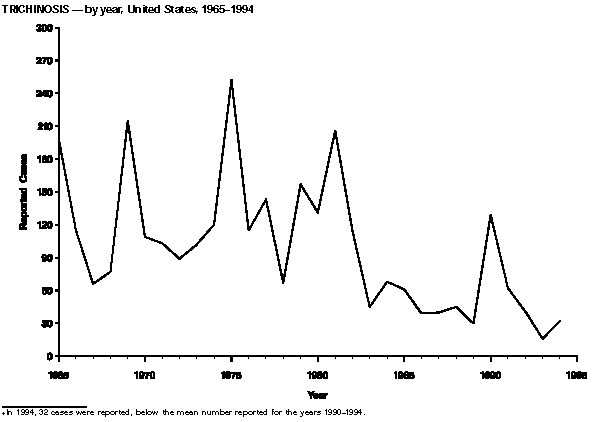 Return to top. Figure_47 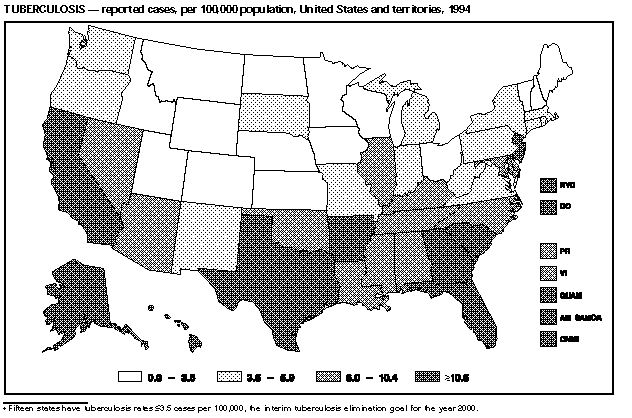 Return to top. Figure_48 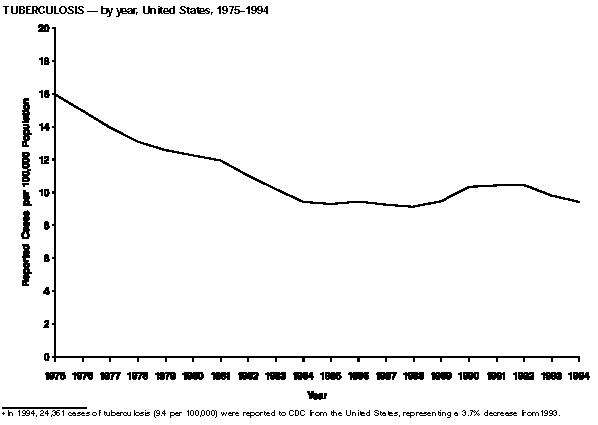 Return to top. Figure_49 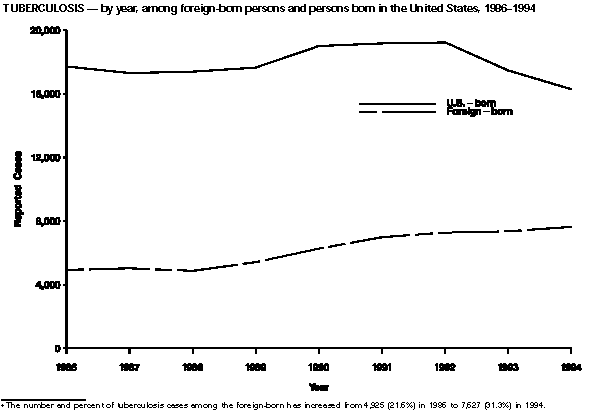 Return to top. Figure_50 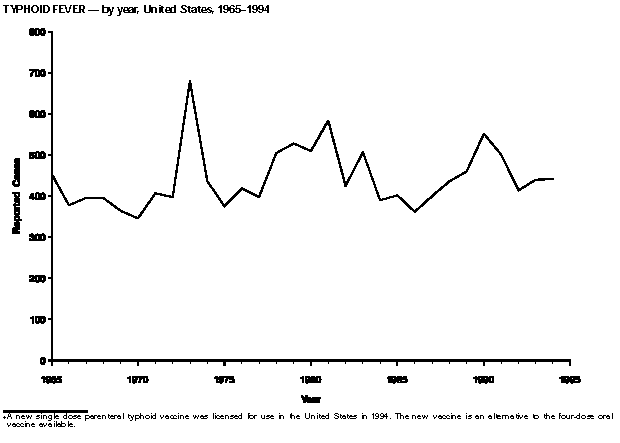 Return to top. Figure_51 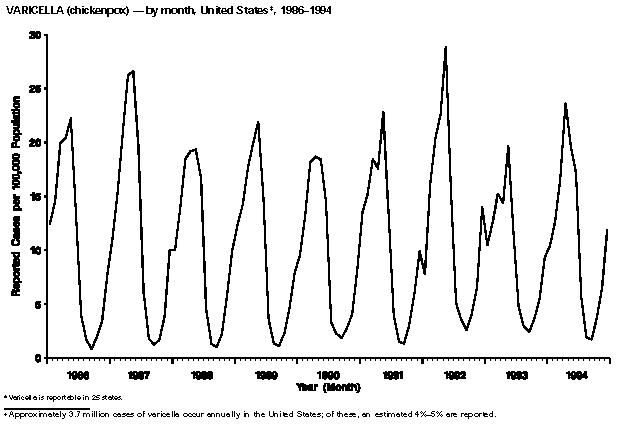 Return to top. Table_7 Note: To print large tables and graphs users may have to change their printer settings to landscape and use a small font size. NOTIFIABLE DISEASES -- summary of reported cases, per 100,000 population, United States, 1985-1994 ================================================================================================================== Disease 1994 1993 1992 1991 1990 1989 1988 1987 1986 1985 ------------------------------------------------------------------------------------------------------------------ AIDS 30.07 40.20 17.83 17.32 16.72 13.58 12.61 8.66 5.36 3.46 Amebiasis 1.20 1.21 1.21 1.23 1.38 1.34 1.20 1.33 1.47 1.92 Anthrax 0.00 0.00 0.00 0.00 0.00 0.00 0.00 0.00 0.00 0.00 Aseptic meningitis 3.71 5.39 5.18 6.26 4.77 4.14 2.94 4.72 4.72 4.50 Botulism, total 0.06 0.04 0.04 0.05 0.04 0.04 0.03 0.03 0.05 0.05 (including wound and unsp.) Foodborne 0.02 0.01 0.00 0.01 0.01 0.01 0.01 0.01 0.01 0.02 Brucellosis 0.05 0.05 0.04 0.04 0.03 0.04 0.04 0.05 0.04 0.06 Chancroid* 0.30 0.54 0.80 1.40 1.70 1.90 2.04 2.07 1.57 0.87 Cholera 0.02 0.00 0.04 0.01 0.00 0.00 0.00 0.00 0.01 0.00 Diphtheria 0.00 0.00 0.00 0.00 0.00 0.00 0.00 0.00 0.00 0.00 Encephalitis, 0.28 0.36 0.30 0.40 0.54 0.40 0.36 0.58 0.54 0.58 primary Post-infectious 0.06 0.07 0.05 0.03 0.04 0.04 0.05 0.05 0.05 0.07 Escherichia coli 0.82 ..................................... + .................................. O157:H7 Gonorrhea* 168.40 172.40 201.60 249.48 276.60 297.36 298.74 323.14 376.37 384.51 Granuloma 0.00 0.00 0.00 0.01 0.00 0.00 0.00 0.01 0.03 0.02 inguinale* Haemophilus 0.45 0.55 0.55 1.10 ................. +................................. influenzae, invasive Hansen disease 0.05 0.07 0.07 0.06 0.08 0.07 0.07 0.10 0.11 0.15 (leprosy) Hepatitis A 10.29 9.40 9.06 9.67 12.64 14.43 11.60 10.39 10.02 10.03 Hepatitis B 4.81 5.18 6.32 7.14 8.48 9.43 9.43 10.65 11.17 11.50 Hepatitis, C/non-A, 1.78 1.86 2.36 1.42 1.03 1.02 1.07 1.23 1.55 l.81 non-B@ Hepatitis, 0.17 0.24 0.35 0.50 0.67 0.93 1.00 1.27 1.69 2.38 unspecified Legionellosis 0.63 0.50 0.53 0.53 0.55 0.48 0.44 0.43 0.43 0.37 Leptospirosis 0.02 0.02 0.02 0.02 0.03 0.04 0.02 0.02 0.02 0.02 Lyme disease 5.01 3.20 0.12 3.80 .................. +................................ Lymphogranuloma 0.10 0.10 0.10 0.19 0.10 0.08 0.07 0.13 0.16 0.10 venereum* Malaria 0.47 0.55 0.43 0.51 0.52 0.51 0.45 0.39 0.47 0.44 Measles (rubeola) 0.37 0.12 0.88 3.82 11.17 7.33 1.38 1.50 2.61 1.18 Meningococcal 1.11 1.02 0.84 0.84 0.99 1.10 1.21 1.20 1.08 1.04 disease Mumps 0.60 0.66 1.03 1.72 2.17 2.34 2.05 5.43 3.37 1.30 Murine typhus fever & 0.01 0.01 0.02 0.02 0.02 0.02 0.02 0.03 0.02 Pertussis (whooping 1.77 2.55 1.60 1.08 1.84 1.67 1.40 1.16 1.74 1.50 cough) Plague 0.01 0.00 0.01 0.00 0.00 0.00 0.01 0.00 0.00 0.01 Poliomyelitis, 0.00 0.00 0.00 0.00 0.00 0.00 0.00 0.00 0.00 0.00 paralytic Psittacosis 0.02 0.02 0.04 0.04 0.05 0.05 0.05 0.04 0.09 0.05 Rabies, human 0.00 0.00 0.00 0.00 0.00 0.00 0.00 0.00 0.00 0.00 Rheumatic fever, 0.09 0.08 0.06 0.12 0.090.1 0.14 0.13 0.12 0.07 acute 3 Rocky Mountain 0.18 0.18 0.20 0.25 0.26 0.25 0.25 0.25 0.32 0.30 spotted fever Rubella (German 0.09 0.07 0.06 0.56 0.45 0.16 0.09 0.13 0.23 0.26 measles) Salmonellosis, 16.64 16.15 16.04 19.10 19.54 19.26 19.91 20.92 20.73 27.37 excluding typhoid fever Shigellosis 11.44 12.48 9.38 9.34 10.89 10.07 12.46 9.80 7.11 7.14 Smallpox .............................Last documented case occurred in 1949..................... Syphilis, primary 8.10 10.40 13.70 17.26 20.10 18.07 16.43 14.54 11.65 11.45 and secondary* Total, all stages* 32.00 39.70 45.30 51.69 53.80 44.94 42.37 35.81 28.50 28.50 Tetanus 0.02 0.02 0.02 0.02 0.03 0.02 0.02 0.02 0.03 0.03 Toxic-shock 0.10 0.08 0.10 0.11 0.13 0.16 0.16 0.15 0.19 0.18 syndrome Trichinosis 0.01 0.01 0.02 0.02 0.05 0.01 0.02 0.02 0.02 0.03 Tuberculosis 9.36 9.82 10.46 10.42 10.33 9.46 9.13 9.25 9.44 9.30 Tularemia 0.04 0.05 0.06 0.08 0.06 0.06 0.08 0.09 0.07 0.07 Typhoid fever 0.17 0.17 0.16 0.20 0.22 0.19 0.18 0.16 0.15 0.17 Varicella 135.76 118.54 176.54 135.82 120.06 121.77 122.43 136.68 122.42 123.23 (chickenpox) Yellow fever ....................Last indigenous case reporte 1911; last imported, 1924............. ------------------------------------------------------------------------------------------------------------------ NOTE: Rates <0.01 after rounding are shown as 0.00. * Post-censal population data from 1993 were used to calculate 1994 rates. + Not previously nationally notifiable. @ Anti-HCV antibody test available May 1990. & No longer nationally notifiable. ================================================================================================================== Return to top. Table_8 Note: To print large tables and graphs users may have to change their printer settings to landscape and use a small font size. NOTIFIABLE DISEASES -- Summary of reported cases, United States, 1985-1994 =================================================================================================================================== Disease 1994 1993 1992 1991 1990 1989 1988 1987 1986 1985 ----------------------------------------------------------------------------------------------------------------------------------- AIDS 78,279 103,533 45,472 43,672 41,595 33,722 31,001 21,070 12,932 8,249 Amebiasis 2,983 2,970 2,942 2,989 3,328 3,217 2,860 3,123 3,532 4,433 Anthrax - - 1 - - - 2 1 - - Aseptic meningitis 8,932 12,848 12,223 14,526 11,852 10,274 7,234 11,487 11,374 10,619 Botulism, total 143 97 91 114 92 89 84 82 109 122 (including wound and unsp.) Foodborne 50 27 21 27 23 23 28 17 23 49 Infant 85 65 66 81 65 60 50 59 79 70 Brucellosis 119 120 105 104 85 95 96 129 106 153 Chancroid 773 1,399 1,886 3,476 4,212 4,692 5,001 4,998 3,756 2,067 Cholera 39 18 103 26 6 - 8 6 23 4 Diphtheria 2 - 4 5 4 3 2 3 - 3 Encephalitis, 717 919 774 1,021 1,341 981 882 1,418 1,302 1,376 primary Post-infectious 143 170 129 82 105 88 121 121 124 161 Escherichia coli 1,420 ................................................ * .............................................. O157:H7 Gonorrhea 418,068 439,673 501,409 620,478 690,169 733,151 719,536 780,905 900,868 911,419 Granuloma 3 19 6 29 97 7 11 22 61 44 inguinale Haemophilus 1,174 1,419 1,412 2,764 ......................... * ................................... influenzae, invasive Hansen disease 136 187 172 154 198 163 184 238 270 361 (leprosy) Hepatitis A 29,796 24,238 23,112 24,378 31,441 35,821 28,507 25,280 23,430+ 23,210+ Hepatitis B 12,517 13,361 16,126 18,003 21,102 23,419 23,177 25,916 26,107+ 26,611+ Hepatitis,C/non-A, 4,470 4,786 6,010 3,582 2,553 2,529 2,619 2,999 3,634+ 4,184+ non-B@ Hepatitis, 444 627 884 1,260 1,671 2,306 2,470 3,102 3,940+ 5,517 unspecified Legionellosis 1,615 1,280 1,339 1,317 1,370 1,190 1,085 1,038 948 830 Leptospirosis 38 51 54 58 77 93 54 43 41 57 Lyme disease 13,043 8,257 9,895 9,465 ......................... * ................................... Lymphogranuloma venereum 235 285 302 471 277 189 185 303 396 226 Malaria 1,229 1,411 1,087 1,278 1,292 1,277 1,099 944 1,123 1,049 Measles (rubeola) 963 312 2,237 9,643 27,786 18,193 3,396 3,655 6,282 2,822 Meningococcal 2,886 2,637 2,134 2,130 2,451 2,727 2,964 2,930 2,594 2,479 disease Mumps 1,537 1,692 2,572 4,264 5,292 5,712 4,866 12,848 7,790 2,982 Murine typhus & 25 28 43 50 41 54 49 67 37 fever Pertussis 4,617 6,586 4,083 2,719 4,570 4,157 3,450 2,823 4,195 3,589 (whooping cough) Plague 17 10 13 11 2 4 15 12 10 17 Poliomyelitis, - 3 6 9 6 9 9 9 9 7 paralytic** Psittacosis 38 60 92 94 113 116 114 98 224 119 Rabies, animal 8,147 9,377 8,589 6,910 4,826 4,724 4,651 4,658 5,504 5,565 Rabies, human 6 3 1 3 1 1 - 1 - 1 Rheumatic fever, 112 112 75 127 108 144 158 141 147 90 acute Rocky Mountain 465 456 502 628 651 623 609 604 760 714 spotted fever Rubella (German 227 192 160 1,401 1,125 396 225 306 551 630 measles) Rubella, 7 5 11 47 11 3 6 5 14 - congenital syndrome Salmonellosis, 43,323 41,641 40,912 48,154 48,603 47,812 48,948 50,916 49,984 65,347 excluding typhoid fever Shigellosis 29,769 32,198 23,931 23,548 27,077 25,010 30,617 23,860 17,138 17,057 Smallpox ................................... Last documented case occurred in 1949................................ Syphilis, primary 20,627 26,498 33,973 42,935 50,223 44,540 40,117 35,147 27,883 27,131 and secondary Total, all stages 81,696 101,259 112,581 128,569 134,255 110,797 103,437 86,545 68,215 67,563 Tetanus 51 48 45 57 64 53 53 48 64 Toxic-shock 192 212 244 280 322 400 390 372 412 384 syndrome Trichinosis 32 16 41 62 129 30 45 40 39 61 Tuberculosis 24,361 25,313 26,673 26,283 25,701 23,495 22,436 22,517 22,768 22,201 Tularemia 96 132 159 193 152 152 201 214 170 177 Typhoid fever 441 440 414 501 552 460 436 400 362 402 Varicella 151,219 134,722 158,364 147,076 173,099 185,441 192,857 213,196 183,243 178,162 (chickenpox) Yellow fever ....................................Last indigenous case reported 1911; last imported, 1924............... ----------------------------------------------------------------------------------------------------------------------------------- * Not previously nationally notifiable. + Reports from New York City are not available. @ Anti-HCV antibody test available May 1990. & No longer nationally notifiable. ** Annual case reports from state health departments; numbers may not reflect changes based on retrospective case evaluations or late reports (see MMWR 1986;35:180-2). At time of publication, suspect cases from 1994 had not been confirmed by external review panel. =================================================================================================================================== Return to top. Table_9 Note: To print large tables and graphs users may have to change their printer settings to landscape and use a small font size. NOTIFIABLE DISEASES -- summary of reported cases, United States, 1975-1984 ================================================================================================================================== Disease 1984 1983 1982 1981 1980 1979 1978 1977 1976 1975 ---------------------------------------------------------------------------------------------------------------------------------- AIDS 4,445 .............................................*.................................................. Amebiasis 5,252 6,658 7,304 6,632 5,271 4,107 3,937 3,044 2,906 2,775 Anthrax 1 - - - 1 - 6 - 2 2 Aseptic meningitis 8,326 12,696 9,680 9,547 8,028 8,754 6,573 4,789 3,510 4,475 Botulism, total 123 133 97 103 89 45 105 129 55 20 (including wound and unsp.) Brucellosis 131 200 173 185 183 215 179 232 296 310 Chancroid 665 847 1,392 850 788 840 521 455 628 700 Cholera 1 1 - 19 9 1 12 3 - - Diphtheria 1 5 2 5 3 59 76 84 128 307 Encephalitis, 1,257 1,761 1,464 1,492 1,362 1,504 1,351 1,414 1,651 4,064 primary+ Post-infectious+ 108 34 36 43 40 84 78 119 175 237 Gonorrhea 878,556 900,435 960,633 990,864 1,004,029 1,004,058 1,013,436 1,002,219 1,001,994 999,937 Granuloma 30 24 17 66 51 76 72 75 71 60 inguinale Hansen disease 290 259 250 256 223 185 168 151 145 162 (leprosy) Hepatitis A 22,040 21,532 23,403 25,802 29,087 30,407 29,500 31,153 33,288 35,855 Hepatitis B 26,115 24,318 22,177 21,152 19,015 15,452 15,016 16,831 14,973 13,121 Hepatitis, non- 3,871 3,470 .................................... * ............................................ A,non-B Hepatitis,unspecified 5,531 7,149 8,564 10,975 11,894 10,534 8,776 8,639 7,488 7,158 Legionellosis @ 750 852 654 408 475 593 761 359 235 * Leptospirosis 40 61 100 82 85 94 110 71 73 93 Lymphogranuloma 170 335 235 263 199 250 284 348 365 353 venereum Malaria 1,007 813 1,056 1,388 2,062 894 731 547 471 373 Measles (rubeola) 2,587 1,497 1,714 3,124 13,506 13,597 26,871 57,345 41,126 24,374 Meningococcal 2,746 2,736 3,056 3,525 2,840 2,724 2,505 1,828 1,605 1,478 disease Mumps 3,021 3,355 5,270 4,941 8,576 14,225 16,817 21,436 38,492 59,647 Murine typhus 53 62 58 61 81 69 46 75 69 41 fever Pertussis 2,276 2,463 1,895 1,248 1,730 1,623 2,063 2,177 1,010 1,738 (whooping cough) Plague 31 40 19 13 18 13 12 18 16 20 Poliomyelitis, 8 15 8 6 9 34 15 18 14 8 total Paralytic 8 15 8 6 8 26 9 17 12 8 Psittacosis 172 142 152 136 124 137 140 94 78 49 Rabies, animal 5,567 5,878 6,212 7,118 6,421 5,119 3,254 3,130 3,073 2,627 Rabies, human 3 2 - 2 - 4 4 1 2 2 Rheumatic fever, 117 88 137 264 432 629 851 1,738 1,865 2,854 acute Rocky Mountain 838 1,126 976 1,192 1,163 1,070 1,063 1,153 937 844 spotted fever Rubella (German 752 970 2,325 2,077 3,904 11,795 18,269 20,395 12,491 16,652 measles) Rubella, 5 22 7 19 50 62 30 23 30 30 congenital syndrome Salmonellosis, 40,861 44,250 40,936 39,990 33,715 33,138 29,410 27,850 22,937 22,612 excluding typhoid fever Shigellosis 17,371 19,719 18,129 19,859 19,041 20,135 19,511 16,052 13,140 16,584 Smallpox ....................................Last documented case occurred in 1949 ................................. Syphilis, primary 28,607 32,698 33,613 31,266 27,204 24,874 21,656 20,399 23,731 25,561 and secondary Total, all stages 69,888 74,637 75,579 72,799 68,832 67,049 64,875 64,621 71,761 80,356 Tetanus 74 91 88 72 95 81 86 87 75 102 Toxic-shock 482 502 ................................. * ............................................... syndrome Trichinosis 68 45 115 206 131 157 67 143 115 252 Tuberculosis 22,255 23,846 25,520 27,373 27,749 27,669 28,521 30,145 32,105 33,989 Tularemia 291 310 275 288 234 196 141 165 157 129 Typhoid fever 390 507 425 584 510 528 505 398 419 375 Varicella 221,983 177,462 167,423 200,766 190,894 199,081 154,089 188,396 183,990 154,248 (chickenpox) Yellow fever .....................................Last indigenous case reported 1911, last imported 1924 ................ ---------------------------------------------------------------------------------------------------------------------------------- * Not previously notifiable nationally. + Beginning in 1984, data reflects change in categories for tabulating encephalitis reports that were recorded by date of report to state health departments. Data for previous years are from surveillance records reported by onset date. @ Beginning in 1982, data recorded by date of report to the state health department. Data for 1976-1981 are from surveillance records reported by onset date. ================================================================================================================================== Return to top. Table_10 Note: To print large tables and graphs users may have to change their printer settings to landscape and use a small font size. NOTIFIABLE DISEASES -- summary of reported cases, United States, 1965-1974 ================================================================================================================================== Disease 1974 1973 1972 1971 1970 1969 1968 1967 1966 1965 ---------------------------------------------------------------------------------------------------------------------------------- Amebiasis 2,743 2,235 2,199 2,752 2,888 2,915 3,005 3,157 2,921 2,768 Anthrax 22 25 2 4 3 2 5 7 Aseptic meningitis 3,197 4,846 4,634 5,176 6,480 3,672 4,494 3,082 3,058 2,329 Botulism 28 34 22 25 12 16 7 5 9 19 Brucellosis 240 202 196 183 213 235 218 265 262 262 Chancroid 945 1,165 1,414 1,320 1,416 1,104 845 784 838 982 Cholera - 1 - 1 - - - - - 2 Diphtheria 272 228 152 215 435 241 260 219 209 164 Encephalitis, 1,164 1,613 1,059 1,524 1,580 1,613 1,781 1,478 2,121 1,722 primary Post-infectious 218 354 243 439 370 304 502 1,060 964 981 Gonorrhea 906,121 842,621 767,215 670,268 600,072 534,872 464,543 404,836 351,738 324,925 Granuloma inguinale 47 62 81 89 124 154 156 154 148 155 Hansen disease 118 146 130 131 129 98 123 81 109 96 (leprosy) Hepatitis A 40,358 50,749 54,074 59,606 56,797 48,416 45,893 38,909 32,859 33,856* (infectious) Hepatitis B (serum) 10,631 8,451 9,402 9,556 8,310 5,909 4,829 2,458 1,497 Hepatitis, 8,351 .............................................. + ................................................. unspecified Leptospirosis 68 57 41 62 47 89 69 67 72 84 Lymphogranuloma 394 408 756 692 612 520 485 371 308 878 venereum Malaria 293 237 742 2,375 3,051 3,102 2,317 2,022 565 147 Measles (rubeola) 22,094 26,690 32,275 75,290 47,351 25,826 22,231 62,705 204,136 261,904 Meningococcal 1,346 1,378 1,323 2,262 2,505 2,951 2,623 2,161 3,381 3,040 disease Mumps 59,128 69,612 74,215 124,939 104,953 90,918 152,209............ + ......................... Murine typhus fever 26 32 18 23 27 36 36 52 33 28 Pertussis (whooping 2,402 1,759 3,287 3,036 4,249 3,285 4,810 9,718 7,717 6,799 cough) Plague 8 2 1 2 13 5 3 3 5 8 Poliomyelitis, 7 8 31 21 33 20 53 41 113 72 total Paralytic 7 7 29 17 31 18 53 40 106 61 Psittacosis 164 33 52 32 35 57 43 41 50 60 Rabies, animal 3,151 3,640 4,369 4,310 3,224 3,490 3,591 4,481 4,178 4,574 Rabies,human - 1 2 2 3 1 1 2 1 2 Rheumatic fever, 2,431 2,560 2,614 2,793 3,227 3,229 3,470 3,985 4,472 4,998 acute Rocky Mountain 754 668 523 432 380 498 298 305 268 281 spotted fever Rubella (German 11,917 27,804 25,507 45,086 56,552 57,686 49,371 46,888 46,975 + measles) Rubella, congenital 45 35 42 68 77 31 14 10 11 + syndrome Salmonellosis, 21,980 23,818 22,151 21,928 22,096 18,419 16,514 18,120 16,841 17,161 excluding typhoid fever Shigellosis 22,600 22,642 20,207 16,143 13,845 11,946 12,180 13,474 11,888 11,027 Smallpox ............................................Last documented case occurred in 1949........................... Streptococcal sore NN NN NN NN 433,405 450,008 435,013 453,351 427,752 395,168 throat and scarlet fever Syphilis,primary 25,385 24,825 24,429 23,783 21,982 19,130 19,019 21,053 21,414 23,338 and secondary Total, all stages 83,771 87,469 91,149 95,997 91,382 92,162 96,271 102,581 105,159 112,842 Tetanus 101 101 128 116 148 192 178 263 235 300 Trichinosis 120 102 89 103 109 215 77 66 115 199 Tuberculosis @ 30,122 30,998 32,882 35,217 37,137 39,120 42,623 45,647 47,767 49,016 Tularemia 144 171 152 187 172 149 186 184 208 264 Typhoid fever 437 680 398 407 346 364 395 396 378 454 Varicella 141,495 182,927 164,114 ................................... + ........................................ (chickenpox) Yellow fever .................................Last indigenous case reported 1911;last imported, 1924..................... ---------------------------------------------------------------------------------------------------------------------------------- * Includes serum hepatitis. + Not previously notifiable nationally. @ Case data subsequent to 1974 are not comparable to prior years because of changes in reporting criteria that became effective in 1975. ================================================================================================================================== Return to top. Table_11 Note: To print large tables and graphs users may have to change their printer settings to landscape and use a small font size. NOTIFIABLE DISEASES -- summary of reported cases, United States, 1955-1964 ================================================================================================================================== Disease 1964 1963 1962 1961 1960 1959 1958 1957 1956 1955 ---------------------------------------------------------------------------------------------------------------------------------- Amebiasis 3,304 2,886 3,048 2,850 3,424 3,508 4,380 5,031 3,689 3,348 Anthrax 5 3 9 14 23 12 16 26 38 39 Aseptic meningitis 2,177 1,844 2,654 5,162* 1,593 ........................ + ............................. Botulism 23 47 10 14 12 20 6 28 17 16 Brucellosis 411 407 409 636 751 892 924 983 1,300 1,444 Chancroid 1,247 1,220 1,344 1,438 1,680 1,537 1,595 1,637 2,135 2,649 Cholera - - - - - - - - - - Dengue NN NN NN - - - - - 2 1 Diphtheria 293 314 444 617 918 934 918 1,211 1,568 1,984 Encephalitis, acute 2,002 1,993 2,094 2,248 2,341 2,437 2,587 2,135 2,624 2,166 infectious (primary) Post-infectious 1,585 .............................................+.................................................... Gonorrhea 300,666 278,289 263,714 264,158 258,933 240,254 232,386 214,496 224,346 236,197 Granuloma inguinale 135 173 207 241 296 265 314 348 357 490 Hansen disease 97 103 80 63 54 44 39 36 52 75 (leprosy) Hepatitis@ 37,740 42,974 53,016 72,651 41,666 23,574 16,294 14,922 19,234 31,961 Leptospirosis 142 89 79 71 53 83 55 47 44 24 Lymphogranuloma 732 586 590 787 835 604 434 448 500 762 venereum Malaria 93 99 118 73 72 71 85 132 234 522 Measles (rubeola) 458,083 385,156 481,530 423,919 441,703 406,162 763,094 486,799 611,936 555,156 Meningococcal 2,826 2,470 2,150 2,232 2,259 2,180 2,581 2,691 2,735 3,455 disease Murine typhus fever 30 35 32 46 68 51 71 113 98 135 Pertussis (whooping 13,005 17,135 17,749 11,468 14,809 40,005 32,148 28,295 31,732 62,786 cough) Plague - 1 - 3 2 4 - 1 1 - Poliomyelitis, total 122 449 910 1,312 3,190 8,425 5,787 5,485 15,140 28,985 Paralytic 106 396 762 988 2,525 6,289 3,697 2,499 7,911 13,850 Psittacosis 53 76 79 102 113 147 158 278 568 334 Rabies, animal 4,780 3,929 3,732 3,599 3,567 4,177 4,787 4,542 5,681 5,799 Rabies, human & 11 2 3 2 7 5 5 1 0 4 Rheumatic fever, 7,491 7,561 7,977 10,470 9,022 8,285 6,889 6,427 6,562 + acute Rocky Mountain 277 216 240 219 204 199 243 240 293 295 spotted fever Salmonellosis, 17,144 15,390 9,680 8,542 6,929 6,606 6,363 6,693 6,704 5,447 excluding typhoid fever Shigellosis 12,984 13,009 12,443 12,571 12,487 12,888 11,861 9,822 10,306 13,912 Smallpox .............................................Last documented case occurred in 1949......................... Streptococcal sore 402,334 342,161 315,809 338,410 315,173 334,715 264,097 226,973 176,392 147,502 throat and scarlet fever Syphilis, primary 22,969 22,251 21,067 19,851 16,145 9,799 7,176 6,576 6,392 6,454 and secondary Total, all stages 114,325 124,137 126,245 124,658 122,538 120,824 113,884 123,758 130,201 122,392 Tetanus 289 325 322 379 368 445 445 447 468 462 Trichinosis 198 208 194 306 160 227 176 178 262 264 Tuberculosis** 50,874 54,042 53,315 53,726 55,494 57,535 63,534 67,149 69,895 77,368 Tularemia 342 327 328 365 390 459 587 601 522 584 Typhoid fever 501 566 608 814 816 859 1,043 1,231 1,700 1,704 Yellow fever .....................................Last indigenous case reported 1911;last imported, 1924............... ---------------------------------------------------------------------------------------------------------------------------------- * Includes Meningitis, other, for some states. + Not previously notifiable nationally. @ Data includes both infectious and serum hepatitis. & Registered deaths, 1955-1961. ** Includes new active cases. ================================================================================================================================== Return to top. Table_12 Note: To print large tables and graphs users may have to change their printer settings to landscape and use a small font size. NOTIFIABLE DISEASES -- summary of reported cases, United States, 1945-1954 ================================================================================================================================== Disease 1954 1953 1952 1951 1950 1949 1948 1947 1946 1945 ---------------------------------------------------------------------------------------------------------------------------------- Amebiasis 3,523 4,444 4,280 3,550 4,568 5,543 4,871 3,365 4,093 3,412 Anthrax 22 45 47 60 49 54 60 69 40 40 Botulism 18 18 18 33 20 24 39 44 ........NA........ Brucellosis 1,823 2,032 2,537 3,139 3,510 4,235 4,991 6,321 5,887 5,049 Chancroid* 3,003 3,338 3,738 4,233 4,977 6,707 7,661 9,515 7,091 5,515 Cholera - - - - - - - - - - Dengue 6 8 5 16 26 46 24 35 40 106 Diphtheria 2,041 2,355 2,960 3,983 5,796 7,969 9,493 12,262 16,354 18,675 Encephalitis, acute 2,606 1,935 1,912 1,123 1,135 903 730 785 728 785 infectious (primary) Gonorrhea* 242,050 238,340 244,957 254,470 286,746 317,950 345,501 380,666 368,020 287,181 Granuloma 618 667 951 1,352 1,783 2,402 2,469 2,330 2,232 1,857 inguinale* Hansen disease 56 60 57 57 44 41 63 56 43 40 (leprosy) Hepatitis, 50,093 33,700 17,428 7,349 2,820 2,027 709 1,092 ........NA...... infectious+ Leptospirosis 48 42 62 9 30 17 18 14 ........NA...... Lymphogranuloma 875 983 1,200 1,300 1,427 1,925 2,429 2,526 2,603 2,631 venereum* Malaria 715 1,310 7,023 5,600 2,184 4,151 9,606 15,116 48,610 62,763 Measles (rubeola) 682,720 449,146 683,077 530,118 319,124 625,281 615,104 222,375 659,843 146,013 Meningococcal 4,436 5,077 4,884 4,164 3,788 3,519 3,376 3,420 5,693 8,208 disease Murine typhus fever 163 221 205 378 685 985 1,171 2,050 3,365 5,193 Pertussis (whooping 60,886 37,129 45,030 68,687 120,718 69,479 74,715 156,517 109,860 133,792 cough) Plague - - - 1 3 3 - 1 - - Poliomyelitis, 38,476 35,592 57,879 28,386 33,300 42,033 27,726 10,827 25,698 13,624 total Psittacosis 563 169 135 25 26 35 32 27 26 27 Rabies, animal@ 7,297 8,903 8,445 8,008 7,901 7,587 8,495 8,920 10,850 9,928 Rabies, human& 13 12 24 18 18 10 24 26 34 43 Rocky Mountain 294 313 327 347 464 570 547 596 587 472 spotted fever Salmonellosis, 5,375 3,946 2,596 1,773 1,233 1,243 882 951 723 649 excluding typhoid fever Shigellosis 13,846 16,533 23,197 32,215 23,367 29,080 23,753 17,048 24,286 34,943 Smallpox - - - - - 49 57 176 337 346 Streptococcal sore 147,785 132,935 113,677 84,151 64,494 87,220 91,295 93,595 125,511 185,570 throat and scarlet fever Syphilis, primary 7,147 8,637 10,449 14,485 23,939 41,942 68,174 93,545 94,957 77,007 and secondary* Total, all stages* 130,697 148,573 167,762 174,924 217,558 256,463 314,313 355,592 963,647 359,114 Tetanus 524 506 484 506 486 579 601 560 ........NA....... Trichinosis 277 395 367 393 327 353 487 451 ........NA....... Tuberculosis** 79,775 84,304 86,700 118,491 121,742 134,865 137,006 134,946 119,256 114,931 Tularemia 681 601 668 702 927 1,179 1,086 1,401 1,355 900 Typhoid fever 2,169 2,252 2,341 2,128 2,484 2,795 2,840 3,075 3,268 4,211 Yellow fever ................................Last indigenous case reported 1911; last imported, 1924.......... ---------------------------------------------------------------------------------------------------------------------------------- * Data were reported for fiscal years 1945-1946; data were reported by calendar year beginning in 1947. + Data for 1953 and 1954 includes serum hepatitis. @ Data for 1945-1951 from Bureau of Animal Industry, U. S. Department of Agriculture, Agricultural Research Administration. & Registered deaths. ** Includes newly reported active and inactive cases, 1945-1951; new active cases only beginning 1952. ================================================================================================================================== Return to top. Table_13 Note: To print large tables and graphs users may have to change their printer settings to landscape and use a small font size. NOTIFIABLE DISEASES -- deaths from specified notifiable diseases, United States, 1983-1992. (Numbers in ICD column refer to the category numbers listed in the Ninth Revision of the International Classification of Diseases, 1975.) ===================================================================================================================================================== Cause of Death ICD* 1992 1991 1990 1989 1988 1987 1986 1985 1984 1983 ----------------------------------------------------------------------------------------------------------------------------------------------------- AIDS+ *042-*044 33,566 29,555 25,188 22,082 16,602 13,468 10,900 6,040 2,943 1,141 Amebiasis 006 6 5 5 4 7 9 8 10 10 21 Anthrax 022 - - - - - - - - - - Botulism, foodborne 005.1 1 2 4 2 1 - 1 4 4 7 Brucellosis 023 - - - - 2 1 1 1 - - Chancroid 099.0 - 1 - - - - - - - - Cholera 001 2 2 2 - - 1 - 1 - - Diphtheria 032 1 - 1 - - 1 - - - - Encephalitis, acute 062-064,049 126 142 167 143 133 146 230 153 168 169 infectious@ Gonococcal 098 4 3 3 4 3 7 7 2 3 4 infections Granuloma inguinale 099.2 - - - - - - - - - - Haemophilus 041.5 16 17 16 16 25 25 21 22 14 11 influenzae, invasive Hansen disease 030 2 - 3 4 - 1 1 2 6 3 (leprosy) Hepatitis, viral, 070.0,070.1 82 71 76 88 70 77 65 80 77 82 infectious (Hep A) Hepatitis, viral, 070.2,070.3 903 912 816 711 621 595 557 490 465 438 serum (Hep B) Hepatitis, viral, 070.4-070.9 1,016 857 686 717 599 510 384 372 327 343 other and unsp. Leptospirosis 100 2 1 2 - 2 1 - 4 - 5 Lymphogranuloma 099.1 1 1 2 2 - - - 3 - - venereum Malaria 084 8 4 3 11 7 5 5 13 7 3 Measles (rubeola) 055 4 27 64 32 3 2 2 4 1 4 Meningococcal disease 036 201 198 215 273 278 258 286 257 300 299 Mumps 072 - 1 1 3 2 2 - - 1 2 Murine typhus fever 081.0 - - - 1 - - - 1 - - Pertussis (whooping 033 5 - 12 12 4 1 6 4 7 5 cough) Plague 020 1 - - - - 1 - 1 3 5 Poliomyelitis, total 045.0-045.9 - 1 - - 1 - - 3 - - Psittacosis 073 4 - 2 1 1 2 - 1 - 1 Rabies, human 071 1 3 1 1 - 1 - - 2 2 Rheumatic fever, acute 390-392 100 89 66 70 76 42 60 56 70 87 Rocky Mountain 082.0 13 13 20 10 20 21 19 22 34 35 spotted fever Rubella (German measles) 056 1 1 8 4 1 - 1 1 1 3 Salmonellosis, 002.1-002.9, 47 53 80 99 66 105 102 117 90 82 include. paratyphoid 003 fever Shigellosis 004 8 10 10 16 8 13 4 17 8 9 Syphilis 090-097 91 93 106 105 85 98 80 80 105 121 Tetanus 037 9 11 11 9 17 16 22 23 20 22 Trichinosis 124 - - - 1 - - - 1 - - Tuberculosis (all 010-018 1,705 1,713 1,810 1,970 1,921 1,755 1,782 1,752 1,729 1,779 forms) Tularemia 021 3 2 1 1 2 4 4 3 2 1 Typhoid fever 002.0 - 1 1 - - 2 2 - - 3 Varicella 052 100 81 120 89 83 89 47 68 53 57 (chickenpox) ----------------------------------------------------------------------------------------------------------------------------------------------------- * Numbers in ICD column refer to the category numbers listed in the Ninth Revision of the International Classification of Diseases, 1975. (The asterisks in the ICD column pertain to the ICD code, not a footnote. They indicate that the numbers are not part of the ICD but were introduced for use in the United States.) + For 1983-1986, deaths are estimated from death certificates with mention of conditions coded to deficiency of cell-mediated immunity (ICD-9 No. 279.1). Includes other human immunodeficiency virus (HIV)-related deaths and other diseases classifiable as deficiency of cell-mediated immunity. @ Arthropod-borne encephalitis and other nonarthropod-borne viral diseases of the central nervous system. Source: National Center for Health Statistics System, 1983-1992. Deaths are classified according to the Ninth Revision, ICD. ===================================================================================================================================================== Return to top. Disclaimer All MMWR HTML versions of articles are electronic conversions from ASCII text into HTML. This conversion may have resulted in character translation or format errors in the HTML version. Users should not rely on this HTML document, but are referred to the electronic PDF version and/or the original MMWR paper copy for the official text, figures, and tables. An original paper copy of this issue can be obtained from the Superintendent of Documents, U.S. Government Printing Office (GPO), Washington, DC 20402-9371; telephone: (202) 512-1800. Contact GPO for current prices. **Questions or messages regarding errors in formatting should be addressed to mmwrq@cdc.gov.Page converted: 09/19/98 |
|||||||||
This page last reviewed 5/2/01
|