By the Numbers: Diabetes in America
Source: National Diabetes Statistics Report, 2023

Total Diabetes
From 2001 to 2021, diabetes prevalence significantly increased among US adults 18 or older.
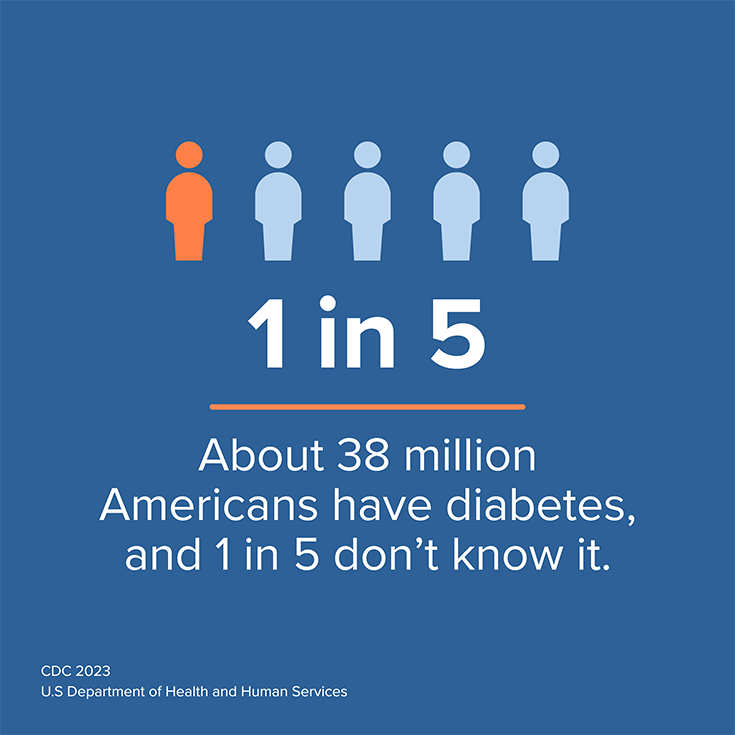
- 38.4 million people have diabetes—that’s 11.6% of the US population.
- 29.7 million people have been diagnosed with diabetes.
- 8.7 million people who have diabetes have not been diagnosed and do not know they have it.
Total Prediabetes
- 97.6 million US adults have prediabetes.
- 27.2 million adults 65 or older have prediabetes.
Cost of Diabetes
- The total estimated cost of diagnosed diabetes in 2022 was $413 billion, including $307 billion in direct medical costs and $106 billion in indirect costs attributable to diabetes.
- Excess medical costs associated with diabetes were about $12,000 per person in 2022.
Diabetes Disparities
By Race and Ethnicity
Certain racial and ethnic groups are at a higher risk of developing diabetes than other groups.
Percentage of US Adults 18 or Older With Diagnosed Diabetes, by Race and Ethnicity, 2019–2021
| Race and Ethnicity | Percentage |
| American Indian or Alaska Native | 14.5 |
| Asian, non-Hispanic | 9.1 |
| Black, non-Hispanic | 12.1 |
| Hispanic, overall | 11.7 |
| White, non-Hispanic | 6.9 |
2019–2021 National Health Interview Survey, except American Indian or Alaska Native data, which were from the Indian Health Service National Data Warehouse (2019 data only).
By Education Level
People who have not completed high school have the highest prevalence of diabetes. People with more than a high school education have the lowest prevalence.
Percentage of US Adults 18 or Older With Diagnosed Diabetes, by Education Level, 2019–2021
| Education Level | Percentage |
| Less than high school | 13.1 |
| High school | 9.1 |
| More than high school | 6.9 |
Data source: 2019–2021 National Health Interview Survey.
By Income Level
Adults with a family income below the federal poverty level (FPL) have the highest prevalence of diabetes.
US Adults 18 or Older With Diagnosed Diabetes, by Family Income Level, 2019–2021
| Family Income Level | Percentage |
| Less than 100% FPL | 13.1 |
| 100%–299% FPL | 10.3 |
| 300%–499% FPL | 7.7 |
| 500% FPL or more | 5.1 |
Data source: 2019–2021 National Health Interview Survey.
Among Youth by Diabetes Type
Type 1 Diabetes
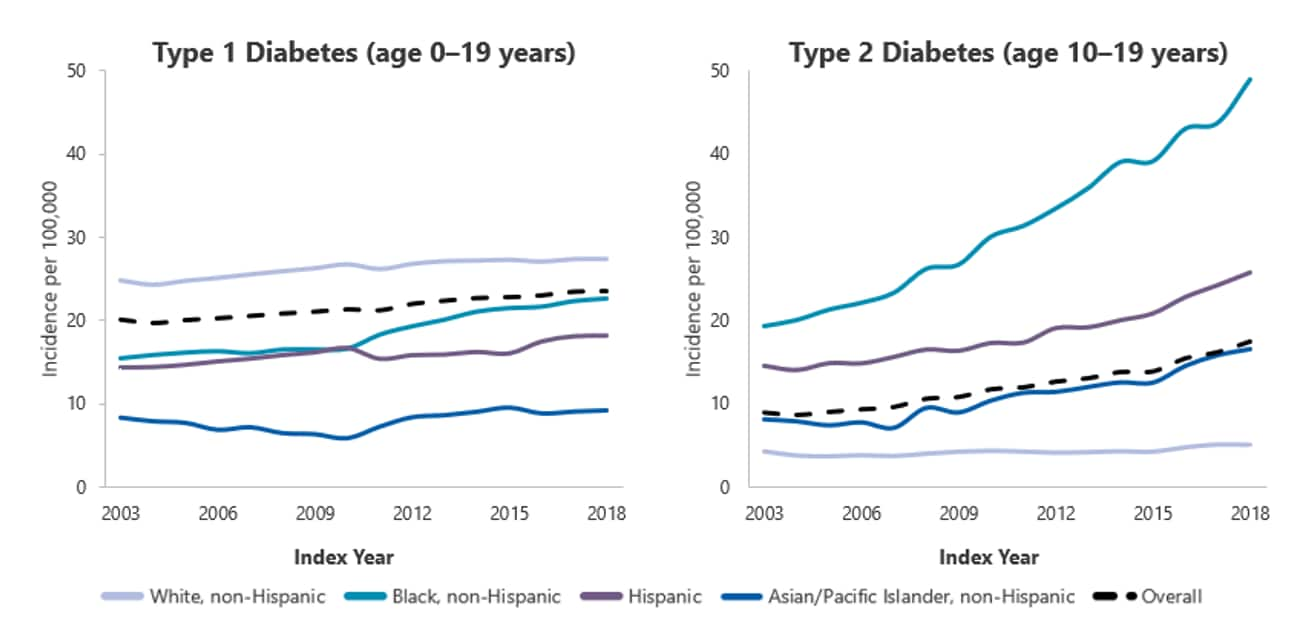
Type 1 diabetes is most often diagnosed in children, teens, and young adults. Rates differ by racial and ethnic group.
During 2002-2018, non-Hispanic Asian or Pacific Islander children and adolescents had the largest significant increases in incidence of type 1 diabetes, followed by Hispanic and non-Hispanic Black children and adolescents.
Type 2 Diabetes
Type 2 diabetes usually develops later in a person’s life. However, in recent decades, type 2 diabetes has increased among US children and adolescents aged 10 to 19. Rates differ by racial and ethnic group.
Trends in Incidence of Type 1 and Type 2 Diabetes in Children and Adolescents, Overall and by Race and Ethnicity, 2002–2018

Data source: SEARCH for Diabetes in Youth Study.